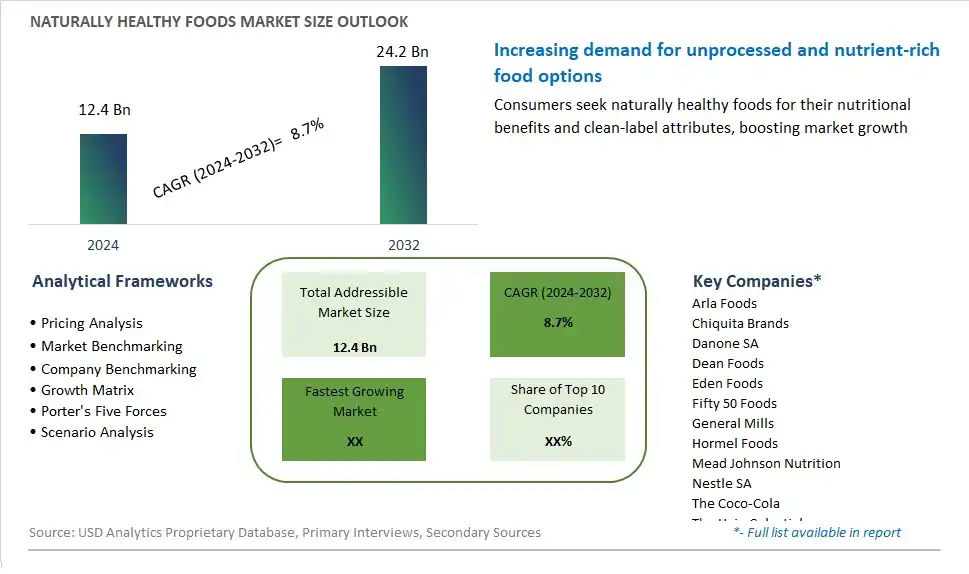
Global Naturally Healthy Foods Market Size is valued at $12.4 Billion in 2024 and is forecast to register a growth rate (CAGR) of 8.7% to reach $24.2 Billion by 2032.
The global Naturally Healthy Foods Market Comprehensive Study analyzes and forecasts the market size across 6 regions and 24 countries for diverse segments -By Type (Packaged Foods, Beverages, Others), By Application (Supermarkets/Hypermarkets, Independent Small Groceries, Convenience Stores)
An Introduction to Naturally Healthy Foods Market
In 2024, the market for naturally healthy foods is thriving as consumers prioritize nutrient-dense, minimally processed foods that promote overall health and well-being. Naturally healthy foods are made from wholesome, whole food ingredients, free from artificial additives, preservatives, and excessive amounts of sugar, salt, and unhealthy fats. From fruits, vegetables, and whole grains to nuts, seeds, and lean proteins, naturally healthy foods offer a rich array of vitamins, minerals, antioxidants, and phytonutrients that support optimal health and vitality. With growing concerns about diet-related chronic diseases, obesity, and lifestyle-related health conditions, consumers are gravitating towards naturally healthy foods as a foundation for balanced eating patterns and sustainable lifestyles. Moreover, the rise of plant-based diets, flexitarianism, and mindful eating is driving demand for plant-powered foods that are not only nutritious but also delicious, convenient, and environmentally sustainable. As the market for naturally healthy foods continues to evolve, expect to see further innovation in product formulations, packaging designs, and culinary techniques that make healthy eating more accessible, enjoyable, and inclusive for consumers of all ages and dietary preferences.
Naturally Healthy Foods Competitive Landscape
The market report analyses the leading companies in the industry including Arla Foods, Chiquita Brands, Danone SA, Dean Foods, Eden Foods, Fifty 50 Foods, General Mills, Hormel Foods, Mead Johnson Nutrition, Nestle SA, The Coco-Cola, The Hain Celestial, The Kraft Heinz Co., Unilever Plc, Worthington Foods, and Others.
Naturally Healthy Foods Market Dynamics
Naturally Healthy Foods Market Trend: Shift Towards Health-Conscious Lifestyles
A significant trend in the naturally healthy foods market is the shift towards health-conscious lifestyles among consumers. With increasing awareness of the importance of nutrition and wellness in maintaining optimal health, there's a growing demand for naturally healthy foods that are minimally processed, nutrient-dense, and free from artificial additives and preservatives. Consumers are seeking out whole foods such as fruits, vegetables, whole grains, nuts, seeds, and lean proteins, as well as natural food products with clean labels and simple ingredient lists. This trend is driven by a desire to support overall well-being, prevent chronic diseases, and enhance longevity through dietary choices that prioritize health and nutrition.
Market Driver: Rising Incidence of Diet-Related Health Issues
A key driver for the naturally healthy foods market is the rising incidence of diet-related health issues such as obesity, diabetes, cardiovascular disease, and digestive disorders. As lifestyle-related health conditions continue to rise globally, there's a growing recognition of the role that diet plays in preventing and managing chronic diseases. Consumers are increasingly turning to naturally healthy foods as part of their preventive healthcare strategy, opting for nutrient-rich, whole foods that provide essential vitamins, minerals, antioxidants, and fiber to support optimal health and reduce the risk of diet-related ailments. This driver is reinforced by factors such as the influence of healthcare professionals, nutritionists, and wellness experts in promoting healthy eating habits and the growing popularity of diets such as the Mediterranean diet and plant-based diets that emphasize naturally healthy food choices.
Market Opportunity: Expansion into Convenient and Accessible Formats
An opportunity for the naturally healthy foods market lies in expansion into convenient and accessible formats to meet the needs of busy, on-the-go consumers seeking healthy eating options. Companies can capitalize on this opportunity by developing ready-to-eat meals, snack bars, pre-cut fruits and vegetables, grab-and-go salads, and other convenient food products made from natural, wholesome ingredients. Moreover, there's potential to leverage e-commerce platforms, meal delivery services, and retail partnerships to make naturally healthy foods more accessible to consumers, including those in underserved or remote areas. By offering convenient and accessible options for naturally healthy eating, companies can tap into new market segments, increase consumer convenience, and drive growth in the naturally healthy foods market while promoting healthier eating habits and lifestyles.
Naturally Healthy Foods Market Share Analysis: Packaged Foods held the dominant market share in 2024
Within the Naturally Healthy Foods market categorized by type, the Packaged Foods segment is the largest, driven by the convenience, shelf-stability, and wide variety of options it offers to consumers seeking nutritious and wholesome alternatives. Packaged foods in this category encompass a diverse range of products such as granola bars, nuts and seeds, whole grain snacks, and ready-to-eat meals, all formulated with natural, minimally processed ingredients to preserve their nutritional integrity. The increasing pace of modern lifestyles has led to a growing demand for on-the-go and convenient food options without compromising on healthfulness. Additionally, the rising prevalence of health and wellness trends prompts consumers to seek out packaged foods that align with their dietary preferences and lifestyle choices. As a result, the Packaged Foods segment dominates the Naturally Healthy Foods market, reflecting the significant demand for convenient, nutritious, and portable food solutions among health-conscious consumers.
Naturally Healthy Foods Market Share Analysis: Independent Small Groceries market is poised to register the fastest growth rae over the forecast period to 2032
In the Naturally Healthy Foods market segmented by application, the Independent Small Groceries segment is the fastest-growing, propelled by several factors including increasing consumer preference for locally sourced and artisanal products, personalized shopping experiences, and the growing demand for niche and specialty health foods. Independent small groceries offer a curated selection of naturally healthy foods, often sourced from local producers and artisans, appealing to consumers seeking unique and authentic food options. Further, these stores prioritize customer service and community engagement, fostering a sense of trust and loyalty among shoppers. Additionally, the COVID-19 pandemic has prompted consumers to support local businesses and explore neighborhood grocery options, further driving the growth of independent small groceries. As a result, the Independent Small Groceries segment stands out as a key driver of growth in the Naturally Healthy Foods market, reflecting the increasing demand for personalized, locally sourced, and specialty health foods among discerning consumers.
Naturally Healthy Foods Market Segmentation
By Type
Packaged Foods
Beverages
Others
By Application
Supermarkets/Hypermarkets
Independent Small Groceries
Convenience Stores
Countries Analyzed
North America (US, Canada, Mexico)
Europe (Germany, UK, France, Spain, Italy, Russia, Rest of Europe)
Asia Pacific (China, India, Japan, South Korea, Australia, South East Asia, Rest of Asia)
South America (Brazil, Argentina, Rest of South America)
Middle East and Africa (Saudi Arabia, UAE, Rest of Middle East, South Africa, Egypt, Rest of Africa)
Naturally Healthy Foods Companies Profiled in the Study
Arla Foods
Chiquita Brands
Danone SA
Dean Foods
Eden Foods
Fifty 50 Foods
General Mills
Hormel Foods
Mead Johnson Nutrition
Nestle SA
The Coco-Cola
The Hain Celestial
The Kraft Heinz Co.
Unilever Plc
Worthington Foods
*- List Not Exhaustive
Chapter 1. TABLE OF CONTENTS
Chapter 2. Introduction to Naturally Healthy Foods Market
2.1. Market Overview
2.2. Key Statistics and Report Highlights
2.3. Scope of the Comprehensive Study
2.3.1. Market Definition
2.3.2 Countries and Regions Covered
2.3.3 Research Objective
2.3.4 Units, Currency, and Conversions
2.3.5 Industry Value Chain
2.4. Key Market Segments
2.5. Key Companies
2.6. Study Period
Chapter 3. Strategic Analysis Review
3.1. Naturally Healthy Foods Pricing Analysis and Forecast
3.2. Porter’s Five Forces
3.3. Market Ecosystem
3.4. SWOT Analysis
3.5. Regulatory Scenario
3.3. Effects of Inflation, Russia-Ukraine War, moderating economic growth, and other macroeconomic factors
Chapter 4. Competitive Landscape
4.1. Market Share Analysis
4.1.1. Global Naturally Healthy Foods Market Share by Company, 2023
4.1.2. Product Offerings of Leading Naturally Healthy Foods Companies
4.2. Market Entropy
4.2.1. New Product Launches in the Industry
4.2.2. Mergers, Acquisitions, Joint ventures, and Partnerships
4.3. Key Strategies and Best Practices
Chapter 5. Global Market Projections: Best, Reference, and Low Case Scenarios
5.1. Growth Analysis- Case Scenario Definitions
5.2. Low Growth Case Scenario Forecasts
5.3. Reference Growth Case Scenario Forecasts
5.4. High Growth Case Scenario Forecasts
Chapter 6. Market Dynamics
6.1. Naturally Healthy Foods Market Drivers
6.2. Naturally Healthy Foods Market Challenges
6.6. Naturally Healthy Foods Market Opportunities
6.4. Naturally Healthy Foods Market Trends
Chapter 7. Global Naturally Healthy Foods Market Outlook Trends
7.1. Global Naturally Healthy Foods Revenue (USD Million) and CAGR (%) by Type (2021-2032)
7.2. Global Naturally Healthy Foods Revenue (USD Million) and CAGR (%) by Application (2021-2032)
7.3. Global Naturally Healthy Foods Revenue (USD Million) and CAGR (%) by Product (2021-2032)
By Type
Packaged Foods
Beverages
Others
By Application
Supermarkets/Hypermarkets
Independent Small Groceries
Convenience Stores
Chapter 8. Global Naturally Healthy Foods Regional Analysis and Outlook
8.1. Global Naturally Healthy Foods Revenue (USD Million) By Regions (2021- 2032)
8.2. North America Naturally Healthy Foods Revenue (USD Million) by Country (2021-2032)
8.2.1. United States Naturally Healthy Foods Regional Analysis and Outlook
8.2.2. Canada Naturally Healthy Foods Regional Analysis and Outlook
8.2.3. Mexico Naturally Healthy Foods Regional Analysis and Outlook
8.3. Europe Naturally Healthy Foods Revenue (USD Million), by Country (2021-2032)
8.3.1. Germany Naturally Healthy Foods Regional Analysis and Outlook
8.3.2. France Naturally Healthy Foods Regional Analysis and Outlook
8.3.3. United Kingdom Naturally Healthy Foods Regional Analysis and Outlook
8.3.4. Spain Naturally Healthy Foods Regional Analysis and Outlook
8.3.5. Italy Naturally Healthy Foods Regional Analysis and Outlook
8.3.6. Russia Naturally Healthy Foods Regional Analysis and Outlook
8.3.7. Rest of Europe Naturally Healthy Foods Regional Analysis and Outlook
8.4. Asia Pacific Naturally Healthy Foods Revenue (USD Million) by Country (2021-2032)
8.4.1. China Naturally Healthy Foods Regional Analysis and Outlook
8.4.2. Japan Naturally Healthy Foods Regional Analysis and Outlook
8.4.3. India Naturally Healthy Foods Regional Analysis and Outlook
8.4.4. South Korea Naturally Healthy Foods Regional Analysis and Outlook
8.4.5. Australia Naturally Healthy Foods Regional Analysis and Outlook
8.4.6. South East Asia Naturally Healthy Foods Regional Analysis and Outlook
8.4.7. Rest of Asia Pacific Naturally Healthy Foods Regional Analysis and Outlook
8.5. South America Naturally Healthy Foods Revenue (USD Million), by Country (2021-2032)
8.5.1. Brazil Naturally Healthy Foods Regional Analysis and Outlook
8.5.2. Argentina Naturally Healthy Foods Regional Analysis and Outlook
8.5.3. Rest of South America Naturally Healthy Foods Regional Analysis and Outlook
8.6. Middle East and Africa Naturally Healthy Foods Revenue (USD Million) by Country (2021-2032)
8.6.1. Middle East Naturally Healthy Foods Regional Analysis and Outlook
8.6.2. Africa Naturally Healthy Foods Regional Analysis and Outlook
Chapter 9. North America Naturally Healthy Foods Analysis and Outlook
9.1. North America Naturally Healthy Foods Revenue (USD Million) by Segments (2021-2032)
9.1.1. North America Naturally Healthy Foods Revenue (USD Million) by Type (2021-2032)
9.1.2. North America Naturally Healthy Foods Revenue (USD Million) by Application (2021-2032)
9.1.3. North America Naturally Healthy Foods Revenue (USD Million) by Product (2021-2032)
By Type
Packaged Foods
Beverages
Others
By Application
Supermarkets/Hypermarkets
Independent Small Groceries
Convenience Stores
Chapter 10. Europe Naturally Healthy Foods Analysis and Outlook
10.1. Europe Naturally Healthy Foods Revenue (USD Million), by Segments (USD Million) (2021-2032)
10.1.1. Europe Naturally Healthy Foods Revenue (USD Million) by Type (2021-2032)
10.1.2. Europe Naturally Healthy Foods Revenue (USD Million) by Application (2021-2032)
10.1.3. Europe Naturally Healthy Foods Revenue (USD Million) by Product (2021-2032)
By Type
Packaged Foods
Beverages
Others
By Application
Supermarkets/Hypermarkets
Independent Small Groceries
Convenience Stores
Chapter 11. Asia Pacific Naturally Healthy Foods Analysis and Outlook
11.1. Asia Pacific Naturally Healthy Foods Revenue (USD Million), and Revenue (USD Million) by Segments (2021-2032)
11.1.1. Asia Pacific Naturally Healthy Foods Revenue (USD Million) by Type (2021-2032)
11.1.2. Asia Pacific Naturally Healthy Foods Revenue (USD Million) by Application (2021-2032)
11.1.3. Asia Pacific Naturally Healthy Foods Revenue (USD Million) by Product (2021-2032)
By Type
Packaged Foods
Beverages
Others
By Application
Supermarkets/Hypermarkets
Independent Small Groceries
Convenience Stores
Chapter 12. South America Naturally Healthy Foods Analysis and Outlook
12.1. South America Naturally Healthy Foods Revenue (USD Million), by Segments (2021-2032)
12.1.1. South America Naturally Healthy Foods Revenue (USD Million) by Type (2021-2032)
12.1.2. South America Naturally Healthy Foods Revenue (USD Million) by Application (2021-2032)
12.1.3. South America Naturally Healthy Foods Revenue (USD Million) by Product (2021-2032)
By Type
Packaged Foods
Beverages
Others
By Application
Supermarkets/Hypermarkets
Independent Small Groceries
Convenience Stores
Chapter 13. Middle East and Africa Naturally Healthy Foods Analysis and Outlook
13.1. Middle East and Africa Naturally Healthy Foods Revenue (USD Million), by Segments (2021-2032)
13.1.1. Middle East and Africa Naturally Healthy Foods Revenue (USD Million) by Type (2021-2032)
13.1.2. Middle East and Africa Naturally Healthy Foods Revenue (USD Million) by Application (2021-2032)
13.1.3. Middle East and Africa Naturally Healthy Foods Revenue (USD Million) by Product (2021-2032)
By Type
Packaged Foods
Beverages
Others
By Application
Supermarkets/Hypermarkets
Independent Small Groceries
Convenience Stores
Chapter 14. Naturally Healthy Foods Company Profiles
14.1 Business Overview
14.2 Product Profiles
14.3 SWOT Profiles
14.5 Recent Developments
14.6 Financial Profile
List of Companies
Arla Foods
Chiquita Brands
Danone SA
Dean Foods
Eden Foods
Fifty 50 Foods
General Mills
Hormel Foods
Mead Johnson Nutrition
Nestle SA
The Coco-Cola
The Hain Celestial
The Kraft Heinz Co.
Unilever Plc
Worthington Foods
15. Methodology and Data Sources
15.1 Customization Offerings
15.2 Subscription Services
15.3 Related Reports
15.4 Publisher Expertise
LIST OF TABLES
Table 1 Market Segmentation Analysis
Table 2 Global Naturally Healthy Foods Market Share of Leading Companies, 2023
Table 3 Product Offerings of Leading Companies
Table 4 Low Growth Scenario Forecasts
Table 5 Reference Case Growth Scenario
Table 6 High Growth Case Scenario
Table 7 Global Naturally Healthy Foods Revenue (USD Million) And CAGR (%) By Type (2021-2032)
Table 8 Global Naturally Healthy Foods Revenue (USD Million) And CAGR (%) By Application (2021-2032)
Table 9 Global Naturally Healthy Foods Revenue (USD Million) And CAGR (%) By Product (2021-2032)
Table 10 Global Naturally Healthy Foods Market Revenue (USD Million) By Regions (2021-2032)
Table 11 Global Naturally Healthy Foods Market Share (%) By Regions (2021-2032)
Table 12 North America Naturally Healthy Foods Revenue (USD Million) By Country (2021-2032)
Table 13 Europe Naturally Healthy Foods Revenue (USD Million) By Country (2021-2032)
Table 14 Asia Pacific Naturally Healthy Foods Revenue (USD Million) By Country (2021-2032)
Table 15 South America Naturally Healthy Foods Revenue (USD Million) By Country (2021-2032)
Table 16 Middle East and Africa Naturally Healthy Foods Revenue (USD Million) By Region (2021-2032)
Table 17 North America Naturally Healthy Foods Revenue (USD Million) By Type (2021-2032)
Table 18 North America Naturally Healthy Foods Revenue (USD Million) By Application (2021-2032)
Table 19 North America Naturally Healthy Foods Revenue (USD Million) By Product (2021-2032)
Table 20 Europe Naturally Healthy Foods Revenue (USD Million) By Type (2021-2032)
Table 21 Europe Naturally Healthy Foods Revenue (USD Million) By Application (2021-2032)
Table 22 Europe Naturally Healthy Foods Revenue (USD Million) By Product (2021-2032)
Table 23 Asia Pacific Naturally Healthy Foods Revenue (USD Million) By Type (2021-2032)
Table 24 Asia Pacific Naturally Healthy Foods Revenue (USD Million) By Application (2021-2032)
Table 25 Asia Pacific Naturally Healthy Foods Revenue (USD Million) By Product (2021-2032)
Table 26 South America Naturally Healthy Foods Revenue (USD Million) By Type (2021-2032)
Table 27 South America Naturally Healthy Foods Revenue (USD Million) By Application (2021-2032)
Table 28 South America Naturally Healthy Foods Revenue (USD Million) By Product (2021-2032)
Table 29 Middle East and Africa Naturally Healthy Foods Revenue (USD Million) By Type (2021-2032)
Table 30 Middle East and Africa Naturally Healthy Foods Revenue (USD Million) By Application (2021-2032)
Table 31 Middle East and Africa Naturally Healthy Foods Revenue (USD Million) By Product (2021-2032)
LIST OF FIGURES
Figure 1. Market Scope
Figure 2. Pricing Forecasts Per Unit, 2023- 2032
Figure 3. Porter’s Five Forces
Figure 4. Global Naturally Healthy Foods Market Revenue (USD Million) By Regions (2021-2032)
Figure 5. Global Naturally Healthy Foods Market Share (%) By Regions (2023)
Figure 6. North America Naturally Healthy Foods Revenue (USD Million) By Country (2021-2032)
Figure 7. United States Naturally Healthy Foods Revenue (USD Million) By Country (2021-2032)
Figure 8. Canada Naturally Healthy Foods Revenue (USD Million) By Country (2021-2032)
Figure 9. Mexico Naturally Healthy Foods Revenue (USD Million) By Country (2021-2032)
Figure 10. Europe Naturally Healthy Foods Revenue (USD Million) By Country (2021-2032)
Figure 11. Germany Naturally Healthy Foods Revenue (USD Million) By Country (2021-2032)
Figure 12. France Naturally Healthy Foods Revenue (USD Million) By Country (2021-2032)
Figure 13. United Kingdom Naturally Healthy Foods Revenue (USD Million) By Country (2021-2032)
Figure 14. Spain Naturally Healthy Foods Revenue (USD Million) By Country (2021-2032)
Figure 15. Italy Naturally Healthy Foods Revenue (USD Million) By Country (2021-2032)
Figure 16. Russia Naturally Healthy Foods Revenue (USD Million) By Country (2021-2032)
Figure 17. Rest of Europe Naturally Healthy Foods Revenue (USD Million) By Country (2021-2032)
Figure 11. Asia Pacific Naturally Healthy Foods Revenue (USD Million) By Country (2021-2032)
Figure 12. China Naturally Healthy Foods Revenue (USD Million) By Country (2021-2032)
Figure 13. Japan Naturally Healthy Foods Revenue (USD Million) By Country (2021-2032)
Figure 14. India Naturally Healthy Foods Revenue (USD Million) By Country (2021-2032)
Figure 15. South Korea Naturally Healthy Foods Revenue (USD Million) By Country (2021-2032)
Figure 16. Australia Naturally Healthy Foods Revenue (USD Million) By Country (2021-2032)
Figure 17. South East Asia Naturally Healthy Foods Revenue (USD Million) By Country (2021-2032)
Figure 18. South America Naturally Healthy Foods Revenue (USD Million) By Country (2021-2032)
Figure 19. Brazil Naturally Healthy Foods Revenue (USD Million) By Country (2021-2032)
Figure 20. Argentina Naturally Healthy Foods Revenue (USD Million) By Country (2021-2032)
Figure 21. Rest of Asia Pacific Naturally Healthy Foods Revenue (USD Million) By Country (2021-2032)
Figure 22. Middle East and Africa Naturally Healthy Foods Revenue (USD Million) By Region (2021-2032)
Figure 23. Saudi Arabia Naturally Healthy Foods Revenue (USD Million) By Region (2021-2032)
Figure 24. The UAE Naturally Healthy Foods Revenue (USD Million) By Region (2021-2032)
Figure 25. Rest of Middle East Naturally Healthy Foods Revenue (USD Million) By Region (2021-2032)
Figure 26. South Africa Naturally Healthy Foods Revenue (USD Million) By Region (2021-2032)
Figure 27. Africa Naturally Healthy Foods Revenue (USD Million) By Region (2021-2032)
Figure 28. North America Naturally Healthy Foods Revenue (USD Million) By Type (2021-2032)
Figure 29. North America Naturally Healthy Foods Revenue (USD Million) By Application (2021-2032)
Figure 30. North America Naturally Healthy Foods Revenue (USD Million) By Product (2021-2032)
Figure 31. Europe Naturally Healthy Foods Revenue (USD Million) By Type (2021-2032)
Figure 32. Europe Naturally Healthy Foods Revenue (USD Million) By Application (2021-2032)
Figure 33. Europe Naturally Healthy Foods Revenue (USD Million) By Product (2021-2032)
Figure 34. Asia Pacific Naturally Healthy Foods Revenue (USD Million) By Type (2021-2032)
Figure 35. Asia Pacific Naturally Healthy Foods Revenue (USD Million) By Application (2021-2032)
Figure 36. Asia Pacific Naturally Healthy Foods Revenue (USD Million) By Product (2021-2032)
Figure 37. South America Naturally Healthy Foods Revenue (USD Million) By Type (2021-2032)
Figure 38. South America Naturally Healthy Foods Revenue (USD Million) By Application (2021-2032)
Figure 39. South America Naturally Healthy Foods Revenue (USD Million) By Product (2021-2032)
Figure 40. Middle East and Africa Naturally Healthy Foods Revenue (USD Million) By Type (2021-2032)
Figure 41. Middle East and Africa Naturally Healthy Foods Revenue (USD Million) By Application (2021-2032)
Figure 42. Middle East and Africa Naturally Healthy Foods Revenue (USD Million) By Product (2021-2032)
By Type
Packaged Foods
Beverages
Others
By Application
Supermarkets/Hypermarkets
Independent Small Groceries
Convenience Stores
Countries Analyzed
North America (US, Canada, Mexico)
Europe (Germany, UK, France, Spain, Italy, Russia, Rest of Europe)
Asia Pacific (China, India, Japan, South Korea, Australia, South East Asia, Rest of Asia)
South America (Brazil, Argentina, Rest of South America)
Middle East and Africa (Saudi Arabia, UAE, Rest of Middle East, South Africa, Egypt, Rest of Africa)
