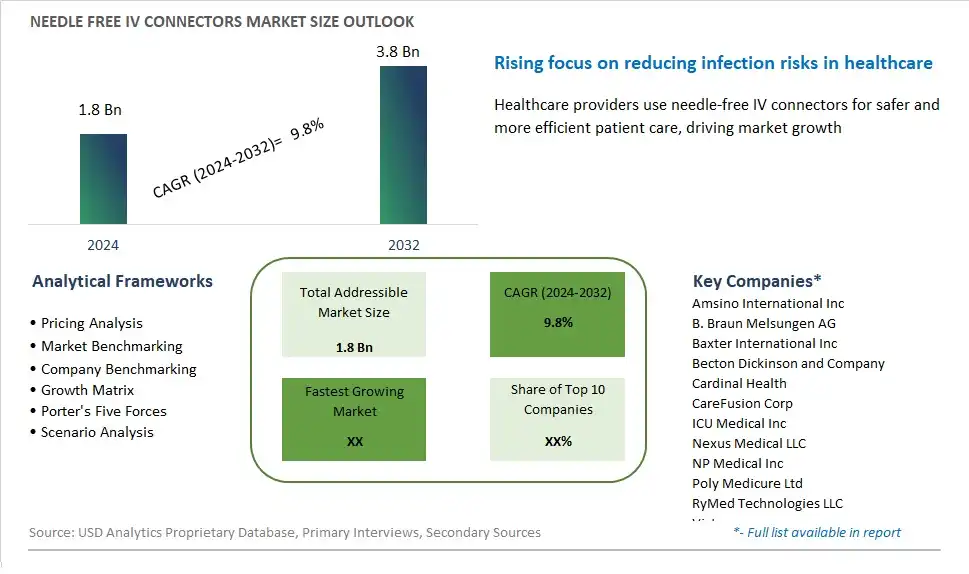
Global Needle Free IV Connectors Market Size is valued at $1.8 Billion in 2024 and is forecast to register a growth rate (CAGR) of 9.8% to reach $3.8 Billion by 2032.
The global Needle Free IV Connectors Market Comprehensive Study analyzes and forecasts the market size across 6 regions and 24 countries for diverse segments -By Type (Positive Fluid Displacement Connectors, Negative Fluid Displacement Connectors, Neutral Fluid Displacement Connectors), By Application (Hospitals, Home healthcare, Others)
An Introduction to Needle Free IV Connectors Market
The Needle-Free IV Connectors Market involves the production and sale of connectors used in intravenous therapy to administer fluids and medications without the use of needles. These connectors reduce the risk of needlestick injuries and infections. The market is driven by increasing prevalence of chronic diseases, rising demand for safe and efficient IV therapy, and growing adoption of needle-free technology in healthcare settings. Additionally, advancements in connector design and materials support market growth.
Needle Free IV Connectors Competitive Landscape
The market report analyses the leading companies in the industry including Amsino International Inc, B. Braun Melsungen AG, Baxter International Inc, Becton Dickinson and Company, Cardinal Health, CareFusion Corp, ICU Medical Inc, Nexus Medical LLC, NP Medical Inc, Poly Medicure Ltd, RyMed Technologies LLC, Victus, Vygon SA, and Others.
Needle Free IV Connectors Market Dynamics
Needle Free IV Connectors Market Trend: Shift Towards Minimally Invasive Medical Procedures
A significant trend in the needle-free IV connectors market is the shift towards minimally invasive medical procedures in healthcare settings. With advancements in medical technology and patient-centered care approaches, there's a growing preference for procedures that minimize patient discomfort, reduce the risk of infection, and improve overall patient experience. Needle-free IV connectors offer a less invasive alternative to traditional needle-based IV access systems, allowing for easier and more comfortable connection and disconnection of IV lines without the need for needle punctures. This trend is driven by a desire to enhance patient safety, reduce healthcare-associated infections, and optimize workflow efficiency in clinical settings.
Market Driver: Focus on Infection Prevention and Control
A key driver for the needle-free IV connectors market is the increasing focus on infection prevention and control in healthcare facilities. With the rise of healthcare-associated infections (HAIs) and antimicrobial resistance, there's a growing awareness of the importance of implementing strategies to reduce the risk of infections transmission within healthcare settings. Needle-free IV connectors offer a closed system design that helps prevent microbial contamination of IV lines and infusion fluids, thereby reducing the risk of bloodstream infections and other complications associated with IV therapy. This driver is reinforced by regulatory guidelines and quality standards aimed at improving patient safety and reducing the economic burden of HAIs on healthcare systems.
Market Opportunity: Expansion into Home Healthcare and Infusion Therapy
An opportunity for the needle-free IV connectors market lies in expansion into home healthcare and infusion therapy settings to meet the growing demand for patient-centered care outside of traditional hospital settings. As the shift towards outpatient care and remote monitoring continues to accelerate, there's a need for safe, reliable, and user-friendly IV access solutions that can be easily administered by patients or caregivers in home settings. Needle-free IV connectors offer a convenient and efficient solution for IV therapy administration, allowing patients to receive intravenous medications, fluids, and nutrition without the need for needle sticks or frequent healthcare provider visits. By expanding into the home healthcare market, companies can tap into new market segments, enhance patient autonomy and satisfaction, and drive growth in the needle-free IV connectors market while improving access to essential medical treatments for patients in need.
Needle Free IV Connectors Market Share Analysis: Positive Fluid Displacement Connectors held the dominant market share in 2024
Within the Needle Free IV Connectors market segmented by type, the Positive Fluid Displacement Connectors emerge as the largest segment, primarily due to their widespread adoption in healthcare settings and their proven efficacy in reducing the risk of bloodstream infections. Positive fluid displacement connectors utilize a mechanism that actively pushes fluid into the IV line upon connection, minimizing the potential for air ingress and bacterial contamination. Healthcare providers favor these connectors for their ability to maintain a closed system, thereby reducing the risk of catheter-related bloodstream infections and other complications. Additionally, positive fluid displacement connectors offer compatibility with various IV administration sets and medication delivery systems, further enhancing their utility and versatility in clinical practice. As a result, the Positive Fluid Displacement Connectors segment commands the largest share of the Needle Free IV Connectors market, reflecting their critical role in ensuring patient safety and improving healthcare outcomes.
Needle Free IV Connectors Market Share Analysis: Home Healthcare market is poised to register the fastest growth rae over the forecast period to 2032
In the Needle Free IV Connectors market segmented by application, the Home Healthcare segment is the fastest-growing, driven by the increasing shift towards home-based medical care and the rising demand for patient-centric solutions that offer convenience, safety, and ease of use. Needle-free IV connectors play a crucial role in home healthcare settings, facilitating the administration of medications, fluids, and nutrition without the need for traditional needle-based connections. As healthcare systems strive to reduce hospital readmissions and healthcare costs while improving patient outcomes, there is a growing emphasis on transitioning certain medical procedures and treatments to the home environment. Needle-free IV connectors offer a safer and more comfortable alternative for patients requiring long-term infusion therapy, chemotherapy, or nutritional support at home, empowering individuals to manage their health conditions more independently. Further, advancements in technology have led to the development of user-friendly and intuitive needle-free IV connector systems specifically designed for home use, further driving the growth of the Home Healthcare segment in the Needle Free IV Connectors market.
Needle Free IV Connectors Market Segmentation
By Type
Positive Fluid Displacement Connectors
Negative Fluid Displacement Connectors
Neutral Fluid Displacement Connectors
By Application
Hospitals
Home healthcare
Others
Countries Analyzed
North America (US, Canada, Mexico)
Europe (Germany, UK, France, Spain, Italy, Russia, Rest of Europe)
Asia Pacific (China, India, Japan, South Korea, Australia, South East Asia, Rest of Asia)
South America (Brazil, Argentina, Rest of South America)
Middle East and Africa (Saudi Arabia, UAE, Rest of Middle East, South Africa, Egypt, Rest of Africa)
Needle Free IV Connectors Companies Profiled in the Study
Amsino International Inc
B. Braun Melsungen AG
Baxter International Inc
Becton Dickinson and Company
Cardinal Health
CareFusion Corp
ICU Medical Inc
Nexus Medical LLC
NP Medical Inc
Poly Medicure Ltd
RyMed Technologies LLC
Victus
Vygon SA
*- List Not Exhaustive
Chapter 1. TABLE OF CONTENTS
Chapter 2. Introduction to Needle Free IV Connectors Market
2.1. Market Overview
2.2. Key Statistics and Report Highlights
2.3. Scope of the Comprehensive Study
2.3.1. Market Definition
2.3.2 Countries and Regions Covered
2.3.3 Research Objective
2.3.4 Units, Currency, and Conversions
2.3.5 Industry Value Chain
2.4. Key Market Segments
2.5. Key Companies
2.6. Study Period
Chapter 3. Strategic Analysis Review
3.1. Needle Free IV Connectors Pricing Analysis and Forecast
3.2. Porter’s Five Forces
3.3. Market Ecosystem
3.4. SWOT Analysis
3.5. Regulatory Scenario
3.3. Effects of Inflation, Russia-Ukraine War, moderating economic growth, and other macroeconomic factors
Chapter 4. Competitive Landscape
4.1. Market Share Analysis
4.1.1. Global Needle Free IV Connectors Market Share by Company, 2023
4.1.2. Product Offerings of Leading Needle Free IV Connectors Companies
4.2. Market Entropy
4.2.1. New Product Launches in the Industry
4.2.2. Mergers, Acquisitions, Joint ventures, and Partnerships
4.3. Key Strategies and Best Practices
Chapter 5. Global Market Projections: Best, Reference, and Low Case Scenarios
5.1. Growth Analysis- Case Scenario Definitions
5.2. Low Growth Case Scenario Forecasts
5.3. Reference Growth Case Scenario Forecasts
5.4. High Growth Case Scenario Forecasts
Chapter 6. Market Dynamics
6.1. Needle Free IV Connectors Market Drivers
6.2. Needle Free IV Connectors Market Challenges
6.6. Needle Free IV Connectors Market Opportunities
6.4. Needle Free IV Connectors Market Trends
Chapter 7. Global Needle Free IV Connectors Market Outlook Trends
7.1. Global Needle Free IV Connectors Revenue (USD Million) and CAGR (%) by Type (2021-2032)
7.2. Global Needle Free IV Connectors Revenue (USD Million) and CAGR (%) by Application (2021-2032)
7.3. Global Needle Free IV Connectors Revenue (USD Million) and CAGR (%) by Product (2021-2032)
By Type
Positive Fluid Displacement Connectors
Negative Fluid Displacement Connectors
Neutral Fluid Displacement Connectors
By Application
Hospitals
Home healthcare
Others
Chapter 8. Global Needle Free IV Connectors Regional Analysis and Outlook
8.1. Global Needle Free IV Connectors Revenue (USD Million) By Regions (2021- 2032)
8.2. North America Needle Free IV Connectors Revenue (USD Million) by Country (2021-2032)
8.2.1. United States Needle Free IV Connectors Regional Analysis and Outlook
8.2.2. Canada Needle Free IV Connectors Regional Analysis and Outlook
8.2.3. Mexico Needle Free IV Connectors Regional Analysis and Outlook
8.3. Europe Needle Free IV Connectors Revenue (USD Million), by Country (2021-2032)
8.3.1. Germany Needle Free IV Connectors Regional Analysis and Outlook
8.3.2. France Needle Free IV Connectors Regional Analysis and Outlook
8.3.3. United Kingdom Needle Free IV Connectors Regional Analysis and Outlook
8.3.4. Spain Needle Free IV Connectors Regional Analysis and Outlook
8.3.5. Italy Needle Free IV Connectors Regional Analysis and Outlook
8.3.6. Russia Needle Free IV Connectors Regional Analysis and Outlook
8.3.7. Rest of Europe Needle Free IV Connectors Regional Analysis and Outlook
8.4. Asia Pacific Needle Free IV Connectors Revenue (USD Million) by Country (2021-2032)
8.4.1. China Needle Free IV Connectors Regional Analysis and Outlook
8.4.2. Japan Needle Free IV Connectors Regional Analysis and Outlook
8.4.3. India Needle Free IV Connectors Regional Analysis and Outlook
8.4.4. South Korea Needle Free IV Connectors Regional Analysis and Outlook
8.4.5. Australia Needle Free IV Connectors Regional Analysis and Outlook
8.4.6. South East Asia Needle Free IV Connectors Regional Analysis and Outlook
8.4.7. Rest of Asia Pacific Needle Free IV Connectors Regional Analysis and Outlook
8.5. South America Needle Free IV Connectors Revenue (USD Million), by Country (2021-2032)
8.5.1. Brazil Needle Free IV Connectors Regional Analysis and Outlook
8.5.2. Argentina Needle Free IV Connectors Regional Analysis and Outlook
8.5.3. Rest of South America Needle Free IV Connectors Regional Analysis and Outlook
8.6. Middle East and Africa Needle Free IV Connectors Revenue (USD Million) by Country (2021-2032)
8.6.1. Middle East Needle Free IV Connectors Regional Analysis and Outlook
8.6.2. Africa Needle Free IV Connectors Regional Analysis and Outlook
Chapter 9. North America Needle Free IV Connectors Analysis and Outlook
9.1. North America Needle Free IV Connectors Revenue (USD Million) by Segments (2021-2032)
9.1.1. North America Needle Free IV Connectors Revenue (USD Million) by Type (2021-2032)
9.1.2. North America Needle Free IV Connectors Revenue (USD Million) by Application (2021-2032)
9.1.3. North America Needle Free IV Connectors Revenue (USD Million) by Product (2021-2032)
By Type
Positive Fluid Displacement Connectors
Negative Fluid Displacement Connectors
Neutral Fluid Displacement Connectors
By Application
Hospitals
Home healthcare
Others
Chapter 10. Europe Needle Free IV Connectors Analysis and Outlook
10.1. Europe Needle Free IV Connectors Revenue (USD Million), by Segments (USD Million) (2021-2032)
10.1.1. Europe Needle Free IV Connectors Revenue (USD Million) by Type (2021-2032)
10.1.2. Europe Needle Free IV Connectors Revenue (USD Million) by Application (2021-2032)
10.1.3. Europe Needle Free IV Connectors Revenue (USD Million) by Product (2021-2032)
By Type
Positive Fluid Displacement Connectors
Negative Fluid Displacement Connectors
Neutral Fluid Displacement Connectors
By Application
Hospitals
Home healthcare
Others
Chapter 11. Asia Pacific Needle Free IV Connectors Analysis and Outlook
11.1. Asia Pacific Needle Free IV Connectors Revenue (USD Million), and Revenue (USD Million) by Segments (2021-2032)
11.1.1. Asia Pacific Needle Free IV Connectors Revenue (USD Million) by Type (2021-2032)
11.1.2. Asia Pacific Needle Free IV Connectors Revenue (USD Million) by Application (2021-2032)
11.1.3. Asia Pacific Needle Free IV Connectors Revenue (USD Million) by Product (2021-2032)
By Type
Positive Fluid Displacement Connectors
Negative Fluid Displacement Connectors
Neutral Fluid Displacement Connectors
By Application
Hospitals
Home healthcare
Others
Chapter 12. South America Needle Free IV Connectors Analysis and Outlook
12.1. South America Needle Free IV Connectors Revenue (USD Million), by Segments (2021-2032)
12.1.1. South America Needle Free IV Connectors Revenue (USD Million) by Type (2021-2032)
12.1.2. South America Needle Free IV Connectors Revenue (USD Million) by Application (2021-2032)
12.1.3. South America Needle Free IV Connectors Revenue (USD Million) by Product (2021-2032)
By Type
Positive Fluid Displacement Connectors
Negative Fluid Displacement Connectors
Neutral Fluid Displacement Connectors
By Application
Hospitals
Home healthcare
Others
Chapter 13. Middle East and Africa Needle Free IV Connectors Analysis and Outlook
13.1. Middle East and Africa Needle Free IV Connectors Revenue (USD Million), by Segments (2021-2032)
13.1.1. Middle East and Africa Needle Free IV Connectors Revenue (USD Million) by Type (2021-2032)
13.1.2. Middle East and Africa Needle Free IV Connectors Revenue (USD Million) by Application (2021-2032)
13.1.3. Middle East and Africa Needle Free IV Connectors Revenue (USD Million) by Product (2021-2032)
By Type
Positive Fluid Displacement Connectors
Negative Fluid Displacement Connectors
Neutral Fluid Displacement Connectors
By Application
Hospitals
Home healthcare
Others
Chapter 14. Needle Free IV Connectors Company Profiles
14.1 Business Overview
14.2 Product Profiles
14.3 SWOT Profiles
14.5 Recent Developments
14.6 Financial Profile
List of Companies
Amsino International Inc
B. Braun Melsungen AG
Baxter International Inc
Becton Dickinson and Company
Cardinal Health
CareFusion Corp
ICU Medical Inc
Nexus Medical LLC
NP Medical Inc
Poly Medicure Ltd
RyMed Technologies LLC
Victus
Vygon SA
15. Methodology and Data Sources
15.1 Customization Offerings
15.2 Subscription Services
15.3 Related Reports
15.4 Publisher Expertise
LIST OF TABLES
Table 1 Market Segmentation Analysis
Table 2 Global Needle Free IV Connectors Market Share of Leading Companies, 2023
Table 3 Product Offerings of Leading Companies
Table 4 Low Growth Scenario Forecasts
Table 5 Reference Case Growth Scenario
Table 6 High Growth Case Scenario
Table 7 Global Needle Free IV Connectors Revenue (USD Million) And CAGR (%) By Type (2021-2032)
Table 8 Global Needle Free IV Connectors Revenue (USD Million) And CAGR (%) By Application (2021-2032)
Table 9 Global Needle Free IV Connectors Revenue (USD Million) And CAGR (%) By Product (2021-2032)
Table 10 Global Needle Free IV Connectors Market Revenue (USD Million) By Regions (2021-2032)
Table 11 Global Needle Free IV Connectors Market Share (%) By Regions (2021-2032)
Table 12 North America Needle Free IV Connectors Revenue (USD Million) By Country (2021-2032)
Table 13 Europe Needle Free IV Connectors Revenue (USD Million) By Country (2021-2032)
Table 14 Asia Pacific Needle Free IV Connectors Revenue (USD Million) By Country (2021-2032)
Table 15 South America Needle Free IV Connectors Revenue (USD Million) By Country (2021-2032)
Table 16 Middle East and Africa Needle Free IV Connectors Revenue (USD Million) By Region (2021-2032)
Table 17 North America Needle Free IV Connectors Revenue (USD Million) By Type (2021-2032)
Table 18 North America Needle Free IV Connectors Revenue (USD Million) By Application (2021-2032)
Table 19 North America Needle Free IV Connectors Revenue (USD Million) By Product (2021-2032)
Table 20 Europe Needle Free IV Connectors Revenue (USD Million) By Type (2021-2032)
Table 21 Europe Needle Free IV Connectors Revenue (USD Million) By Application (2021-2032)
Table 22 Europe Needle Free IV Connectors Revenue (USD Million) By Product (2021-2032)
Table 23 Asia Pacific Needle Free IV Connectors Revenue (USD Million) By Type (2021-2032)
Table 24 Asia Pacific Needle Free IV Connectors Revenue (USD Million) By Application (2021-2032)
Table 25 Asia Pacific Needle Free IV Connectors Revenue (USD Million) By Product (2021-2032)
Table 26 South America Needle Free IV Connectors Revenue (USD Million) By Type (2021-2032)
Table 27 South America Needle Free IV Connectors Revenue (USD Million) By Application (2021-2032)
Table 28 South America Needle Free IV Connectors Revenue (USD Million) By Product (2021-2032)
Table 29 Middle East and Africa Needle Free IV Connectors Revenue (USD Million) By Type (2021-2032)
Table 30 Middle East and Africa Needle Free IV Connectors Revenue (USD Million) By Application (2021-2032)
Table 31 Middle East and Africa Needle Free IV Connectors Revenue (USD Million) By Product (2021-2032)
LIST OF FIGURES
Figure 1. Market Scope
Figure 2. Pricing Forecasts Per Unit, 2023- 2032
Figure 3. Porter’s Five Forces
Figure 4. Global Needle Free IV Connectors Market Revenue (USD Million) By Regions (2021-2032)
Figure 5. Global Needle Free IV Connectors Market Share (%) By Regions (2023)
Figure 6. North America Needle Free IV Connectors Revenue (USD Million) By Country (2021-2032)
Figure 7. United States Needle Free IV Connectors Revenue (USD Million) By Country (2021-2032)
Figure 8. Canada Needle Free IV Connectors Revenue (USD Million) By Country (2021-2032)
Figure 9. Mexico Needle Free IV Connectors Revenue (USD Million) By Country (2021-2032)
Figure 10. Europe Needle Free IV Connectors Revenue (USD Million) By Country (2021-2032)
Figure 11. Germany Needle Free IV Connectors Revenue (USD Million) By Country (2021-2032)
Figure 12. France Needle Free IV Connectors Revenue (USD Million) By Country (2021-2032)
Figure 13. United Kingdom Needle Free IV Connectors Revenue (USD Million) By Country (2021-2032)
Figure 14. Spain Needle Free IV Connectors Revenue (USD Million) By Country (2021-2032)
Figure 15. Italy Needle Free IV Connectors Revenue (USD Million) By Country (2021-2032)
Figure 16. Russia Needle Free IV Connectors Revenue (USD Million) By Country (2021-2032)
Figure 17. Rest of Europe Needle Free IV Connectors Revenue (USD Million) By Country (2021-2032)
Figure 11. Asia Pacific Needle Free IV Connectors Revenue (USD Million) By Country (2021-2032)
Figure 12. China Needle Free IV Connectors Revenue (USD Million) By Country (2021-2032)
Figure 13. Japan Needle Free IV Connectors Revenue (USD Million) By Country (2021-2032)
Figure 14. India Needle Free IV Connectors Revenue (USD Million) By Country (2021-2032)
Figure 15. South Korea Needle Free IV Connectors Revenue (USD Million) By Country (2021-2032)
Figure 16. Australia Needle Free IV Connectors Revenue (USD Million) By Country (2021-2032)
Figure 17. South East Asia Needle Free IV Connectors Revenue (USD Million) By Country (2021-2032)
Figure 18. South America Needle Free IV Connectors Revenue (USD Million) By Country (2021-2032)
Figure 19. Brazil Needle Free IV Connectors Revenue (USD Million) By Country (2021-2032)
Figure 20. Argentina Needle Free IV Connectors Revenue (USD Million) By Country (2021-2032)
Figure 21. Rest of Asia Pacific Needle Free IV Connectors Revenue (USD Million) By Country (2021-2032)
Figure 22. Middle East and Africa Needle Free IV Connectors Revenue (USD Million) By Region (2021-2032)
Figure 23. Saudi Arabia Needle Free IV Connectors Revenue (USD Million) By Region (2021-2032)
Figure 24. The UAE Needle Free IV Connectors Revenue (USD Million) By Region (2021-2032)
Figure 25. Rest of Middle East Needle Free IV Connectors Revenue (USD Million) By Region (2021-2032)
Figure 26. South Africa Needle Free IV Connectors Revenue (USD Million) By Region (2021-2032)
Figure 27. Africa Needle Free IV Connectors Revenue (USD Million) By Region (2021-2032)
Figure 28. North America Needle Free IV Connectors Revenue (USD Million) By Type (2021-2032)
Figure 29. North America Needle Free IV Connectors Revenue (USD Million) By Application (2021-2032)
Figure 30. North America Needle Free IV Connectors Revenue (USD Million) By Product (2021-2032)
Figure 31. Europe Needle Free IV Connectors Revenue (USD Million) By Type (2021-2032)
Figure 32. Europe Needle Free IV Connectors Revenue (USD Million) By Application (2021-2032)
Figure 33. Europe Needle Free IV Connectors Revenue (USD Million) By Product (2021-2032)
Figure 34. Asia Pacific Needle Free IV Connectors Revenue (USD Million) By Type (2021-2032)
Figure 35. Asia Pacific Needle Free IV Connectors Revenue (USD Million) By Application (2021-2032)
Figure 36. Asia Pacific Needle Free IV Connectors Revenue (USD Million) By Product (2021-2032)
Figure 37. South America Needle Free IV Connectors Revenue (USD Million) By Type (2021-2032)
Figure 38. South America Needle Free IV Connectors Revenue (USD Million) By Application (2021-2032)
Figure 39. South America Needle Free IV Connectors Revenue (USD Million) By Product (2021-2032)
Figure 40. Middle East and Africa Needle Free IV Connectors Revenue (USD Million) By Type (2021-2032)
Figure 41. Middle East and Africa Needle Free IV Connectors Revenue (USD Million) By Application (2021-2032)
Figure 42. Middle East and Africa Needle Free IV Connectors Revenue (USD Million) By Product (2021-2032)
By Type
Positive Fluid Displacement Connectors
Negative Fluid Displacement Connectors
Neutral Fluid Displacement Connectors
By Application
Hospitals
Home healthcare
Others
Countries Analyzed
North America (US, Canada, Mexico)
Europe (Germany, UK, France, Spain, Italy, Russia, Rest of Europe)
Asia Pacific (China, India, Japan, South Korea, Australia, South East Asia, Rest of Asia)
South America (Brazil, Argentina, Rest of South America)
Middle East and Africa (Saudi Arabia, UAE, Rest of Middle East, South Africa, Egypt, Rest of Africa)
