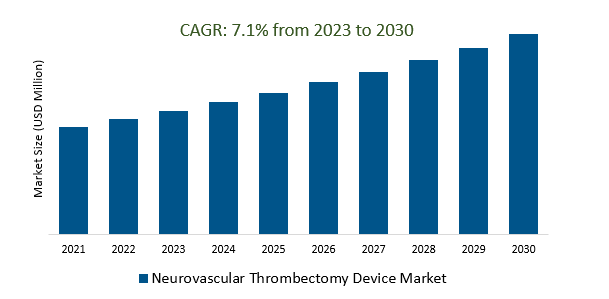
The Global Neurovascular Thrombectomy Device Market Size is estimated to register 7.1% growth over the forecast period from 2023 to 2030.
The market growth is driven by an increase in the global burden of stroke, which continues to rise due to lifestyle factors and an aging population. Stroke plays a significant role as a driver for the neurovascular thrombectomy device market. Leading Companies focusing on market Growth and Size, Technological Advancements, Global Healthcare Trends, Aging Population and Stroke Prevalence, Personalized Medicine and Precision Devices, Research and Clinical Trials, and others to boost market shares in the industry.
Market Overview
The neurovascular Thrombectomy Device Market is expected to sustain its growth, primarily driven by an aging population and the increasing prevalence of neurovascular conditions, including strokes. Advancements in technology will result in more efficient and precise thrombectomy devices, with a growing emphasis on personalized medicine. Emerging markets will offer expansion opportunities, while ongoing research and clinical trials will drive the development of enhanced devices and therapies. Changes in healthcare policies and the utilization of telemedicine will influence the market's dynamics.
Market Dynamics
Market Trends- Emerging technologies in the neurovascular thrombectomy market are enabling faster, more effective, and less invasive stroke treatment.
Emerging technologies in the neurovascular thrombectomy market are revolutionizing stroke treatment, prioritizing speed, effectiveness, and minimally invasive approaches. These innovations span various facets of the field, with advanced imaging techniques facilitating quicker and more precise diagnosis, reducing the critical time between symptom onset and treatment commencement. Robotic-assisted systems and artificial intelligence enhance thrombectomy precision, minimizing harm to healthy brain tissue. Novel materials and designs for thrombectomy devices boost clot retrieval efficacy, ensuring higher success rates. Additionally, telemedicine and remote monitoring solutions extend the reach of stroke specialists, enabling faster consultations and interventions, particularly in underserved regions.
Market Driver- The increasing incidence of stroke is driving demand for neurovascular thrombectomy devices.
The increasing prevalence of strokes is a key factor fueling the demand for neurovascular thrombectomy devices. Given that strokes remain a prominent cause of long-term disability and mortality on a global scale, the imperative for effective and swift intervention has never been greater. Neurovascular thrombectomy devices are instrumental in this context, as they provide minimally invasive solutions for the removal of blood clots from the brain's blood vessels. This, in turn, leads to substantial enhancements in patient outcomes and a reduction in related disabilities. As the aging population and lifestyle-related risk factors continue to contribute to the rising incidence of strokes, the demand for these devices is projected to experience further growth, ensuring that a greater number of patients gain access to timely and life-saving treatments.
Market Opportunity- Favorable regulatory and reimbursement policies are supporting the growth of the neurovascular thrombectomy device market.
Supportive regulatory and reimbursement measures are key drivers in propelling the growth of the neurovascular thrombectomy device market. These measures cultivate an environment conducive to innovation and investment within the industry. By promoting favorable regulations, new devices can efficiently enter the market upon meeting safety and efficacy criteria, expediting the availability of advanced technologies for both healthcare providers and patients. Simultaneously, robust reimbursement policies incentivize healthcare institutions and professionals to embrace these devices, enhancing their accessibility to a broader patient base.
Market Share Analysis- Stent Retrievers the Neurovascular Thrombectomy Device Market will register the fastest growth
The Global Neurovascular Thrombectomy Device Market is analyzed across Stent Retrievers, Aspiration, Vascular Snares, and others. Stent Retrievers is poised to register the fastest growth. Stent retrievers are a crucial component of the Neurovascular Thrombectomy Device Market, facilitating minimally invasive clot removal from brain blood vessels to treat stroke and neurovascular conditions effectively. They swiftly restore blood flow, reducing long-term damage and enhancing patient outcomes. Advancements in this technology play a central role in reshaping stroke treatment and driving market growth.
Market Share Analysis- Hospitals held a significant market share in 2023
The Global Neurovascular Thrombectomy Device Market is analyzed across various Organizations including Hospitals, Ambulatory Surgery Centers, and others. Of these, Hospitals held a significant market share in 2023. Hospitals play a pivotal role in the Neurovascular Thrombectomy Device Market as major users and purchasers of these devices. These healthcare institutions utilize neurovascular thrombectomy devices for the diagnosis and treatment of neurovascular conditions, particularly stroke. Hospitals' demand for advanced devices and their commitment to quality patient care drive the adoption and growth of these devices in the market, making them significant stakeholders in advancing neurovascular care.
Neurovascular Thrombectomy Device Market News
Introducing the Medtronic Neurovascular Co-Lab™ Platform, aimed at expediting advancements in stroke treatment innovation.
BIOTRONIK has unveiled its Oscar® (One Solution: Cross. Adjust. Restore) Multifunctional Peripheral Catheter during LINC 2023 in BUELACH, Switzerland, marking its limited release.
Neurovascular Thrombectomy Device Market Segmentation
By Type
- Stent Retrievers
- Aspiration
- Vascular Snares
- Others
By End-User
- Hospitals
- Ambulatory Surgery Centers
- Others
By Region
- North America (United States, Canada, Mexico)
- Europe (Germany, France, United Kingdom, Spain, Italy, Others)
- Asia Pacific (China, India, Japan, South Korea, Australia, Others)
- Latin America (Brazil, Argentina, Others)
- Middle East and Africa (Saudi Arabia, UAE, Kuwait, Other Middle East, South Africa, Nigeria, Other Africa)
Neurovascular Thrombectomy Device Market Companies
- Cerenovus
- Medtronic
- Acandis GmbH
- Stryker
- Penumbra Inc
- Vesalio LLC
- Johnson and Johnson
- Baylis Medical Company Inc
- MicroVention Inc
- Phenox GmbH
- Balt Group
- NeuroVasc Technologies Inc
- Imperative Care Inc
*List not exhaustive
Neurovascular Thrombectomy Device Market Outlook 2023
1 Market Overview
1.1 Introduction to the Neurovascular Thrombectomy Device Market
1.2 Scope of the Study
1.3 Research Objective
1.3.1 Key Market Scope and Segments
1.3.2 Players Covered
1.3.3 Years Considered
2 Executive Summary
2.1 2023 Neurovascular Thrombectomy Device Industry- Market Statistics
3 Market Dynamics
3.1 Market Drivers
3.2 Market Challenges
3.3 Market Opportunities
3.4 Market Trends
4 Market Factor Analysis
4.1 Porter’s Five Forces
4.2 Market Entropy
4.2.1 Global Neurovascular Thrombectomy Device Market Companies with Area Served
4.2.2 Products Offerings Global Neurovascular Thrombectomy Device Market
5 COVID-19 Impact Analysis and Outlook Scenarios
5.1.1 Covid-19 Impact Analysis
5.1.2 post-COVID-19 Scenario- Low Growth Case
5.1.3 post-COVID-19 Scenario- Reference Growth Case
5.1.4 post-COVID-19 Scenario- Low Growth Case
6 Global Neurovascular Thrombectomy Device Market Trends
6.1 Global Neurovascular Thrombectomy Device Revenue (USD Million) and CAGR (%) by Type (2018-2030)
6.2 Global Neurovascular Thrombectomy Device Revenue (USD Million) and CAGR (%) by Applications (2018-2030)
6.3 Global Neurovascular Thrombectomy Device Revenue (USD Million) and CAGR (%) by regions (2018-2030)
7 Global Neurovascular Thrombectomy Device Market Revenue (USD Million) by Type, and Applications (2018-2022)
7.1 Global Neurovascular Thrombectomy Device Revenue (USD Million) by Type (2018-2022)
7.1.1 Global Neurovascular Thrombectomy Device Revenue (USD Million), Market Share (%) by Type (2018-2022)
7.2 Global Neurovascular Thrombectomy Device Revenue (USD Million) by Applications (2018-2022)
7.2.1 Global Neurovascular Thrombectomy Device Revenue (USD Million), Market Share (%) by Applications (2018-2022)
8 Global Neurovascular Thrombectomy Device Development Regional Status and Outlook
8.1 Global Neurovascular Thrombectomy Device Revenue (USD Million) By Regions (2018-2022)
8.2 North America Neurovascular Thrombectomy Device Revenue (USD Million) by Type, and Application (2018-2022)
8.2.1 North America Neurovascular Thrombectomy Device Revenue (USD Million) by Country (2018-2022)
8.2.2 North America Neurovascular Thrombectomy Device Revenue (USD Million) by Type (2018-2022)
8.2.3 North America Neurovascular Thrombectomy Device Revenue (USD Million) by Applications (2018-2022)
8.3 Europe Neurovascular Thrombectomy Device Revenue (USD Million), by Type, and Applications (USD Million) (2018-2022)
8.3.1 Europe Neurovascular Thrombectomy Device Revenue (USD Million), by Country (2018-2022)
8.3.2 Europe Neurovascular Thrombectomy Device Revenue (USD Million) by Type (2018-2022)
8.3.3 Europe Neurovascular Thrombectomy Device Revenue (USD Million) by Applications (2018-2022)
8.4 Asia Pacific Neurovascular Thrombectomy Device Revenue (USD Million), and Revenue (USD Million) by Type, and Applications (2018-2022)
8.4.1 Asia Pacific Neurovascular Thrombectomy Device Revenue (USD Million) by Country (2018-2022)
8.4.2 Asia Pacific Neurovascular Thrombectomy Device Revenue (USD Million) by Type (2018-2022)
8.4.3 Asia Pacific Neurovascular Thrombectomy Device Revenue (USD Million) by Applications (2018-2022)
8.5 South America Neurovascular Thrombectomy Device Revenue (USD Million), by Type, and Applications (2018-2022)
8.5.1 South America Neurovascular Thrombectomy Device Revenue (USD Million), by Country (2018-2022)
8.5.2 South America Neurovascular Thrombectomy Device Revenue (USD Million) by Type (2018-2022)
8.5.3 South America Neurovascular Thrombectomy Device Revenue (USD Million) by Applications (2018-2022)
8.6 Middle East and Africa Neurovascular Thrombectomy Device Revenue (USD Million), by Type, Technology, Application, Thickness (2018-2022)
8.6.1 Middle East and Africa Neurovascular Thrombectomy Device Revenue (USD Million) by Country (2018-2022)
8.6.2 Middle East and Africa Neurovascular Thrombectomy Device Revenue (USD Million) by Type (2018-2022)
8.6.3 Middle East and Africa Neurovascular Thrombectomy Device Revenue (USD Million) by Applications (2018-2022)
9 Company Profiles
10 Global Neurovascular Thrombectomy Device Market Revenue (USD Million), by Type, and Applications (2023-2030)
10.1 Global Neurovascular Thrombectomy Device Revenue (USD Million) and Market Share (%) by Type (2023-2030)
10.1.1 Global Neurovascular Thrombectomy Device Revenue (USD Million), and Market Share (%) by Type (2023-2030)
10.2 Global Neurovascular Thrombectomy Device Revenue (USD Million) and Market Share (%) by Applications (2023-2030)
10.2.1 Global Neurovascular Thrombectomy Device Revenue (USD Million), and Market Share (%) by Applications (2023-2030)
11 Global Neurovascular Thrombectomy Device Development Regional Status and Outlook Forecast
11.1 Global Neurovascular Thrombectomy Device Revenue (USD Million) By Regions (2023-2030)
11.2 North America Neurovascular Thrombectomy Device Revenue (USD Million) by Type, and Applications (2023-2030)
11.2.1 North America Neurovascular Thrombectomy Device Revenue (USD) Million by Country (2023-2030)
11.2.2 North America Neurovascular Thrombectomy Device Revenue (USD Million), by Type (2023-2030)
11.2.3 North America Neurovascular Thrombectomy Device Revenue (USD Million), Market Share (%) by Applications (2023-2030)
11.3 Europe Neurovascular Thrombectomy Device Revenue (USD Million), by Type, and Applications (2023-2030)
11.3.1 Europe Neurovascular Thrombectomy Device Revenue (USD Million), by Country (2023-2030)
11.3.2 Europe Neurovascular Thrombectomy Device Revenue (USD Million), by Type (2023-2030)
11.3.3 Europe Neurovascular Thrombectomy Device Revenue (USD Million), by Applications (2023-2030)
11.4 Asia Pacific Neurovascular Thrombectomy Device Revenue (USD Million) by Type, and Applications (2023-2030)
11.4.1 Asia Pacific Neurovascular Thrombectomy Device Revenue (USD Million), by Country (2023-2030)
11.4.2 Asia Pacific Neurovascular Thrombectomy Device Revenue (USD Million), by Type (2023-2030)
11.4.3 Asia Pacific Neurovascular Thrombectomy Device Revenue (USD Million), by Applications (2023-2030)
11.5 South America Neurovascular Thrombectomy Device Revenue (USD Million), by Type, and Applications (2023-2030)
11.5.1 South America Neurovascular Thrombectomy Device Revenue (USD Million), by Country (2023-2030)
11.5.2 South America Neurovascular Thrombectomy Device Revenue (USD Million), by Type (2023-2030)
11.5.3 South America Neurovascular Thrombectomy Device Revenue (USD Million), by Applications (2023-2030)
11.6 Middle East and Africa Neurovascular Thrombectomy Device Revenue (USD Million), by Type, and Applications (2023-2030)
11.6.1 Middle East and Africa Neurovascular Thrombectomy Device Revenue (USD Million), by region (2023-2030)
11.6.2 Middle East and Africa Neurovascular Thrombectomy Device Revenue (USD Million), by Type (2023-2030)
11.6.3 Middle East and Africa Neurovascular Thrombectomy Device Revenue (USD Million), by Applications (2023-2030)
12 Methodology and Data Sources
12.1 Methodology/Research Approach
12.1.1 Research Programs/Design
12.1.2 Market Size Estimation
12.1.3 Market Breakdown and Data Triangulation
12.2 Data Sources
12.2.1 Secondary Sources
12.2.2 Primary Sources
12.3 Disclaimer
List of Tables
Table 1 Market Segmentation Analysis
Table 2 Global Neurovascular Thrombectomy Device Market Companies with Areas Served
Table 3 Products Offerings Global Neurovascular Thrombectomy Device Market
Table 4 Low Growth Scenario Forecasts
Table 5 Reference Case Growth Scenario
Table 6 High Growth Case Scenario
Table 7 Global Neurovascular Thrombectomy Device Revenue (USD Million) And CAGR (%) By Type (2018-2030)
Table 8 Global Neurovascular Thrombectomy Device Revenue (USD Million) And CAGR (%) By Applications (2018-2030)
Table 9 Global Neurovascular Thrombectomy Device Revenue (USD Million) And CAGR (%) By Regions (2018-2030)
Table 10 Global Neurovascular Thrombectomy Device Revenue (USD Million) By Type (2018-2022)
Table 11 Global Neurovascular Thrombectomy Device Revenue Market Share (%) By Type (2018-2022)
Table 12 Global Neurovascular Thrombectomy Device Revenue (USD Million) By Applications (2018-2022)
Table 13 Global Neurovascular Thrombectomy Device Revenue Market Share (%) By Applications (2018-2022)
Table 14 Global Neurovascular Thrombectomy Device Market Revenue (USD Million) By Regions (2018-2022)
Table 15 Global Neurovascular Thrombectomy Device Market Share (%) By Regions (2018-2022)
Table 16 North America Neurovascular Thrombectomy Device Revenue (USD Million) By Country (2018-2022)
Table 17 North America Neurovascular Thrombectomy Device Revenue (USD Million) By Type (2018-2022)
Table 18 North America Neurovascular Thrombectomy Device Revenue (USD Million) By Applications (2018-2022)
Table 19 Europe Neurovascular Thrombectomy Device Revenue (USD Million) By Country (2018-2022)
Table 20 Europe Neurovascular Thrombectomy Device Revenue (USD Million) By Type (2018-2022)
Table 21 Europe Neurovascular Thrombectomy Device Revenue (USD Million) By Applications (2018-2022)
Table 22 Asia Pacific Neurovascular Thrombectomy Device Revenue (USD Million) By Country (2018-2022)
Table 23 Asia Pacific Neurovascular Thrombectomy Device Revenue (USD Million) By Type (2018-2022)
Table 24 Asia Pacific Neurovascular Thrombectomy Device Revenue (USD Million) By Applications (2018-2022)
Table 25 South America Neurovascular Thrombectomy Device Revenue (USD Million) By Country (2018-2022)
Table 26 South America Neurovascular Thrombectomy Device Revenue (USD Million) By Type (2018-2022)
Table 27 South America Neurovascular Thrombectomy Device Revenue (USD Million) By Applications (2018-2022)
Table 28 Middle East and Africa Neurovascular Thrombectomy Device Revenue (USD Million) By Region (2018-2022)
Table 29 Middle East and Africa Neurovascular Thrombectomy Device Revenue (USD Million) By Type (2018-2022)
Table 30 Middle East and Africa Neurovascular Thrombectomy Device Revenue (USD Million) By Applications (2018-2022)
Table 31 Financial Analysis
Table 32 Global Neurovascular Thrombectomy Device Revenue (USD Million) By Type (2023-2030)
Table 33 Global Neurovascular Thrombectomy Device Revenue Market Share (%) By Type (2023-2030)
Table 34 Global Neurovascular Thrombectomy Device Revenue (USD Million) By Applications (2023-2030)
Table 35 Global Neurovascular Thrombectomy Device Revenue Market Share (%) By Applications (2023-2030)
Table 36 Global Neurovascular Thrombectomy Device Market Revenue (USD Million), And Revenue (USD Million) By Regions (2023-2030)
Table 37 North America Neurovascular Thrombectomy Device Revenue (USD)By Country (2023-2030)
Table 38 North America Neurovascular Thrombectomy Device Revenue (USD Million) By Type (2023-2030)
Table 39 North America Neurovascular Thrombectomy Device Revenue (USD Million) By Applications (2023-2030)
Table 40 Europe Neurovascular Thrombectomy Device Revenue (USD Million) By Country (2023-2030)
Table 41 Europe Neurovascular Thrombectomy Device Revenue (USD Million) By Type (2023-2030)
Table 42 Europe Neurovascular Thrombectomy Device Revenue (USD Million) By Applications (2023-2030)
Table 43 Asia Pacific Neurovascular Thrombectomy Device Revenue (USD Million) By Country (2023-2030)
Table 44 Asia Pacific Neurovascular Thrombectomy Device Revenue (USD Million) By Type (2023-2030)
Table 45 Asia Pacific Neurovascular Thrombectomy Device Revenue (USD Million) By Applications (2023-2030)
Table 46 South America Neurovascular Thrombectomy Device Revenue (USD Million) By Country (2023-2030)
Table 47 South America Neurovascular Thrombectomy Device Revenue (USD Million) By Type (2023-2030)
Table 48 South America Neurovascular Thrombectomy Device Revenue (USD Million) By Applications (2023-2030)
Table 49 Middle East and Africa Neurovascular Thrombectomy Device Revenue (USD Million) By Region (2023-2030)
Table 50 Middle East and Africa Neurovascular Thrombectomy Device Revenue (USD Million) By Region (2023-2030)
Table 51 Middle East and Africa Neurovascular Thrombectomy Device Revenue (USD Million) By Type (2023-2030)
Table 52 Middle East and Africa Neurovascular Thrombectomy Device Revenue (USD Million) By Applications (2023-2030)
Table 53 Research Programs/Design for This Report
Table 54 Key Data Information from Secondary Sources
Table 55 Key Data Information from Primary Sources
List of Figures
Figure 1 Market Scope
Figure 2 Porter’s Five Forces
Figure 3 Global Neurovascular Thrombectomy Device Revenue (USD Million) By Type (2018-2022)
Figure 4 Global Neurovascular Thrombectomy Device Revenue Market Share (%) By Type (2022)
Figure 5 Global Neurovascular Thrombectomy Device Revenue (USD Million) By Applications (2018-2022)
Figure 6 Global Neurovascular Thrombectomy Device Revenue Market Share (%) By Applications (2022)
Figure 7 Global Neurovascular Thrombectomy Device Market Revenue (USD Million) By Regions (2018-2022)
Figure 8 Global Neurovascular Thrombectomy Device Market Share (%) By Regions (2022)
Figure 9 North America Neurovascular Thrombectomy Device Revenue (USD Million) By Country (2018-2022)
Figure 10 North America Neurovascular Thrombectomy Device Revenue (USD Million) By Type (2018-2022)
Figure 11 North America Neurovascular Thrombectomy Device Revenue (USD Million) By Applications (2018-2022)
Figure 12 Europe Neurovascular Thrombectomy Device Revenue (USD Million) By Country (2018-2022)
Figure 13 Europe Neurovascular Thrombectomy Device Revenue (USD Million) By Type (2018-2022)
Figure 14 Europe Neurovascular Thrombectomy Device Revenue (USD Million) By Applications (2018-2022)
Figure 15 Asia Pacific Neurovascular Thrombectomy Device Revenue (USD Million) By Country (2018-2022)
Figure 16 Asia Pacific Neurovascular Thrombectomy Device Revenue (USD Million) By Type (2018-2022)
Figure 17 Asia Pacific Neurovascular Thrombectomy Device Revenue (USD Million) By Applications (2018-2022)
Figure 18 South America Neurovascular Thrombectomy Device Revenue (USD Million) By Country (2018-2022)
Figure 19 South America Neurovascular Thrombectomy Device Revenue (USD Million) By Type (2018-2022)
Figure 20 South America Neurovascular Thrombectomy Device Revenue (USD Million) By Applications (2018-2022)
Figure 21 Middle East and Africa Neurovascular Thrombectomy Device Revenue (USD Million) By Region (2018-2022)
Figure 22 Middle East and Africa Neurovascular Thrombectomy Device Revenue (USD Million) By Type (2018-2022)
Figure 23 Middle East and Africa Neurovascular Thrombectomy Device Revenue (USD Million) By Applications (2018-2022)
Figure 24 Global Neurovascular Thrombectomy Device Revenue (USD Million) By Type (2023-2030)
Figure 25 Global Neurovascular Thrombectomy Device Revenue Market Share (%) By Type (2030)
Figure 26 Global Neurovascular Thrombectomy Device Revenue (USD Million) By Applications (2023-2030)
Figure 27 Global Neurovascular Thrombectomy Device Revenue Market Share (%) By Applications (2030)
Figure 28 Global Neurovascular Thrombectomy Device Market Revenue (USD Million) By Regions (2023-2030)
Figure 29 North America Neurovascular Thrombectomy Device Revenue (USD Million) By Country (2023-2030)
Figure 30 North America Neurovascular Thrombectomy Device Revenue (USD Million) By Type (2023-2030)
Figure 31 North America Neurovascular Thrombectomy Device Revenue (USD Million) By Applications (2023-2030)
Figure 32 Europe Neurovascular Thrombectomy Device Revenue (USD Million) By Country (2023-2030)
Figure 33 Europe Neurovascular Thrombectomy Device Revenue (USD Million) By Type (2023-2030)
Figure 34 Europe Neurovascular Thrombectomy Device Revenue (USD Million) By Applications (2023-2030)
Figure 35 Asia Pacific Neurovascular Thrombectomy Device Revenue (USD Million) By Country (2023-2030)
Figure 36 Asia Pacific Neurovascular Thrombectomy Device Revenue (USD Million) By Type (2023-2030)
Figure 37 Asia Pacific Neurovascular Thrombectomy Device Revenue (USD Million) By Applications (2023-2030)
Figure 38 South America Neurovascular Thrombectomy Device Revenue (USD Million) By Country (2023-2030)
Figure 39 South America Neurovascular Thrombectomy Device Revenue (USD Million) By Type (2023-2030)
Figure 40 South America Neurovascular Thrombectomy Device Revenue (USD Million) By Applications (2023-2030)
Figure 41 Middle East and Africa Neurovascular Thrombectomy Device Revenue (USD Million) By Region (2023-2030)
Figure 42 Middle East and Africa Neurovascular Thrombectomy Device Revenue (USD Million) By Region (2023-2030)
Figure 43 Middle East and Africa Neurovascular Thrombectomy Device Revenue (USD Million) By Type (2023-2030)
Figure 44 Middle East and Africa Neurovascular Thrombectomy Device Revenue (USD Million) By Applications (2023-2030)
Figure 45 Bottom-Up and Top-Down Approaches for This Report
Figure 46 Data Triangulation
