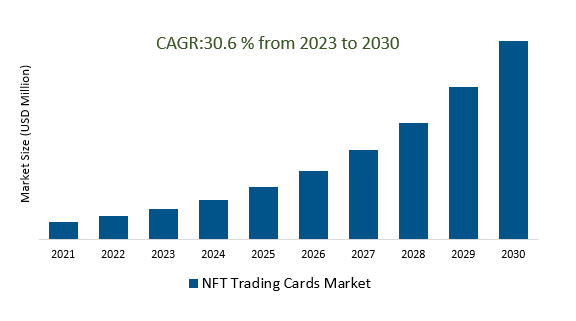
The global NFT Trading Cards Market Size is estimated to register 30.6% growth over the forecast period from 2023 to 2030.
The market growth is driven by Increasing NFT trading cards often have limited edition drops, creating scarcity and driving up prices as collectors compete for rare cards. Leading companies that are focusing on Expansion Across Industries, Integration with Virtual Reality (VR) and Augmented Reality (AR), Blockchain Innovations, Education and Accessibility, Environmental Sustainability, and others to boost market shares in the industry.
Market Overview
The NFT (Non-Fungible Token) trading cards market involves the creation and trading of unique digital collectible cards tokenized on blockchains like Ethereum. These cards represent various digital assets, including art and gaming items, with key characteristics of uniqueness, digital ownership, scarcity, and utility. Major platforms like OpenSea and SuperRare host this market, attracting creators, collectors, and investors. Trends include art and gaming integration, celebrity and brand involvement, and limited edition drops, while concerns revolve around environmental impact, speculation, and scalability issues on Ethereum.
Market Dynamics
Market Trends: The growing popularity of digital art is driving the growth of the NFT trading card market
The growing popularity of digital art has led to a corresponding rise in the NFT trading card market. NFTs, or Non-Fungible Tokens, have allowed artists and collectors to digitize and trade unique cards, bridging the worlds of digital art and collectible cards. The blockchain technology supporting NFTs provides security and transparency for these digital assets, facilitating their authentication and ownership verification. This convergence of digital art and trading cards has fueled the growth of the NFT trading card market, creating new opportunities for both creators and collectors within the ecosystem.
Market Driver: Trading card communities are driving demand for the NFT trading card market.
Trading card communities are a major driving force behind the demand for the NFT trading card market, as collectors and enthusiasts embrace the digitization of traditional cards through NFTs. These communities, known for their strong sense of nostalgia and camaraderie, fuel demand for digital card assets by offering new avenues for buying, selling, and trading, all while benefiting from blockchain technology's authenticity and provenance features. The desire for unique and scarce digital collectibles within these groups contributes significantly to the market's growth, making trading card communities a central factor in its expansion.
Market opportunity: Introduction of NFT Marketplace Growth
The NFT trading cards market has witnessed substantial growth in recent years due to the expansion of NFT marketplaces. These marketplaces serve as platforms for buying, selling, and trading digital collectible cards. The surge in interest in NFTs and their integration into popular blockchain-based marketplaces has attracted both collectors and creators to this niche. The growth is fueled by the ease of access and the ability to reach a global audience, as well as the transparency and security provided by blockchain technology, which ensures the authenticity and provenance of digital trading cards.
Market share Analysis: Digital Game NFT Trading Cards Market will register the fastest growth
The Global NFT Trading Cards Market is analyzed across Digital games, physical Cards, and others. Software is poised to register significant growth. The digital game NFT trading cards market is a rapidly expanding sector within the broader NFT space, where players collect and trade unique in-game assets represented as NFTs. These tokens provide true ownership, scarcity, and sometimes interoperability across games. Marketplaces on blockchain platforms enable buying and selling, while game publishers' involvement varies. However, the market faces challenges like environmental concerns and regulatory uncertainties, and it fosters both a strong online culture and speculation around card values, shaping its dynamic growth and evolving landscape.
Market share Analysis: Investment Purposes held a significant market share in 2023
The Global NFT Trading Cards Market is analyzed across various applications including Collectibles, Investment Purposes, In-Game Use, and others. Of these, Investment purposes held a significant market share in 2023. Investors engage in the NFT trading cards market for potential profit through speculation, diversification, and long-term holds. Some are drawn by passion and collecting, while others see NFTs as a way to support emerging technology or gaming ecosystems. NFTs offer the potential for both artistic and investment value, but the market is speculative and carries risks, requiring careful research and awareness of evolving regulations and market dynamics.
NFT Trading Cards Market Segmentation
By Type
- Digital Game
- Physical Card
By Application
- Collectibles
- Investment Purposes
- In-Game Use
- Others
By Distribution Channel
By End User
By Region
- North America (United States, Canada, Mexico)
- Europe (Germany, France, United Kingdom, Spain, Italy, Others)
- Asia Pacific (China, India, Japan, South Korea, Australia, Others)
- Latin America (Brazil, Argentina, Others)
- Middle East and Africa (Saudi Arabia, UAE, Kuwait, Other Middle East, South Africa, Nigeria, Other Africa)
NFT Trading Cards Market Companies
- Dapper Labs (Canada)
- NBA Top Shot (Canada)
- Candy Digital (United States)
- Curio Cards (India)
- SoRare (France)
- OpenSea (United States)
- Gods Unchained (United States)
- CryptoKitties (Canada)
- Axie Infinity (Vietnam)
- VeeFriends (New York)
*List not exhaustive
NFT Trading Cards Market Outlook 2023
1 Market Overview
1.1 Introduction to the NFT Trading Cards Market
1.2 Scope of the Study
1.3 Research Objective
1.3.1 Key Market Scope and Segments
1.3.2 Players Covered
1.3.3 Years Considered
2 Executive Summary
2.1 2023 NFT Trading Cards Industry- Market Statistics
3 Market Dynamics
3.1 Market Drivers
3.2 Market Challenges
3.3 Market Opportunities
3.4 Market Trends
4 Market Factor Analysis
4.1 Porter’s Five Forces
4.2 Market Entropy
4.2.1 Global NFT Trading Cards Market Companies with Area Served
4.2.2 Products Offerings Global NFT Trading Cards Market
5 COVID-19 Impact Analysis and Outlook Scenarios
5.1.1 Covid-19 Impact Analysis
5.1.2 post-COVID-19 Scenario- Low Growth Case
5.1.3 post-COVID-19 Scenario- Reference Growth Case
5.1.4 post-COVID-19 Scenario- Low Growth Case
6 Global NFT Trading Cards Market Trends
6.1 Global NFT Trading Cards Revenue (USD Million) and CAGR (%) by Type (2018-2030)
6.2 Global NFT Trading Cards Revenue (USD Million) and CAGR (%) by Applications (2018-2030)
6.3 Global NFT Trading Cards Revenue (USD Million) and CAGR (%) by regions (2018-2030)
7 Global NFT Trading Cards Market Revenue (USD Million) by Type, and Applications (2018-2022)
7.1 Global NFT Trading Cards Revenue (USD Million) by Type (2018-2022)
7.1.1 Global NFT Trading Cards Revenue (USD Million), Market Share (%) by Type (2018-2022)
7.2 Global NFT Trading Cards Revenue (USD Million) by Applications (2018-2022)
7.2.1 Global NFT Trading Cards Revenue (USD Million), Market Share (%) by Applications (2018-2022)
8 Global NFT Trading Cards Development Regional Status and Outlook
8.1 Global NFT Trading Cards Revenue (USD Million) By Regions (2018-2022)
8.2 North America NFT Trading Cards Revenue (USD Million) by Type, and Application (2018-2022)
8.2.1 North America NFT Trading Cards Revenue (USD Million) by Country (2018-2022)
8.2.2 North America NFT Trading Cards Revenue (USD Million) by Type (2018-2022)
8.2.3 North America NFT Trading Cards Revenue (USD Million) by Applications (2018-2022)
8.3 Europe NFT Trading Cards Revenue (USD Million), by Type, and Applications (USD Million) (2018-2022)
8.3.1 Europe NFT Trading Cards Revenue (USD Million), by Country (2018-2022)
8.3.2 Europe NFT Trading Cards Revenue (USD Million) by Type (2018-2022)
8.3.3 Europe NFT Trading Cards Revenue (USD Million) by Applications (2018-2022)
8.4 Asia Pacific NFT Trading Cards Revenue (USD Million), and Revenue (USD Million) by Type, and Applications (2018-2022)
8.4.1 Asia Pacific NFT Trading Cards Revenue (USD Million) by Country (2018-2022)
8.4.2 Asia Pacific NFT Trading Cards Revenue (USD Million) by Type (2018-2022)
8.4.3 Asia Pacific NFT Trading Cards Revenue (USD Million) by Applications (2018-2022)
8.5 South America NFT Trading Cards Revenue (USD Million), by Type, and Applications (2018-2022)
8.5.1 South America NFT Trading Cards Revenue (USD Million), by Country (2018-2022)
8.5.2 South America NFT Trading Cards Revenue (USD Million) by Type (2018-2022)
8.5.3 South America NFT Trading Cards Revenue (USD Million) by Applications (2018-2022)
8.6 Middle East and Africa NFT Trading Cards Revenue (USD Million), by Type, Technology, Application, Thickness (2018-2022)
8.6.1 Middle East and Africa NFT Trading Cards Revenue (USD Million) by Country (2018-2022)
8.6.2 Middle East and Africa NFT Trading Cards Revenue (USD Million) by Type (2018-2022)
8.6.3 Middle East and Africa NFT Trading Cards Revenue (USD Million) by Applications (2018-2022)
9 Company Profiles
10 Global NFT Trading Cards Market Revenue (USD Million), by Type, and Applications (2023-2030)
10.1 Global NFT Trading Cards Revenue (USD Million) and Market Share (%) by Type (2023-2030)
10.1.1 Global NFT Trading Cards Revenue (USD Million), and Market Share (%) by Type (2023-2030)
10.2 Global NFT Trading Cards Revenue (USD Million) and Market Share (%) by Applications (2023-2030)
10.2.1 Global NFT Trading Cards Revenue (USD Million), and Market Share (%) by Applications (2023-2030)
11 Global NFT Trading Cards Development Regional Status and Outlook Forecast
11.1 Global NFT Trading Cards Revenue (USD Million) By Regions (2023-2030)
11.2 North America NFT Trading Cards Revenue (USD Million) by Type, and Applications (2023-2030)
11.2.1 North America NFT Trading Cards Revenue (USD) Million by Country (2023-2030)
11.2.2 North America NFT Trading Cards Revenue (USD Million), by Type (2023-2030)
11.2.3 North America NFT Trading Cards Revenue (USD Million), Market Share (%) by Applications (2023-2030)
11.3 Europe NFT Trading Cards Revenue (USD Million), by Type, and Applications (2023-2030)
11.3.1 Europe NFT Trading Cards Revenue (USD Million), by Country (2023-2030)
11.3.2 Europe NFT Trading Cards Revenue (USD Million), by Type (2023-2030)
11.3.3 Europe NFT Trading Cards Revenue (USD Million), by Applications (2023-2030)
11.4 Asia Pacific NFT Trading Cards Revenue (USD Million) by Type, and Applications (2023-2030)
11.4.1 Asia Pacific NFT Trading Cards Revenue (USD Million), by Country (2023-2030)
11.4.2 Asia Pacific NFT Trading Cards Revenue (USD Million), by Type (2023-2030)
11.4.3 Asia Pacific NFT Trading Cards Revenue (USD Million), by Applications (2023-2030)
11.5 South America NFT Trading Cards Revenue (USD Million), by Type, and Applications (2023-2030)
11.5.1 South America NFT Trading Cards Revenue (USD Million), by Country (2023-2030)
11.5.2 South America NFT Trading Cards Revenue (USD Million), by Type (2023-2030)
11.5.3 South America NFT Trading Cards Revenue (USD Million), by Applications (2023-2030)
11.6 Middle East and Africa NFT Trading Cards Revenue (USD Million), by Type, and Applications (2023-2030)
11.6.1 Middle East and Africa NFT Trading Cards Revenue (USD Million), by region (2023-2030)
11.6.2 Middle East and Africa NFT Trading Cards Revenue (USD Million), by Type (2023-2030)
11.6.3 Middle East and Africa NFT Trading Cards Revenue (USD Million), by Applications (2023-2030)
12 Methodology and Data Sources
12.1 Methodology/Research Approach
12.1.1 Research Programs/Design
12.1.2 Market Size Estimation
12.1.3 Market Breakdown and Data Triangulation
12.2 Data Sources
12.2.1 Secondary Sources
12.2.2 Primary Sources
12.3 Disclaimer
List of Tables
Table 1 Market Segmentation Analysis
Table 2 Global NFT Trading Cards Market Companies with Areas Served
Table 3 Products Offerings Global NFT Trading Cards Market
Table 4 Low Growth Scenario Forecasts
Table 5 Reference Case Growth Scenario
Table 6 High Growth Case Scenario
Table 7 Global NFT Trading Cards Revenue (USD Million) And CAGR (%) By Type (2018-2030)
Table 8 Global NFT Trading Cards Revenue (USD Million) And CAGR (%) By Applications (2018-2030)
Table 9 Global NFT Trading Cards Revenue (USD Million) And CAGR (%) By Regions (2018-2030)
Table 10 Global NFT Trading Cards Revenue (USD Million) By Type (2018-2022)
Table 11 Global NFT Trading Cards Revenue Market Share (%) By Type (2018-2022)
Table 12 Global NFT Trading Cards Revenue (USD Million) By Applications (2018-2022)
Table 13 Global NFT Trading Cards Revenue Market Share (%) By Applications (2018-2022)
Table 14 Global NFT Trading Cards Market Revenue (USD Million) By Regions (2018-2022)
Table 15 Global NFT Trading Cards Market Share (%) By Regions (2018-2022)
Table 16 North America NFT Trading Cards Revenue (USD Million) By Country (2018-2022)
Table 17 North America NFT Trading Cards Revenue (USD Million) By Type (2018-2022)
Table 18 North America NFT Trading Cards Revenue (USD Million) By Applications (2018-2022)
Table 19 Europe NFT Trading Cards Revenue (USD Million) By Country (2018-2022)
Table 20 Europe NFT Trading Cards Revenue (USD Million) By Type (2018-2022)
Table 21 Europe NFT Trading Cards Revenue (USD Million) By Applications (2018-2022)
Table 22 Asia Pacific NFT Trading Cards Revenue (USD Million) By Country (2018-2022)
Table 23 Asia Pacific NFT Trading Cards Revenue (USD Million) By Type (2018-2022)
Table 24 Asia Pacific NFT Trading Cards Revenue (USD Million) By Applications (2018-2022)
Table 25 South America NFT Trading Cards Revenue (USD Million) By Country (2018-2022)
Table 26 South America NFT Trading Cards Revenue (USD Million) By Type (2018-2022)
Table 27 South America NFT Trading Cards Revenue (USD Million) By Applications (2018-2022)
Table 28 Middle East and Africa NFT Trading Cards Revenue (USD Million) By Region (2018-2022)
Table 29 Middle East and Africa NFT Trading Cards Revenue (USD Million) By Type (2018-2022)
Table 30 Middle East and Africa NFT Trading Cards Revenue (USD Million) By Applications (2018-2022)
Table 31 Financial Analysis
Table 32 Global NFT Trading Cards Revenue (USD Million) By Type (2023-2030)
Table 33 Global NFT Trading Cards Revenue Market Share (%) By Type (2023-2030)
Table 34 Global NFT Trading Cards Revenue (USD Million) By Applications (2023-2030)
Table 35 Global NFT Trading Cards Revenue Market Share (%) By Applications (2023-2030)
Table 36 Global NFT Trading Cards Market Revenue (USD Million), And Revenue (USD Million) By Regions (2023-2030)
Table 37 North America NFT Trading Cards Revenue (USD)By Country (2023-2030)
Table 38 North America NFT Trading Cards Revenue (USD Million) By Type (2023-2030)
Table 39 North America NFT Trading Cards Revenue (USD Million) By Applications (2023-2030)
Table 40 Europe NFT Trading Cards Revenue (USD Million) By Country (2023-2030)
Table 41 Europe NFT Trading Cards Revenue (USD Million) By Type (2023-2030)
Table 42 Europe NFT Trading Cards Revenue (USD Million) By Applications (2023-2030)
Table 43 Asia Pacific NFT Trading Cards Revenue (USD Million) By Country (2023-2030)
Table 44 Asia Pacific NFT Trading Cards Revenue (USD Million) By Type (2023-2030)
Table 45 Asia Pacific NFT Trading Cards Revenue (USD Million) By Applications (2023-2030)
Table 46 South America NFT Trading Cards Revenue (USD Million) By Country (2023-2030)
Table 47 South America NFT Trading Cards Revenue (USD Million) By Type (2023-2030)
Table 48 South America NFT Trading Cards Revenue (USD Million) By Applications (2023-2030)
Table 49 Middle East and Africa NFT Trading Cards Revenue (USD Million) By Region (2023-2030)
Table 50 Middle East and Africa NFT Trading Cards Revenue (USD Million) By Region (2023-2030)
Table 51 Middle East and Africa NFT Trading Cards Revenue (USD Million) By Type (2023-2030)
Table 52 Middle East and Africa NFT Trading Cards Revenue (USD Million) By Applications (2023-2030)
Table 53 Research Programs/Design for This Report
Table 54 Key Data Information from Secondary Sources
Table 55 Key Data Information from Primary Sources
List of Figures
Figure 1 Market Scope
Figure 2 Porter’s Five Forces
Figure 3 Global NFT Trading Cards Revenue (USD Million) By Type (2018-2022)
Figure 4 Global NFT Trading Cards Revenue Market Share (%) By Type (2022)
Figure 5 Global NFT Trading Cards Revenue (USD Million) By Applications (2018-2022)
Figure 6 Global NFT Trading Cards Revenue Market Share (%) By Applications (2022)
Figure 7 Global NFT Trading Cards Market Revenue (USD Million) By Regions (2018-2022)
Figure 8 Global NFT Trading Cards Market Share (%) By Regions (2022)
Figure 9 North America NFT Trading Cards Revenue (USD Million) By Country (2018-2022)
Figure 10 North America NFT Trading Cards Revenue (USD Million) By Type (2018-2022)
Figure 11 North America NFT Trading Cards Revenue (USD Million) By Applications (2018-2022)
Figure 12 Europe NFT Trading Cards Revenue (USD Million) By Country (2018-2022)
Figure 13 Europe NFT Trading Cards Revenue (USD Million) By Type (2018-2022)
Figure 14 Europe NFT Trading Cards Revenue (USD Million) By Applications (2018-2022)
Figure 15 Asia Pacific NFT Trading Cards Revenue (USD Million) By Country (2018-2022)
Figure 16 Asia Pacific NFT Trading Cards Revenue (USD Million) By Type (2018-2022)
Figure 17 Asia Pacific NFT Trading Cards Revenue (USD Million) By Applications (2018-2022)
Figure 18 South America NFT Trading Cards Revenue (USD Million) By Country (2018-2022)
Figure 19 South America NFT Trading Cards Revenue (USD Million) By Type (2018-2022)
Figure 20 South America NFT Trading Cards Revenue (USD Million) By Applications (2018-2022)
Figure 21 Middle East and Africa NFT Trading Cards Revenue (USD Million) By Region (2018-2022)
Figure 22 Middle East and Africa NFT Trading Cards Revenue (USD Million) By Type (2018-2022)
Figure 23 Middle East and Africa NFT Trading Cards Revenue (USD Million) By Applications (2018-2022)
Figure 24 Global NFT Trading Cards Revenue (USD Million) By Type (2023-2030)
Figure 25 Global NFT Trading Cards Revenue Market Share (%) By Type (2030)
Figure 26 Global NFT Trading Cards Revenue (USD Million) By Applications (2023-2030)
Figure 27 Global NFT Trading Cards Revenue Market Share (%) By Applications (2030)
Figure 28 Global NFT Trading Cards Market Revenue (USD Million) By Regions (2023-2030)
Figure 29 North America NFT Trading Cards Revenue (USD Million) By Country (2023-2030)
Figure 30 North America NFT Trading Cards Revenue (USD Million) By Type (2023-2030)
Figure 31 North America NFT Trading Cards Revenue (USD Million) By Applications (2023-2030)
Figure 32 Europe NFT Trading Cards Revenue (USD Million) By Country (2023-2030)
Figure 33 Europe NFT Trading Cards Revenue (USD Million) By Type (2023-2030)
Figure 34 Europe NFT Trading Cards Revenue (USD Million) By Applications (2023-2030)
Figure 35 Asia Pacific NFT Trading Cards Revenue (USD Million) By Country (2023-2030)
Figure 36 Asia Pacific NFT Trading Cards Revenue (USD Million) By Type (2023-2030)
Figure 37 Asia Pacific NFT Trading Cards Revenue (USD Million) By Applications (2023-2030)
Figure 38 South America NFT Trading Cards Revenue (USD Million) By Country (2023-2030)
Figure 39 South America NFT Trading Cards Revenue (USD Million) By Type (2023-2030)
Figure 40 South America NFT Trading Cards Revenue (USD Million) By Applications (2023-2030)
Figure 41 Middle East and Africa NFT Trading Cards Revenue (USD Million) By Region (2023-2030)
Figure 42 Middle East and Africa NFT Trading Cards Revenue (USD Million) By Region (2023-2030)
Figure 43 Middle East and Africa NFT Trading Cards Revenue (USD Million) By Type (2023-2030)
Figure 44 Middle East and Africa NFT Trading Cards Revenue (USD Million) By Applications (2023-2030)
Figure 45 Bottom-Up and Top-Down Approaches for This Report
Figure 46 Data Triangulation
