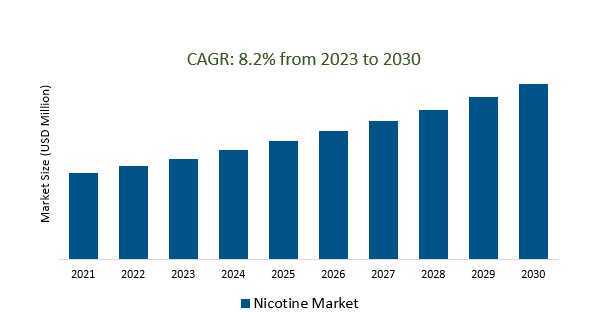
The Global Nicotine Market Size is estimated register 8.2% growth over the forecast period from 2023 to 2030.
Nicotine Market Overview
Growing awareness among consumers about the adverse health effects associated with traditional tobacco smoking is a significant driver. The demand for smoking cessation aids and nicotine replacement therapies (NRTs) are contributing to the rise in demand. Companies are investing in research and development to introduce novel delivery mechanisms that offer convenience, improved user experience, and potentially reduced harm compared to traditional smoking methods. Evolving regulations, such as restrictions on traditional tobacco products and marketing efforts, as well as the imposition of taxation are influencing the market growth. Companies are exploring new regions and markets, targeting diverse consumer demographics with different preferences and needs leading to the rise in market.
Nicotine Market Dynamics
Market Trends- The rise of e-cigarettes and vaping culture is revolutionizing the nicotine market.
With growing health consciousness and concerns about the adverse effects of smoking, individuals are increasingly seeking alternatives that offer a potentially less harmful way to consume nicotine, thereby raising the demand. customization options, including various flavors, nicotine strengths, and device designs are fueling the demand. Further, Companies are investing in research and development to create innovative vaping devices that offer improved functionality, battery life, enhanced flavor profiles, and better nicotine delivery systems. The influence of peer groups, online communities, and celebrity endorsements is also contributing to the normalization and adoption of vaping culture.
Market Driver- Emerging Applications of Nicotine Beyond Smoking Cessation is driving the demand.
Companies, investigating in the use of nicotine in non-traditional formats, such as patches, gums, or lozenges, not solely aimed at smoking cessation but for cognitive enhancement, mood elevation, or increased focus are driving the market growth. Studies and trials are being conducted to investigate the potential of nicotine in addressing specific health conditions, such as neurological disorders like Parkinson's disease, attention-deficit hyperactivity disorder (ADHD), or cognitive decline. Further, novel therapeutic formulations or treatments utilizing nicotine's properties to potentially alleviate symptoms or improve outcomes is fueling the demand.
Market Opportunity- Introduction of Nicotine Replacement Therapy (NRT) products in the Nicotine market.
Individuals seeking alternatives to traditional smoking are gravitating towards NRTs due to their perceived reduced harm compared to combustible tobacco products. Countries are implementing policies supporting smoking cessation efforts, including subsidizing, or providing NRTs through healthcare systems, promoting their accessibility, and incorporating them into structured smoking cessation programs. Modern NRT formulations offering improved delivery systems, extended-release mechanisms, and better absorption rates, providing smokers with alternatives that closely mimic the nicotine delivery experienced through traditional smoking, thereby aiding in managing withdrawal symptoms are the key factors.
Market Share Analysis- Synthetic nicotine will register the fastest growth.
The Global Nicotine Market is analyzed across Tobacco-derived Synthetic Nicotine and others. Synthetic nicotine is poised to register the fastest growth. Synthetic nicotine offers potential regulatory advantages compared to tobacco-derived nicotine. Since it is not derived from tobacco, it will not fall under the same regulatory frameworks or restrictions imposed on tobacco-derived nicotine, providing a perceived advantage in terms of regulatory compliance and market flexibility. The controlled synthesis process yields nicotine of high purity without the impurities or variations that can occur in naturally derived nicotine from tobacco plants. Versatility in nicotine presents opportunities for product innovation, especially in the rapidly growing market of vaping and e-cigarette products, where manufacturers are exploring novel. The perception of synthetic nicotine as potentially less associated with the tobacco industry attracts certain market segments seeking alternative nicotine sources.
Market Share Analysis- Mint flavor held a significant market share in 2023.
The Global Nicotine Market is analyzed across various flavors including Original, Mint, Fruit, Coffee, Cinnamon & Others. Of these, Mint flavor held a significant market share in 2023. Mint's fresh and cooling sensation appeals to a broad range of consumers. Its universally recognized taste, derived from variants like peppermint, spearmint, and menthol, offers a refreshing experience that many find appealing. From subtle menthol undertones to intense peppermint bursts, the versatility of mint flavors allows manufacturers to cater to different taste profiles, enhancing their marketability across diverse consumer segments. Mint flavors are often associated with a perceived sensory experience, offering a cooling effect or a tingling sensation that many users find satisfying. Menthol, a prevalent mint variant, has been a prominent choice due to its perceived smoother taste and cooling properties, leading to the perception of reduced harshness in vaping or smoking experiences.
Nicotine Market Segmentation
By Type
- Tobacco-derived
- Synthetic Nicotine
By Flavor
- Original
- Mint
- Fruit
- Coffee
- Cinnamon
- Others
By Price Range
- Economy (Less than USD 3)
- Mid-range (USD 3 - 5)
- Premium (More than USD 5)
By Distribution Channel
- Online
- Hypermarkets & Supermarkets
- Convenience Stores
- Specialty Stores
- Others
By Region
- North America (United States, Canada, Mexico)
- Europe (Germany, France, United Kingdom, Spain, Italy, Others)
- Asia Pacific (China, India, Japan, South Korea, Australia, Others)
- Latin America (Brazil, Argentina, Others)
- Middle East and Africa (Saudi Arabia, UAE, Kuwait, Other Middle East, South Africa, Nigeria, Other Africa)
Nicotine Market Companies
- BGP Health Care
- Nicobrand
- Contraf Nicotex Tobacco (CNT)
- Alchem
- AmeriNic
- Hubei Heno Bilogical
- Porton Pharma Solutions
- Chemnovatic
- Golden Leaf
- Shanxi Ganghua
- Xi'an Yunzhi Biological
*List not exhaustive
Nicotine Market Outlook 2023
1 Market Overview
1.1 Introduction to the Nicotine Market
1.2 Scope of the Study
1.3 Research Objective
1.3.1 Key Market Scope and Segments
1.3.2 Players Covered
1.3.3 Years Considered
2 Executive Summary
2.1 2023 Nicotine Industry- Market Statistics
3 Market Dynamics
3.1 Market Drivers
3.2 Market Challenges
3.3 Market Opportunities
3.4 Market Trends
4 Market Factor Analysis
4.1 Porter’s Five Forces
4.2 Market Entropy
4.2.1 Global Nicotine Market Companies with Area Served
4.2.2 Products Offerings Global Nicotine Market
5 COVID-19 Impact Analysis and Outlook Scenarios
5.1.1 Covid-19 Impact Analysis
5.1.2 post-COVID-19 Scenario- Low Growth Case
5.1.3 post-COVID-19 Scenario- Reference Growth Case
5.1.4 post-COVID-19 Scenario- Low Growth Case
6 Global Nicotine Market Trends
6.1 Global Nicotine Revenue (USD Million) and CAGR (%) by Type (2018-2030)
6.2 Global Nicotine Revenue (USD Million) and CAGR (%) by Applications (2018-2030)
6.3 Global Nicotine Revenue (USD Million) and CAGR (%) by regions (2018-2030)
7 Global Nicotine Market Revenue (USD Million) by Type, and Applications (2018-2022)
7.1 Global Nicotine Revenue (USD Million) by Type (2018-2022)
7.1.1 Global Nicotine Revenue (USD Million), Market Share (%) by Type (2018-2022)
7.2 Global Nicotine Revenue (USD Million) by Applications (2018-2022)
7.2.1 Global Nicotine Revenue (USD Million), Market Share (%) by Applications (2018-2022)
8 Global Nicotine Development Regional Status and Outlook
8.1 Global Nicotine Revenue (USD Million) By Regions (2018-2022)
8.2 North America Nicotine Revenue (USD Million) by Type, and Application (2018-2022)
8.2.1 North America Nicotine Revenue (USD Million) by Country (2018-2022)
8.2.2 North America Nicotine Revenue (USD Million) by Type (2018-2022)
8.2.3 North America Nicotine Revenue (USD Million) by Applications (2018-2022)
8.3 Europe Nicotine Revenue (USD Million), by Type, and Applications (USD Million) (2018-2022)
8.3.1 Europe Nicotine Revenue (USD Million), by Country (2018-2022)
8.3.2 Europe Nicotine Revenue (USD Million) by Type (2018-2022)
8.3.3 Europe Nicotine Revenue (USD Million) by Applications (2018-2022)
8.4 Asia Pacific Nicotine Revenue (USD Million), and Revenue (USD Million) by Type, and Applications (2018-2022)
8.4.1 Asia Pacific Nicotine Revenue (USD Million) by Country (2018-2022)
8.4.2 Asia Pacific Nicotine Revenue (USD Million) by Type (2018-2022)
8.4.3 Asia Pacific Nicotine Revenue (USD Million) by Applications (2018-2022)
8.5 South America Nicotine Revenue (USD Million), by Type, and Applications (2018-2022)
8.5.1 South America Nicotine Revenue (USD Million), by Country (2018-2022)
8.5.2 South America Nicotine Revenue (USD Million) by Type (2018-2022)
8.5.3 South America Nicotine Revenue (USD Million) by Applications (2018-2022)
8.6 Middle East and Africa Nicotine Revenue (USD Million), by Type, Technology, Application, Thickness (2018-2022)
8.6.1 Middle East and Africa Nicotine Revenue (USD Million) by Country (2018-2022)
8.6.2 Middle East and Africa Nicotine Revenue (USD Million) by Type (2018-2022)
8.6.3 Middle East and Africa Nicotine Revenue (USD Million) by Applications (2018-2022)
9 Company Profiles
10 Global Nicotine Market Revenue (USD Million), by Type, and Applications (2023-2030)
10.1 Global Nicotine Revenue (USD Million) and Market Share (%) by Type (2023-2030)
10.1.1 Global Nicotine Revenue (USD Million), and Market Share (%) by Type (2023-2030)
10.2 Global Nicotine Revenue (USD Million) and Market Share (%) by Applications (2023-2030)
10.2.1 Global Nicotine Revenue (USD Million), and Market Share (%) by Applications (2023-2030)
11 Global Nicotine Development Regional Status and Outlook Forecast
11.1 Global Nicotine Revenue (USD Million) By Regions (2023-2030)
11.2 North America Nicotine Revenue (USD Million) by Type, and Applications (2023-2030)
11.2.1 North America Nicotine Revenue (USD) Million by Country (2023-2030)
11.2.2 North America Nicotine Revenue (USD Million), by Type (2023-2030)
11.2.3 North America Nicotine Revenue (USD Million), Market Share (%) by Applications (2023-2030)
11.3 Europe Nicotine Revenue (USD Million), by Type, and Applications (2023-2030)
11.3.1 Europe Nicotine Revenue (USD Million), by Country (2023-2030)
11.3.2 Europe Nicotine Revenue (USD Million), by Type (2023-2030)
11.3.3 Europe Nicotine Revenue (USD Million), by Applications (2023-2030)
11.4 Asia Pacific Nicotine Revenue (USD Million) by Type, and Applications (2023-2030)
11.4.1 Asia Pacific Nicotine Revenue (USD Million), by Country (2023-2030)
11.4.2 Asia Pacific Nicotine Revenue (USD Million), by Type (2023-2030)
11.4.3 Asia Pacific Nicotine Revenue (USD Million), by Applications (2023-2030)
11.5 South America Nicotine Revenue (USD Million), by Type, and Applications (2023-2030)
11.5.1 South America Nicotine Revenue (USD Million), by Country (2023-2030)
11.5.2 South America Nicotine Revenue (USD Million), by Type (2023-2030)
11.5.3 South America Nicotine Revenue (USD Million), by Applications (2023-2030)
11.6 Middle East and Africa Nicotine Revenue (USD Million), by Type, and Applications (2023-2030)
11.6.1 Middle East and Africa Nicotine Revenue (USD Million), by region (2023-2030)
11.6.2 Middle East and Africa Nicotine Revenue (USD Million), by Type (2023-2030)
11.6.3 Middle East and Africa Nicotine Revenue (USD Million), by Applications (2023-2030)
12 Methodology and Data Sources
12.1 Methodology/Research Approach
12.1.1 Research Programs/Design
12.1.2 Market Size Estimation
12.1.3 Market Breakdown and Data Triangulation
12.2 Data Sources
12.2.1 Secondary Sources
12.2.2 Primary Sources
12.3 Disclaimer
List of Tables
Table 1 Market Segmentation Analysis
Table 2 Global Nicotine Market Companies with Areas Served
Table 3 Products Offerings Global Nicotine Market
Table 4 Low Growth Scenario Forecasts
Table 5 Reference Case Growth Scenario
Table 6 High Growth Case Scenario
Table 7 Global Nicotine Revenue (USD Million) And CAGR (%) By Type (2018-2030)
Table 8 Global Nicotine Revenue (USD Million) And CAGR (%) By Applications (2018-2030)
Table 9 Global Nicotine Revenue (USD Million) And CAGR (%) By Regions (2018-2030)
Table 10 Global Nicotine Revenue (USD Million) By Type (2018-2022)
Table 11 Global Nicotine Revenue Market Share (%) By Type (2018-2022)
Table 12 Global Nicotine Revenue (USD Million) By Applications (2018-2022)
Table 13 Global Nicotine Revenue Market Share (%) By Applications (2018-2022)
Table 14 Global Nicotine Market Revenue (USD Million) By Regions (2018-2022)
Table 15 Global Nicotine Market Share (%) By Regions (2018-2022)
Table 16 North America Nicotine Revenue (USD Million) By Country (2018-2022)
Table 17 North America Nicotine Revenue (USD Million) By Type (2018-2022)
Table 18 North America Nicotine Revenue (USD Million) By Applications (2018-2022)
Table 19 Europe Nicotine Revenue (USD Million) By Country (2018-2022)
Table 20 Europe Nicotine Revenue (USD Million) By Type (2018-2022)
Table 21 Europe Nicotine Revenue (USD Million) By Applications (2018-2022)
Table 22 Asia Pacific Nicotine Revenue (USD Million) By Country (2018-2022)
Table 23 Asia Pacific Nicotine Revenue (USD Million) By Type (2018-2022)
Table 24 Asia Pacific Nicotine Revenue (USD Million) By Applications (2018-2022)
Table 25 South America Nicotine Revenue (USD Million) By Country (2018-2022)
Table 26 South America Nicotine Revenue (USD Million) By Type (2018-2022)
Table 27 South America Nicotine Revenue (USD Million) By Applications (2018-2022)
Table 28 Middle East and Africa Nicotine Revenue (USD Million) By Region (2018-2022)
Table 29 Middle East and Africa Nicotine Revenue (USD Million) By Type (2018-2022)
Table 30 Middle East and Africa Nicotine Revenue (USD Million) By Applications (2018-2022)
Table 31 Financial Analysis
Table 32 Global Nicotine Revenue (USD Million) By Type (2023-2030)
Table 33 Global Nicotine Revenue Market Share (%) By Type (2023-2030)
Table 34 Global Nicotine Revenue (USD Million) By Applications (2023-2030)
Table 35 Global Nicotine Revenue Market Share (%) By Applications (2023-2030)
Table 36 Global Nicotine Market Revenue (USD Million), And Revenue (USD Million) By Regions (2023-2030)
Table 37 North America Nicotine Revenue (USD)By Country (2023-2030)
Table 38 North America Nicotine Revenue (USD Million) By Type (2023-2030)
Table 39 North America Nicotine Revenue (USD Million) By Applications (2023-2030)
Table 40 Europe Nicotine Revenue (USD Million) By Country (2023-2030)
Table 41 Europe Nicotine Revenue (USD Million) By Type (2023-2030)
Table 42 Europe Nicotine Revenue (USD Million) By Applications (2023-2030)
Table 43 Asia Pacific Nicotine Revenue (USD Million) By Country (2023-2030)
Table 44 Asia Pacific Nicotine Revenue (USD Million) By Type (2023-2030)
Table 45 Asia Pacific Nicotine Revenue (USD Million) By Applications (2023-2030)
Table 46 South America Nicotine Revenue (USD Million) By Country (2023-2030)
Table 47 South America Nicotine Revenue (USD Million) By Type (2023-2030)
Table 48 South America Nicotine Revenue (USD Million) By Applications (2023-2030)
Table 49 Middle East and Africa Nicotine Revenue (USD Million) By Region (2023-2030)
Table 50 Middle East and Africa Nicotine Revenue (USD Million) By Region (2023-2030)
Table 51 Middle East and Africa Nicotine Revenue (USD Million) By Type (2023-2030)
Table 52 Middle East and Africa Nicotine Revenue (USD Million) By Applications (2023-2030)
Table 53 Research Programs/Design for This Report
Table 54 Key Data Information from Secondary Sources
Table 55 Key Data Information from Primary Sources
List of Figures
Figure 1 Market Scope
Figure 2 Porter’s Five Forces
Figure 3 Global Nicotine Revenue (USD Million) By Type (2018-2022)
Figure 4 Global Nicotine Revenue Market Share (%) By Type (2022)
Figure 5 Global Nicotine Revenue (USD Million) By Applications (2018-2022)
Figure 6 Global Nicotine Revenue Market Share (%) By Applications (2022)
Figure 7 Global Nicotine Market Revenue (USD Million) By Regions (2018-2022)
Figure 8 Global Nicotine Market Share (%) By Regions (2022)
Figure 9 North America Nicotine Revenue (USD Million) By Country (2018-2022)
Figure 10 North America Nicotine Revenue (USD Million) By Type (2018-2022)
Figure 11 North America Nicotine Revenue (USD Million) By Applications (2018-2022)
Figure 12 Europe Nicotine Revenue (USD Million) By Country (2018-2022)
Figure 13 Europe Nicotine Revenue (USD Million) By Type (2018-2022)
Figure 14 Europe Nicotine Revenue (USD Million) By Applications (2018-2022)
Figure 15 Asia Pacific Nicotine Revenue (USD Million) By Country (2018-2022)
Figure 16 Asia Pacific Nicotine Revenue (USD Million) By Type (2018-2022)
Figure 17 Asia Pacific Nicotine Revenue (USD Million) By Applications (2018-2022)
Figure 18 South America Nicotine Revenue (USD Million) By Country (2018-2022)
Figure 19 South America Nicotine Revenue (USD Million) By Type (2018-2022)
Figure 20 South America Nicotine Revenue (USD Million) By Applications (2018-2022)
Figure 21 Middle East and Africa Nicotine Revenue (USD Million) By Region (2018-2022)
Figure 22 Middle East and Africa Nicotine Revenue (USD Million) By Type (2018-2022)
Figure 23 Middle East and Africa Nicotine Revenue (USD Million) By Applications (2018-2022)
Figure 24 Global Nicotine Revenue (USD Million) By Type (2023-2030)
Figure 25 Global Nicotine Revenue Market Share (%) By Type (2030)
Figure 26 Global Nicotine Revenue (USD Million) By Applications (2023-2030)
Figure 27 Global Nicotine Revenue Market Share (%) By Applications (2030)
Figure 28 Global Nicotine Market Revenue (USD Million) By Regions (2023-2030)
Figure 29 North America Nicotine Revenue (USD Million) By Country (2023-2030)
Figure 30 North America Nicotine Revenue (USD Million) By Type (2023-2030)
Figure 31 North America Nicotine Revenue (USD Million) By Applications (2023-2030)
Figure 32 Europe Nicotine Revenue (USD Million) By Country (2023-2030)
Figure 33 Europe Nicotine Revenue (USD Million) By Type (2023-2030)
Figure 34 Europe Nicotine Revenue (USD Million) By Applications (2023-2030)
Figure 35 Asia Pacific Nicotine Revenue (USD Million) By Country (2023-2030)
Figure 36 Asia Pacific Nicotine Revenue (USD Million) By Type (2023-2030)
Figure 37 Asia Pacific Nicotine Revenue (USD Million) By Applications (2023-2030)
Figure 38 South America Nicotine Revenue (USD Million) By Country (2023-2030)
Figure 39 South America Nicotine Revenue (USD Million) By Type (2023-2030)
Figure 40 South America Nicotine Revenue (USD Million) By Applications (2023-2030)
Figure 41 Middle East and Africa Nicotine Revenue (USD Million) By Region (2023-2030)
Figure 42 Middle East and Africa Nicotine Revenue (USD Million) By Region (2023-2030)
Figure 43 Middle East and Africa Nicotine Revenue (USD Million) By Type (2023-2030)
Figure 44 Middle East and Africa Nicotine Revenue (USD Million) By Applications (2023-2030)
Figure 45 Bottom-Up and Top-Down Approaches for This Report
Figure 46 Data Triangulation
