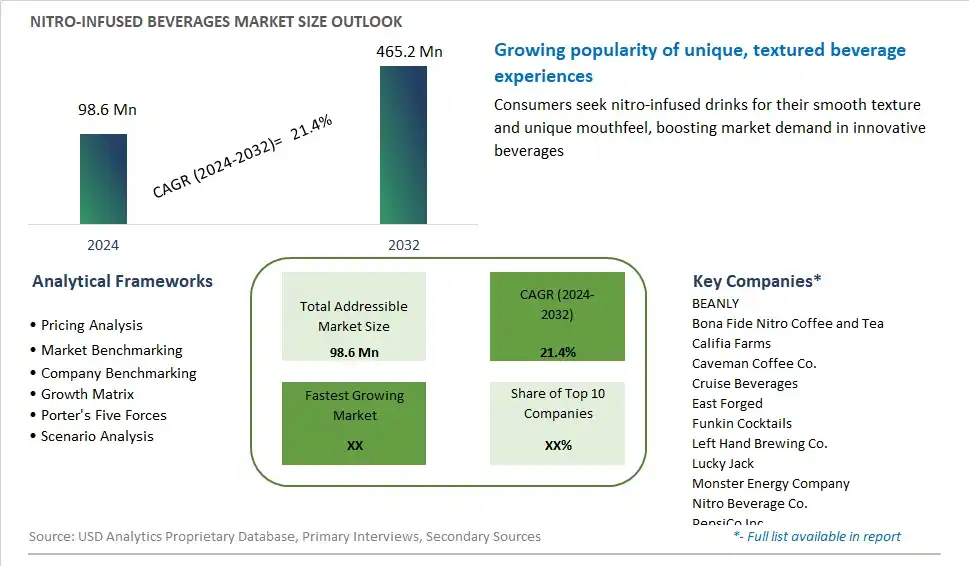
Global Nitro-infused Beverages Market Size is valued at $98.6 Million in 2024 and is forecast to register a growth rate (CAGR) of 21.4% to reach $465.2 Million by 2032.
The global Nitro-infused Beverages Market Comprehensive Study analyzes and forecasts the market size across 6 regions and 24 countries for diverse segments -By Product (Nitro Coffee, Nitro Tea, Nitro Soft Drinks, Others), By Distribution Channel (Supermarket/ Hypermarkets, Convenience Store, Online, Others)
An Introduction to Nitro-infused Beverages Market
The nitro-infused beverages market in 2024 is experiencing dynamic growth, driven by the increasing popularity of unique and innovative drink experiences. Nitro-infusion involves infusing beverages with nitrogen gas, creating a smooth, creamy texture and visually appealing cascading effect. This market includes a variety of products such as nitro coffee, nitro tea, nitro beer, and nitro cocktails, appealing to consumers seeking novel and premium beverage options. The trend towards artisanal and craft beverages has significantly impacted this market, with consumers appreciating the enhanced mouthfeel and distinct taste profiles of nitro-infused drinks. Additionally, the health and wellness trend has led to the development of nitro-infused functional beverages, including those with added vitamins, minerals, and adaptogens. With advancements in packaging and dispensing technologies, nitro-infused beverages are becoming more accessible, ensuring sustained market growth and innovation.
Nitro infused Beverages Competitive Landscape
The market report analyses the leading companies in the industry including BEANLY, Bona Fide Nitro Coffee and Tea, Califia Farms, Caveman Coffee Co., Cruise Beverages, East Forged, Funkin Cocktails, Left Hand Brewing Co., Lucky Jack, Monster Energy Company, Nitro Beverage Co., PepsiCo Inc, Quivr, Rise Brewing Co., Starbucks Corp, and Others.
Nitro infused Beverages Market Dynamics
Market Trend: Popularity of Nitro-Infused Drinks
The most prominent trend in the Nitro-Infused Beverages Market is the rising popularity of nitro-infused drinks. These beverages, known for their smooth and creamy texture, have gained a significant following among consumers seeking unique and premium drinking experiences. Nitro-infused coffee and tea are particularly popular, with consumers appreciating the enhanced flavor profile and visual appeal of the cascading bubbles. This trend is driving innovation in the beverage industry as companies experiment with new flavors and formats
Market Driver: Demand for Premium and Novelty Beverages
The demand for premium and novelty beverages is a major driver of the Nitro-Infused Beverages Market. Consumers are increasingly looking for high-quality, artisanal drinks that offer a distinctive experience. Nitro-infused beverages cater to this demand by providing a luxurious and unique product that stands out in the crowded beverage market. The willingness of consumers to pay a premium for these specialty drinks is driving market growth and encouraging manufacturers to expand their nitro-infused product lines
Market Opportunity: Expansion into New Beverage Categories
A significant opportunity in the Nitro-Infused Beverages Market lies in expanding into new beverage categories. While nitro-infused coffee and tea are well-established, there is potential for innovation in other drink segments such as nitro-infused cocktails, juices, and functional beverages. By exploring these new categories, companies can attract a wider audience and differentiate their products from competitors. This expansion can help tap into new consumer segments and drive market growth
Nitro-infused Beverages Market Share Analysis: By Product (Nitro Coffee, Nitro Tea, Nitro Soft Drinks, Others)
Nitro coffee is projected to be the fastest-growing segment in the Nitro-infused Beverages Market by product to 2032. Nitro coffee has gained popularity due to its smooth, creamy texture and enhanced flavor profile, which appeals to coffee enthusiasts looking for a unique and premium experience. The increasing trend of cold brew coffee consumption and the demand for innovative coffee products drive the growth of the nitro coffee segment. Additionally, the health benefits associated with cold brew coffee, such as lower acidity and higher antioxidant content, contribute to its rising popularity. The expansion of specialty coffee shops and cafes offering nitro coffee further supports the segment's growth.
Nitro-infused Beverages Market Share Analysis: By Distribution Channel (Supermarket/ Hypermarkets, Convenience Store, Online, Others)
The online distribution channel is anticipated to be the fastest-growing segment in the Nitro-infused Beverages Market by distribution channel to 2032. The convenience and accessibility of online shopping, combined with the growing consumer preference for e-commerce, drive the rapid growth of this segment. Online platforms offer a wide variety of nitro-infused beverages, detailed product descriptions, and customer reviews, making it easier for consumers to make informed purchasing decisions. The COVID-19 pandemic has further accelerated the shift towards online shopping, as consumers seek contactless and convenient ways to purchase their favorite beverages. Subscription services and direct-to-consumer models also contribute to the segment's expansion, providing consumers with regular deliveries of their preferred nitro-infused drinks.
Nitro infused Beverages Market Segmentation
By Product
Nitro Coffee
Nitro Tea
Nitro Soft Drinks
Others
By Distribution Channel
Supermarket/ Hypermarkets
Convenience Store
Online
Others
Countries Analyzed
North America (US, Canada, Mexico)
Europe (Germany, UK, France, Spain, Italy, Russia, Rest of Europe)
Asia Pacific (China, India, Japan, South Korea, Australia, South East Asia, Rest of Asia)
South America (Brazil, Argentina, Rest of South America)
Middle East and Africa (Saudi Arabia, UAE, Rest of Middle East, South Africa, Egypt, Rest of Africa)
Nitro infused Beverages Companies Profiled in the Study
BEANLY
Bona Fide Nitro Coffee and Tea
Califia Farms
Caveman Coffee Co.
Cruise Beverages
East Forged
Funkin Cocktails
Left Hand Brewing Co.
Lucky Jack
Monster Energy Company
Nitro Beverage Co.
PepsiCo Inc
Quivr
Rise Brewing Co.
Starbucks Corp
*- List Not Exhaustive
Chapter 1. TABLE OF CONTENTS
Chapter 2. Introduction to Nitro infused Beverages Market
2.1. Market Overview
2.2. Key Statistics and Report Highlights
2.3. Scope of the Comprehensive Study
2.3.1. Market Definition
2.3.2 Countries and Regions Covered
2.3.3 Research Objective
2.3.4 Units, Currency, and Conversions
2.3.5 Industry Value Chain
2.4. Key Market Segments
2.5. Key Companies
2.6. Study Period
Chapter 3. Strategic Analysis Review
3.1. Nitro infused Beverages Pricing Analysis and Forecast
3.2. Porter’s Five Forces
3.3. Market Ecosystem
3.4. SWOT Analysis
3.5. Regulatory Scenario
3.3. Effects of Inflation, Russia-Ukraine War, moderating economic growth, and other macroeconomic factors
Chapter 4. Competitive Landscape
4.1. Market Share Analysis
4.1.1. Global Nitro infused Beverages Market Share by Company, 2023
4.1.2. Product Offerings of Leading Nitro infused Beverages Companies
4.2. Market Entropy
4.2.1. New Product Launches in the Industry
4.2.2. Mergers, Acquisitions, Joint ventures, and Partnerships
4.3. Key Strategies and Best Practices
Chapter 5. Global Market Projections: Best, Reference, and Low Case Scenarios
5.1. Growth Analysis- Case Scenario Definitions
5.2. Low Growth Case Scenario Forecasts
5.3. Reference Growth Case Scenario Forecasts
5.4. High Growth Case Scenario Forecasts
Chapter 6. Market Dynamics
6.1. Nitro infused Beverages Market Drivers
6.2. Nitro infused Beverages Market Challenges
6.6. Nitro infused Beverages Market Opportunities
6.4. Nitro infused Beverages Market Trends
Chapter 7. Global Nitro infused Beverages Market Outlook Trends
7.1. Global Nitro infused Beverages Revenue (USD Million) and CAGR (%) by Type (2021-2032)
7.2. Global Nitro infused Beverages Revenue (USD Million) and CAGR (%) by Application (2021-2032)
7.3. Global Nitro infused Beverages Revenue (USD Million) and CAGR (%) by Product (2021-2032)
By Product
Nitro Coffee
Nitro Tea
Nitro Soft Drinks
Others
By Distribution Channel
Supermarket/ Hypermarkets
Convenience Store
Online
Others
Chapter 8. Global Nitro infused Beverages Regional Analysis and Outlook
8.1. Global Nitro infused Beverages Revenue (USD Million) By Regions (2021- 2032)
8.2. North America Nitro infused Beverages Revenue (USD Million) by Country (2021-2032)
8.2.1. United States Nitro infused Beverages Regional Analysis and Outlook
8.2.2. Canada Nitro infused Beverages Regional Analysis and Outlook
8.2.3. Mexico Nitro infused Beverages Regional Analysis and Outlook
8.3. Europe Nitro infused Beverages Revenue (USD Million), by Country (2021-2032)
8.3.1. Germany Nitro infused Beverages Regional Analysis and Outlook
8.3.2. France Nitro infused Beverages Regional Analysis and Outlook
8.3.3. United Kingdom Nitro infused Beverages Regional Analysis and Outlook
8.3.4. Spain Nitro infused Beverages Regional Analysis and Outlook
8.3.5. Italy Nitro infused Beverages Regional Analysis and Outlook
8.3.6. Russia Nitro infused Beverages Regional Analysis and Outlook
8.3.7. Rest of Europe Nitro infused Beverages Regional Analysis and Outlook
8.4. Asia Pacific Nitro infused Beverages Revenue (USD Million) by Country (2021-2032)
8.4.1. China Nitro infused Beverages Regional Analysis and Outlook
8.4.2. Japan Nitro infused Beverages Regional Analysis and Outlook
8.4.3. India Nitro infused Beverages Regional Analysis and Outlook
8.4.4. South Korea Nitro infused Beverages Regional Analysis and Outlook
8.4.5. Australia Nitro infused Beverages Regional Analysis and Outlook
8.4.6. South East Asia Nitro infused Beverages Regional Analysis and Outlook
8.4.7. Rest of Asia Pacific Nitro infused Beverages Regional Analysis and Outlook
8.5. South America Nitro infused Beverages Revenue (USD Million), by Country (2021-2032)
8.5.1. Brazil Nitro infused Beverages Regional Analysis and Outlook
8.5.2. Argentina Nitro infused Beverages Regional Analysis and Outlook
8.5.3. Rest of South America Nitro infused Beverages Regional Analysis and Outlook
8.6. Middle East and Africa Nitro infused Beverages Revenue (USD Million) by Country (2021-2032)
8.6.1. Middle East Nitro infused Beverages Regional Analysis and Outlook
8.6.2. Africa Nitro infused Beverages Regional Analysis and Outlook
Chapter 9. North America Nitro infused Beverages Analysis and Outlook
9.1. North America Nitro infused Beverages Revenue (USD Million) by Segments (2021-2032)
9.1.1. North America Nitro infused Beverages Revenue (USD Million) by Type (2021-2032)
9.1.2. North America Nitro infused Beverages Revenue (USD Million) by Application (2021-2032)
9.1.3. North America Nitro infused Beverages Revenue (USD Million) by Product (2021-2032)
By Product
Nitro Coffee
Nitro Tea
Nitro Soft Drinks
Others
By Distribution Channel
Supermarket/ Hypermarkets
Convenience Store
Online
Others
Chapter 10. Europe Nitro infused Beverages Analysis and Outlook
10.1. Europe Nitro infused Beverages Revenue (USD Million), by Segments (USD Million) (2021-2032)
10.1.1. Europe Nitro infused Beverages Revenue (USD Million) by Type (2021-2032)
10.1.2. Europe Nitro infused Beverages Revenue (USD Million) by Application (2021-2032)
10.1.3. Europe Nitro infused Beverages Revenue (USD Million) by Product (2021-2032)
By Product
Nitro Coffee
Nitro Tea
Nitro Soft Drinks
Others
By Distribution Channel
Supermarket/ Hypermarkets
Convenience Store
Online
Others
Chapter 11. Asia Pacific Nitro infused Beverages Analysis and Outlook
11.1. Asia Pacific Nitro infused Beverages Revenue (USD Million), and Revenue (USD Million) by Segments (2021-2032)
11.1.1. Asia Pacific Nitro infused Beverages Revenue (USD Million) by Type (2021-2032)
11.1.2. Asia Pacific Nitro infused Beverages Revenue (USD Million) by Application (2021-2032)
11.1.3. Asia Pacific Nitro infused Beverages Revenue (USD Million) by Product (2021-2032)
By Product
Nitro Coffee
Nitro Tea
Nitro Soft Drinks
Others
By Distribution Channel
Supermarket/ Hypermarkets
Convenience Store
Online
Others
Chapter 12. South America Nitro infused Beverages Analysis and Outlook
12.1. South America Nitro infused Beverages Revenue (USD Million), by Segments (2021-2032)
12.1.1. South America Nitro infused Beverages Revenue (USD Million) by Type (2021-2032)
12.1.2. South America Nitro infused Beverages Revenue (USD Million) by Application (2021-2032)
12.1.3. South America Nitro infused Beverages Revenue (USD Million) by Product (2021-2032)
By Product
Nitro Coffee
Nitro Tea
Nitro Soft Drinks
Others
By Distribution Channel
Supermarket/ Hypermarkets
Convenience Store
Online
Others
Chapter 13. Middle East and Africa Nitro infused Beverages Analysis and Outlook
13.1. Middle East and Africa Nitro infused Beverages Revenue (USD Million), by Segments (2021-2032)
13.1.1. Middle East and Africa Nitro infused Beverages Revenue (USD Million) by Type (2021-2032)
13.1.2. Middle East and Africa Nitro infused Beverages Revenue (USD Million) by Application (2021-2032)
13.1.3. Middle East and Africa Nitro infused Beverages Revenue (USD Million) by Product (2021-2032)
By Product
Nitro Coffee
Nitro Tea
Nitro Soft Drinks
Others
By Distribution Channel
Supermarket/ Hypermarkets
Convenience Store
Online
Others
Chapter 14. Nitro infused Beverages Company Profiles
14.1 Business Overview
14.2 Product Profiles
14.3 SWOT Profiles
14.5 Recent Developments
14.6 Financial Profile
List of Companies
BEANLY
Bona Fide Nitro Coffee and Tea
Califia Farms
Caveman Coffee Co.
Cruise Beverages
East Forged
Funkin Cocktails
Left Hand Brewing Co.
Lucky Jack
Monster Energy Company
Nitro Beverage Co.
PepsiCo Inc
Quivr
Rise Brewing Co.
Starbucks Corp
15. Methodology and Data Sources
15.1 Customization Offerings
15.2 Subscription Services
15.3 Related Reports
15.4 Publisher Expertise
LIST OF TABLES
Table 1 Market Segmentation Analysis
Table 2 Global Nitro infused Beverages Market Share of Leading Companies, 2023
Table 3 Product Offerings of Leading Companies
Table 4 Low Growth Scenario Forecasts
Table 5 Reference Case Growth Scenario
Table 6 High Growth Case Scenario
Table 7 Global Nitro infused Beverages Revenue (USD Million) And CAGR (%) By Type (2021-2032)
Table 8 Global Nitro infused Beverages Revenue (USD Million) And CAGR (%) By Application (2021-2032)
Table 9 Global Nitro infused Beverages Revenue (USD Million) And CAGR (%) By Product (2021-2032)
Table 10 Global Nitro infused Beverages Market Revenue (USD Million) By Regions (2021-2032)
Table 11 Global Nitro infused Beverages Market Share (%) By Regions (2021-2032)
Table 12 North America Nitro infused Beverages Revenue (USD Million) By Country (2021-2032)
Table 13 Europe Nitro infused Beverages Revenue (USD Million) By Country (2021-2032)
Table 14 Asia Pacific Nitro infused Beverages Revenue (USD Million) By Country (2021-2032)
Table 15 South America Nitro infused Beverages Revenue (USD Million) By Country (2021-2032)
Table 16 Middle East and Africa Nitro infused Beverages Revenue (USD Million) By Region (2021-2032)
Table 17 North America Nitro infused Beverages Revenue (USD Million) By Type (2021-2032)
Table 18 North America Nitro infused Beverages Revenue (USD Million) By Application (2021-2032)
Table 19 North America Nitro infused Beverages Revenue (USD Million) By Product (2021-2032)
Table 20 Europe Nitro infused Beverages Revenue (USD Million) By Type (2021-2032)
Table 21 Europe Nitro infused Beverages Revenue (USD Million) By Application (2021-2032)
Table 22 Europe Nitro infused Beverages Revenue (USD Million) By Product (2021-2032)
Table 23 Asia Pacific Nitro infused Beverages Revenue (USD Million) By Type (2021-2032)
Table 24 Asia Pacific Nitro infused Beverages Revenue (USD Million) By Application (2021-2032)
Table 25 Asia Pacific Nitro infused Beverages Revenue (USD Million) By Product (2021-2032)
Table 26 South America Nitro infused Beverages Revenue (USD Million) By Type (2021-2032)
Table 27 South America Nitro infused Beverages Revenue (USD Million) By Application (2021-2032)
Table 28 South America Nitro infused Beverages Revenue (USD Million) By Product (2021-2032)
Table 29 Middle East and Africa Nitro infused Beverages Revenue (USD Million) By Type (2021-2032)
Table 30 Middle East and Africa Nitro infused Beverages Revenue (USD Million) By Application (2021-2032)
Table 31 Middle East and Africa Nitro infused Beverages Revenue (USD Million) By Product (2021-2032)
LIST OF FIGURES
Figure 1. Market Scope
Figure 2. Pricing Forecasts Per Unit, 2023- 2032
Figure 3. Porter’s Five Forces
Figure 4. Global Nitro infused Beverages Market Revenue (USD Million) By Regions (2021-2032)
Figure 5. Global Nitro infused Beverages Market Share (%) By Regions (2023)
Figure 6. North America Nitro infused Beverages Revenue (USD Million) By Country (2021-2032)
Figure 7. United States Nitro infused Beverages Revenue (USD Million) By Country (2021-2032)
Figure 8. Canada Nitro infused Beverages Revenue (USD Million) By Country (2021-2032)
Figure 9. Mexico Nitro infused Beverages Revenue (USD Million) By Country (2021-2032)
Figure 10. Europe Nitro infused Beverages Revenue (USD Million) By Country (2021-2032)
Figure 11. Germany Nitro infused Beverages Revenue (USD Million) By Country (2021-2032)
Figure 12. France Nitro infused Beverages Revenue (USD Million) By Country (2021-2032)
Figure 13. United Kingdom Nitro infused Beverages Revenue (USD Million) By Country (2021-2032)
Figure 14. Spain Nitro infused Beverages Revenue (USD Million) By Country (2021-2032)
Figure 15. Italy Nitro infused Beverages Revenue (USD Million) By Country (2021-2032)
Figure 16. Russia Nitro infused Beverages Revenue (USD Million) By Country (2021-2032)
Figure 17. Rest of Europe Nitro infused Beverages Revenue (USD Million) By Country (2021-2032)
Figure 11. Asia Pacific Nitro infused Beverages Revenue (USD Million) By Country (2021-2032)
Figure 12. China Nitro infused Beverages Revenue (USD Million) By Country (2021-2032)
Figure 13. Japan Nitro infused Beverages Revenue (USD Million) By Country (2021-2032)
Figure 14. India Nitro infused Beverages Revenue (USD Million) By Country (2021-2032)
Figure 15. South Korea Nitro infused Beverages Revenue (USD Million) By Country (2021-2032)
Figure 16. Australia Nitro infused Beverages Revenue (USD Million) By Country (2021-2032)
Figure 17. South East Asia Nitro infused Beverages Revenue (USD Million) By Country (2021-2032)
Figure 18. South America Nitro infused Beverages Revenue (USD Million) By Country (2021-2032)
Figure 19. Brazil Nitro infused Beverages Revenue (USD Million) By Country (2021-2032)
Figure 20. Argentina Nitro infused Beverages Revenue (USD Million) By Country (2021-2032)
Figure 21. Rest of Asia Pacific Nitro infused Beverages Revenue (USD Million) By Country (2021-2032)
Figure 22. Middle East and Africa Nitro infused Beverages Revenue (USD Million) By Region (2021-2032)
Figure 23. Saudi Arabia Nitro infused Beverages Revenue (USD Million) By Region (2021-2032)
Figure 24. The UAE Nitro infused Beverages Revenue (USD Million) By Region (2021-2032)
Figure 25. Rest of Middle East Nitro infused Beverages Revenue (USD Million) By Region (2021-2032)
Figure 26. South Africa Nitro infused Beverages Revenue (USD Million) By Region (2021-2032)
Figure 27. Africa Nitro infused Beverages Revenue (USD Million) By Region (2021-2032)
Figure 28. North America Nitro infused Beverages Revenue (USD Million) By Type (2021-2032)
Figure 29. North America Nitro infused Beverages Revenue (USD Million) By Application (2021-2032)
Figure 30. North America Nitro infused Beverages Revenue (USD Million) By Product (2021-2032)
Figure 31. Europe Nitro infused Beverages Revenue (USD Million) By Type (2021-2032)
Figure 32. Europe Nitro infused Beverages Revenue (USD Million) By Application (2021-2032)
Figure 33. Europe Nitro infused Beverages Revenue (USD Million) By Product (2021-2032)
Figure 34. Asia Pacific Nitro infused Beverages Revenue (USD Million) By Type (2021-2032)
Figure 35. Asia Pacific Nitro infused Beverages Revenue (USD Million) By Application (2021-2032)
Figure 36. Asia Pacific Nitro infused Beverages Revenue (USD Million) By Product (2021-2032)
Figure 37. South America Nitro infused Beverages Revenue (USD Million) By Type (2021-2032)
Figure 38. South America Nitro infused Beverages Revenue (USD Million) By Application (2021-2032)
Figure 39. South America Nitro infused Beverages Revenue (USD Million) By Product (2021-2032)
Figure 40. Middle East and Africa Nitro infused Beverages Revenue (USD Million) By Type (2021-2032)
Figure 41. Middle East and Africa Nitro infused Beverages Revenue (USD Million) By Application (2021-2032)
Figure 42. Middle East and Africa Nitro infused Beverages Revenue (USD Million) By Product (2021-2032)
By Product
Nitro Coffee
Nitro Tea
Nitro Soft Drinks
Others
By Distribution Channel
Supermarket/ Hypermarkets
Convenience Store
Online
Others
Countries Analyzed
North America (US, Canada, Mexico)
Europe (Germany, UK, France, Spain, Italy, Russia, Rest of Europe)
Asia Pacific (China, India, Japan, South Korea, Australia, South East Asia, Rest of Asia)
South America (Brazil, Argentina, Rest of South America)
Middle East and Africa (Saudi Arabia, UAE, Rest of Middle East, South Africa, Egypt, Rest of Africa)
