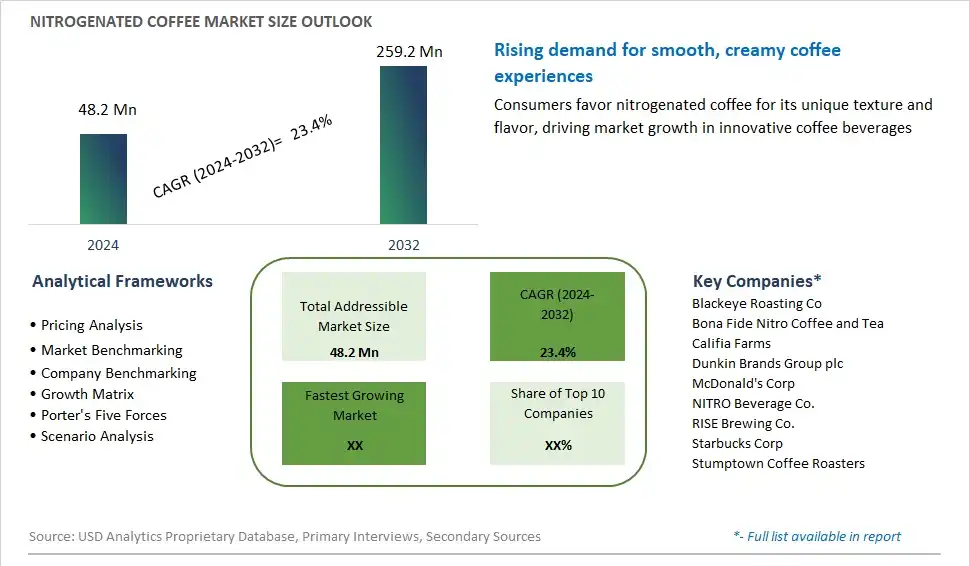
Global Nitrogenated Coffee Market Size is valued at $48.2 Million in 2024 and is forecast to register a growth rate (CAGR) of 23.4% to reach $259.2 Million by 2032.
The global Nitrogenated Coffee Market Comprehensive Study analyzes and forecasts the market size across 6 regions and 24 countries for diverse segments -By Flavor (Vanilla, Cascara, Fruit & Nuts, Others), By Packaging (Mug, Can)
An Introduction to Nitrogenated Coffee Market
In 2024, the nitrogenated coffee market continues to grow, driven by consumer demand for unique and premium coffee experiences. Nitrogenated coffee, also known as nitro coffee, is cold brew coffee infused with nitrogen gas, resulting in a creamy, frothy texture and a smoother taste. This market includes ready-to-drink cans and bottles, as well as on-tap offerings in cafes and restaurants. The appeal of nitrogenated coffee lies in its visual and sensory characteristics, providing a refreshing alternative to traditional hot and iced coffee. The trend towards specialty coffee and craft beverages has significantly boosted the popularity of nitro coffee, with consumers seeking high-quality, artisanal products. Additionally, the health and wellness movement has contributed to the growth of this market, as nitro coffee is often perceived as a lower-calorie, sugar-free option. With ongoing innovation and expanding distribution channels, the nitrogenated coffee market is set for continued growth and widespread adoption.
Nitrogenated Coffee Competitive Landscape
The market report analyses the leading companies in the industry including Blackeye Roasting Co, Bona Fide Nitro Coffee and Tea, Califia Farms, Dunkin Brands Group plc, McDonald's Corp, NITRO Beverage Co., RISE Brewing Co., Starbucks Corp, Stumptown Coffee Roasters, and Others.
Nitrogenated Coffee Market Dynamics
Nitrogenated Coffee Market Trend: Growing Popularity of Nitrogenated Coffee
Nitrogenated coffee, also known as nitro coffee, is experiencing a surge in popularity, driven by the demand for premium and artisanal coffee experiences. This trend is fueled by evolving consumer preferences towards specialty beverages that offer unique sensory experiences. Nitro coffee stands out with its smooth, creamy texture and visually captivating cascading bubbles, creating a multisensory drinking experience that appeals to a wide audience. As coffee culture continues to evolve, driven by a younger demographic seeking novel and Instagram-worthy products, the market for nitrogenated coffee is poised for substantial growth. Specialty cafes, as well as mainstream coffee chains, are increasingly incorporating nitro coffee into their offerings, further accelerating its adoption and cementing its status as a must-have beverage.
Market Driver: Innovation in Coffee Brewing Techniques
The rapid expansion of the nitrogenated coffee market is propelled by ongoing innovations in coffee brewing techniques and equipment. Advanced nitrogen infusion systems enable precise control over the nitrogen-to-coffee ratio, ensuring consistent quality and optimal flavor extraction. Additionally, the development of nitrogen-infused coffee concentrates and ready-to-drink (RTD) formats has expanded consumption occasions beyond traditional coffee shops, catering to on-the-go consumers and office environments. As coffee aficionados seek out new and exciting variations of their favorite brew, the versatility of nitrogenated coffee presents ample opportunities for experimentation with flavor profiles, such as cold brew or flavored infusions. With a growing emphasis on quality and craftsmanship in the coffee industry, the pursuit of excellence in nitrogenated coffee brewing is driving market growth and differentiation.
Market Opportunity: Expansion into New Distribution Channels and Product Formats
One significant opportunity within the nitrogenated coffee market lies in expanding into new distribution channels and product formats. While nitro coffee has gained traction in specialty coffee shops and trendy cafes, there remains untapped potential in mass-market retail channels, convenience stores, and e-commerce platforms. By leveraging innovative packaging solutions and extending the shelf life of nitrogenated coffee products, brands can reach a broader audience and capitalize on the convenience-driven preferences of modern consumers. Moreover, diversifying product formats beyond traditional draft pours, such as canned nitro coffee or nitrogen-infused coffee pods, opens doors to new consumption occasions and market segments. Strategic collaborations with beverage distributors and retailers can facilitate market penetration and provide access to established distribution networks, unlocking growth opportunities in both domestic and international markets. As consumer demand for premium coffee experiences continues to rise, the expansion of nitrogenated coffee into diverse channels and formats represents a promising avenue for market expansion and brand differentiation.
Nitrogenated Coffee Market Share Analysis: Vanilla held the dominant market share in 2024
Vanilla flavor is the largest segment in the Nitrogenated Coffee Market. This dominance is primarily attributed to several factors. Firstly, vanilla's versatile and universally appealing taste complements the rich and smooth texture of nitrogenated coffee, creating a delightful sensory experience for consumers. The sweet and creamy notes of vanilla add depth and complexity to the coffee, appealing to a broad range of taste preferences. Additionally, vanilla is a classic flavor that resonates with consumers across demographics, making it a popular choice for nitrogenated coffee enthusiasts. Further, the familiarity and widespread availability of vanilla-flavored beverages in cafes, coffee shops, and retail outlets contribute to its dominance in the nitrogenated coffee market. As consumers continue to seek indulgent and flavorful coffee experiences, vanilla-flavored nitrogenated coffee maintains its position as the largest segment in the market.
Nitrogenated Coffee Market Share Analysis: Can market is poised to register the fastest growth rae over the forecast period to 2032
Canned nitrogenated coffee is the fastest-growing segment in the Nitrogenated Coffee Market by packaging. This rapid growth is primarily attributed to several factors. Firstly, canned nitrogenated coffee offers convenience and portability, making it an ideal option for consumers seeking on-the-go refreshment. The convenient packaging allows consumers to enjoy nitrogenated coffee anywhere, whether at work, during travel, or outdoor activities. Additionally, canned nitrogenated coffee appeals to younger demographics and urban consumers who value convenience and lifestyle factors. Further, the rise of ready-to-drink beverages and the increasing popularity of nitrogenated coffee as a premium and indulgent beverage option further drive the growth of canned nitrogenated coffee. With its convenience, accessibility, and growing consumer demand, the can packaging segment of the nitrogenated coffee market is poised for sustained growth in the foreseeable future.
Nitrogenated Coffee Market Segmentation
By Flavor
Vanilla
Cascara
Fruit & Nuts
Others
By Packaging
Mug
Can
Countries Analyzed
North America (US, Canada, Mexico)
Europe (Germany, UK, France, Spain, Italy, Russia, Rest of Europe)
Asia Pacific (China, India, Japan, South Korea, Australia, South East Asia, Rest of Asia)
South America (Brazil, Argentina, Rest of South America)
Middle East and Africa (Saudi Arabia, UAE, Rest of Middle East, South Africa, Egypt, Rest of Africa)
Nitrogenated Coffee Companies Profiled in the Study
Blackeye Roasting Co
Bona Fide Nitro Coffee and Tea
Califia Farms
Dunkin Brands Group plc
McDonald's Corp
NITRO Beverage Co.
RISE Brewing Co.
Starbucks Corp
Stumptown Coffee Roasters
*- List Not Exhaustive
Chapter 1. TABLE OF CONTENTS
Chapter 2. Introduction to Nitrogenated Coffee Market
2.1. Market Overview
2.2. Key Statistics and Report Highlights
2.3. Scope of the Comprehensive Study
2.3.1. Market Definition
2.3.2 Countries and Regions Covered
2.3.3 Research Objective
2.3.4 Units, Currency, and Conversions
2.3.5 Industry Value Chain
2.4. Key Market Segments
2.5. Key Companies
2.6. Study Period
Chapter 3. Strategic Analysis Review
3.1. Nitrogenated Coffee Pricing Analysis and Forecast
3.2. Porter’s Five Forces
3.3. Market Ecosystem
3.4. SWOT Analysis
3.5. Regulatory Scenario
3.3. Effects of Inflation, Russia-Ukraine War, moderating economic growth, and other macroeconomic factors
Chapter 4. Competitive Landscape
4.1. Market Share Analysis
4.1.1. Global Nitrogenated Coffee Market Share by Company, 2023
4.1.2. Product Offerings of Leading Nitrogenated Coffee Companies
4.2. Market Entropy
4.2.1. New Product Launches in the Industry
4.2.2. Mergers, Acquisitions, Joint ventures, and Partnerships
4.3. Key Strategies and Best Practices
Chapter 5. Global Market Projections: Best, Reference, and Low Case Scenarios
5.1. Growth Analysis- Case Scenario Definitions
5.2. Low Growth Case Scenario Forecasts
5.3. Reference Growth Case Scenario Forecasts
5.4. High Growth Case Scenario Forecasts
Chapter 6. Market Dynamics
6.1. Nitrogenated Coffee Market Drivers
6.2. Nitrogenated Coffee Market Challenges
6.6. Nitrogenated Coffee Market Opportunities
6.4. Nitrogenated Coffee Market Trends
Chapter 7. Global Nitrogenated Coffee Market Outlook Trends
7.1. Global Nitrogenated Coffee Revenue (USD Million) and CAGR (%) by Type (2021-2032)
7.2. Global Nitrogenated Coffee Revenue (USD Million) and CAGR (%) by Application (2021-2032)
7.3. Global Nitrogenated Coffee Revenue (USD Million) and CAGR (%) by Product (2021-2032)
By Flavor
Vanilla
Cascara
Fruit & Nuts
Others
By Packaging
Mug
Can
Chapter 8. Global Nitrogenated Coffee Regional Analysis and Outlook
8.1. Global Nitrogenated Coffee Revenue (USD Million) By Regions (2021- 2032)
8.2. North America Nitrogenated Coffee Revenue (USD Million) by Country (2021-2032)
8.2.1. United States Nitrogenated Coffee Regional Analysis and Outlook
8.2.2. Canada Nitrogenated Coffee Regional Analysis and Outlook
8.2.3. Mexico Nitrogenated Coffee Regional Analysis and Outlook
8.3. Europe Nitrogenated Coffee Revenue (USD Million), by Country (2021-2032)
8.3.1. Germany Nitrogenated Coffee Regional Analysis and Outlook
8.3.2. France Nitrogenated Coffee Regional Analysis and Outlook
8.3.3. United Kingdom Nitrogenated Coffee Regional Analysis and Outlook
8.3.4. Spain Nitrogenated Coffee Regional Analysis and Outlook
8.3.5. Italy Nitrogenated Coffee Regional Analysis and Outlook
8.3.6. Russia Nitrogenated Coffee Regional Analysis and Outlook
8.3.7. Rest of Europe Nitrogenated Coffee Regional Analysis and Outlook
8.4. Asia Pacific Nitrogenated Coffee Revenue (USD Million) by Country (2021-2032)
8.4.1. China Nitrogenated Coffee Regional Analysis and Outlook
8.4.2. Japan Nitrogenated Coffee Regional Analysis and Outlook
8.4.3. India Nitrogenated Coffee Regional Analysis and Outlook
8.4.4. South Korea Nitrogenated Coffee Regional Analysis and Outlook
8.4.5. Australia Nitrogenated Coffee Regional Analysis and Outlook
8.4.6. South East Asia Nitrogenated Coffee Regional Analysis and Outlook
8.4.7. Rest of Asia Pacific Nitrogenated Coffee Regional Analysis and Outlook
8.5. South America Nitrogenated Coffee Revenue (USD Million), by Country (2021-2032)
8.5.1. Brazil Nitrogenated Coffee Regional Analysis and Outlook
8.5.2. Argentina Nitrogenated Coffee Regional Analysis and Outlook
8.5.3. Rest of South America Nitrogenated Coffee Regional Analysis and Outlook
8.6. Middle East and Africa Nitrogenated Coffee Revenue (USD Million) by Country (2021-2032)
8.6.1. Middle East Nitrogenated Coffee Regional Analysis and Outlook
8.6.2. Africa Nitrogenated Coffee Regional Analysis and Outlook
Chapter 9. North America Nitrogenated Coffee Analysis and Outlook
9.1. North America Nitrogenated Coffee Revenue (USD Million) by Segments (2021-2032)
9.1.1. North America Nitrogenated Coffee Revenue (USD Million) by Type (2021-2032)
9.1.2. North America Nitrogenated Coffee Revenue (USD Million) by Application (2021-2032)
9.1.3. North America Nitrogenated Coffee Revenue (USD Million) by Product (2021-2032)
By Flavor
Vanilla
Cascara
Fruit & Nuts
Others
By Packaging
Mug
Can
Chapter 10. Europe Nitrogenated Coffee Analysis and Outlook
10.1. Europe Nitrogenated Coffee Revenue (USD Million), by Segments (USD Million) (2021-2032)
10.1.1. Europe Nitrogenated Coffee Revenue (USD Million) by Type (2021-2032)
10.1.2. Europe Nitrogenated Coffee Revenue (USD Million) by Application (2021-2032)
10.1.3. Europe Nitrogenated Coffee Revenue (USD Million) by Product (2021-2032)
By Flavor
Vanilla
Cascara
Fruit & Nuts
Others
By Packaging
Mug
Can
Chapter 11. Asia Pacific Nitrogenated Coffee Analysis and Outlook
11.1. Asia Pacific Nitrogenated Coffee Revenue (USD Million), and Revenue (USD Million) by Segments (2021-2032)
11.1.1. Asia Pacific Nitrogenated Coffee Revenue (USD Million) by Type (2021-2032)
11.1.2. Asia Pacific Nitrogenated Coffee Revenue (USD Million) by Application (2021-2032)
11.1.3. Asia Pacific Nitrogenated Coffee Revenue (USD Million) by Product (2021-2032)
By Flavor
Vanilla
Cascara
Fruit & Nuts
Others
By Packaging
Mug
Can
Chapter 12. South America Nitrogenated Coffee Analysis and Outlook
12.1. South America Nitrogenated Coffee Revenue (USD Million), by Segments (2021-2032)
12.1.1. South America Nitrogenated Coffee Revenue (USD Million) by Type (2021-2032)
12.1.2. South America Nitrogenated Coffee Revenue (USD Million) by Application (2021-2032)
12.1.3. South America Nitrogenated Coffee Revenue (USD Million) by Product (2021-2032)
By Flavor
Vanilla
Cascara
Fruit & Nuts
Others
By Packaging
Mug
Can
Chapter 13. Middle East and Africa Nitrogenated Coffee Analysis and Outlook
13.1. Middle East and Africa Nitrogenated Coffee Revenue (USD Million), by Segments (2021-2032)
13.1.1. Middle East and Africa Nitrogenated Coffee Revenue (USD Million) by Type (2021-2032)
13.1.2. Middle East and Africa Nitrogenated Coffee Revenue (USD Million) by Application (2021-2032)
13.1.3. Middle East and Africa Nitrogenated Coffee Revenue (USD Million) by Product (2021-2032)
By Flavor
Vanilla
Cascara
Fruit & Nuts
Others
By Packaging
Mug
Can
Chapter 14. Nitrogenated Coffee Company Profiles
14.1 Business Overview
14.2 Product Profiles
14.3 SWOT Profiles
14.5 Recent Developments
14.6 Financial Profile
List of Companies
Blackeye Roasting Co
Bona Fide Nitro Coffee and Tea
Califia Farms
Dunkin Brands Group plc
McDonald's Corp
NITRO Beverage Co.
RISE Brewing Co.
Starbucks Corp
Stumptown Coffee Roasters
15. Methodology and Data Sources
15.1 Customization Offerings
15.2 Subscription Services
15.3 Related Reports
15.4 Publisher Expertise
LIST OF TABLES
Table 1 Market Segmentation Analysis
Table 2 Global Nitrogenated Coffee Market Share of Leading Companies, 2023
Table 3 Product Offerings of Leading Companies
Table 4 Low Growth Scenario Forecasts
Table 5 Reference Case Growth Scenario
Table 6 High Growth Case Scenario
Table 7 Global Nitrogenated Coffee Revenue (USD Million) And CAGR (%) By Type (2021-2032)
Table 8 Global Nitrogenated Coffee Revenue (USD Million) And CAGR (%) By Application (2021-2032)
Table 9 Global Nitrogenated Coffee Revenue (USD Million) And CAGR (%) By Product (2021-2032)
Table 10 Global Nitrogenated Coffee Market Revenue (USD Million) By Regions (2021-2032)
Table 11 Global Nitrogenated Coffee Market Share (%) By Regions (2021-2032)
Table 12 North America Nitrogenated Coffee Revenue (USD Million) By Country (2021-2032)
Table 13 Europe Nitrogenated Coffee Revenue (USD Million) By Country (2021-2032)
Table 14 Asia Pacific Nitrogenated Coffee Revenue (USD Million) By Country (2021-2032)
Table 15 South America Nitrogenated Coffee Revenue (USD Million) By Country (2021-2032)
Table 16 Middle East and Africa Nitrogenated Coffee Revenue (USD Million) By Region (2021-2032)
Table 17 North America Nitrogenated Coffee Revenue (USD Million) By Type (2021-2032)
Table 18 North America Nitrogenated Coffee Revenue (USD Million) By Application (2021-2032)
Table 19 North America Nitrogenated Coffee Revenue (USD Million) By Product (2021-2032)
Table 20 Europe Nitrogenated Coffee Revenue (USD Million) By Type (2021-2032)
Table 21 Europe Nitrogenated Coffee Revenue (USD Million) By Application (2021-2032)
Table 22 Europe Nitrogenated Coffee Revenue (USD Million) By Product (2021-2032)
Table 23 Asia Pacific Nitrogenated Coffee Revenue (USD Million) By Type (2021-2032)
Table 24 Asia Pacific Nitrogenated Coffee Revenue (USD Million) By Application (2021-2032)
Table 25 Asia Pacific Nitrogenated Coffee Revenue (USD Million) By Product (2021-2032)
Table 26 South America Nitrogenated Coffee Revenue (USD Million) By Type (2021-2032)
Table 27 South America Nitrogenated Coffee Revenue (USD Million) By Application (2021-2032)
Table 28 South America Nitrogenated Coffee Revenue (USD Million) By Product (2021-2032)
Table 29 Middle East and Africa Nitrogenated Coffee Revenue (USD Million) By Type (2021-2032)
Table 30 Middle East and Africa Nitrogenated Coffee Revenue (USD Million) By Application (2021-2032)
Table 31 Middle East and Africa Nitrogenated Coffee Revenue (USD Million) By Product (2021-2032)
LIST OF FIGURES
Figure 1. Market Scope
Figure 2. Pricing Forecasts Per Unit, 2023- 2032
Figure 3. Porter’s Five Forces
Figure 4. Global Nitrogenated Coffee Market Revenue (USD Million) By Regions (2021-2032)
Figure 5. Global Nitrogenated Coffee Market Share (%) By Regions (2023)
Figure 6. North America Nitrogenated Coffee Revenue (USD Million) By Country (2021-2032)
Figure 7. United States Nitrogenated Coffee Revenue (USD Million) By Country (2021-2032)
Figure 8. Canada Nitrogenated Coffee Revenue (USD Million) By Country (2021-2032)
Figure 9. Mexico Nitrogenated Coffee Revenue (USD Million) By Country (2021-2032)
Figure 10. Europe Nitrogenated Coffee Revenue (USD Million) By Country (2021-2032)
Figure 11. Germany Nitrogenated Coffee Revenue (USD Million) By Country (2021-2032)
Figure 12. France Nitrogenated Coffee Revenue (USD Million) By Country (2021-2032)
Figure 13. United Kingdom Nitrogenated Coffee Revenue (USD Million) By Country (2021-2032)
Figure 14. Spain Nitrogenated Coffee Revenue (USD Million) By Country (2021-2032)
Figure 15. Italy Nitrogenated Coffee Revenue (USD Million) By Country (2021-2032)
Figure 16. Russia Nitrogenated Coffee Revenue (USD Million) By Country (2021-2032)
Figure 17. Rest of Europe Nitrogenated Coffee Revenue (USD Million) By Country (2021-2032)
Figure 11. Asia Pacific Nitrogenated Coffee Revenue (USD Million) By Country (2021-2032)
Figure 12. China Nitrogenated Coffee Revenue (USD Million) By Country (2021-2032)
Figure 13. Japan Nitrogenated Coffee Revenue (USD Million) By Country (2021-2032)
Figure 14. India Nitrogenated Coffee Revenue (USD Million) By Country (2021-2032)
Figure 15. South Korea Nitrogenated Coffee Revenue (USD Million) By Country (2021-2032)
Figure 16. Australia Nitrogenated Coffee Revenue (USD Million) By Country (2021-2032)
Figure 17. South East Asia Nitrogenated Coffee Revenue (USD Million) By Country (2021-2032)
Figure 18. South America Nitrogenated Coffee Revenue (USD Million) By Country (2021-2032)
Figure 19. Brazil Nitrogenated Coffee Revenue (USD Million) By Country (2021-2032)
Figure 20. Argentina Nitrogenated Coffee Revenue (USD Million) By Country (2021-2032)
Figure 21. Rest of Asia Pacific Nitrogenated Coffee Revenue (USD Million) By Country (2021-2032)
Figure 22. Middle East and Africa Nitrogenated Coffee Revenue (USD Million) By Region (2021-2032)
Figure 23. Saudi Arabia Nitrogenated Coffee Revenue (USD Million) By Region (2021-2032)
Figure 24. The UAE Nitrogenated Coffee Revenue (USD Million) By Region (2021-2032)
Figure 25. Rest of Middle East Nitrogenated Coffee Revenue (USD Million) By Region (2021-2032)
Figure 26. South Africa Nitrogenated Coffee Revenue (USD Million) By Region (2021-2032)
Figure 27. Africa Nitrogenated Coffee Revenue (USD Million) By Region (2021-2032)
Figure 28. North America Nitrogenated Coffee Revenue (USD Million) By Type (2021-2032)
Figure 29. North America Nitrogenated Coffee Revenue (USD Million) By Application (2021-2032)
Figure 30. North America Nitrogenated Coffee Revenue (USD Million) By Product (2021-2032)
Figure 31. Europe Nitrogenated Coffee Revenue (USD Million) By Type (2021-2032)
Figure 32. Europe Nitrogenated Coffee Revenue (USD Million) By Application (2021-2032)
Figure 33. Europe Nitrogenated Coffee Revenue (USD Million) By Product (2021-2032)
Figure 34. Asia Pacific Nitrogenated Coffee Revenue (USD Million) By Type (2021-2032)
Figure 35. Asia Pacific Nitrogenated Coffee Revenue (USD Million) By Application (2021-2032)
Figure 36. Asia Pacific Nitrogenated Coffee Revenue (USD Million) By Product (2021-2032)
Figure 37. South America Nitrogenated Coffee Revenue (USD Million) By Type (2021-2032)
Figure 38. South America Nitrogenated Coffee Revenue (USD Million) By Application (2021-2032)
Figure 39. South America Nitrogenated Coffee Revenue (USD Million) By Product (2021-2032)
Figure 40. Middle East and Africa Nitrogenated Coffee Revenue (USD Million) By Type (2021-2032)
Figure 41. Middle East and Africa Nitrogenated Coffee Revenue (USD Million) By Application (2021-2032)
Figure 42. Middle East and Africa Nitrogenated Coffee Revenue (USD Million) By Product (2021-2032)
By Flavor
Vanilla
Cascara
Fruit & Nuts
Others
By Packaging
Mug
Can
Countries Analyzed
North America (US, Canada, Mexico)
Europe (Germany, UK, France, Spain, Italy, Russia, Rest of Europe)
Asia Pacific (China, India, Japan, South Korea, Australia, South East Asia, Rest of Asia)
South America (Brazil, Argentina, Rest of South America)
Middle East and Africa (Saudi Arabia, UAE, Rest of Middle East, South Africa, Egypt, Rest of Africa)
