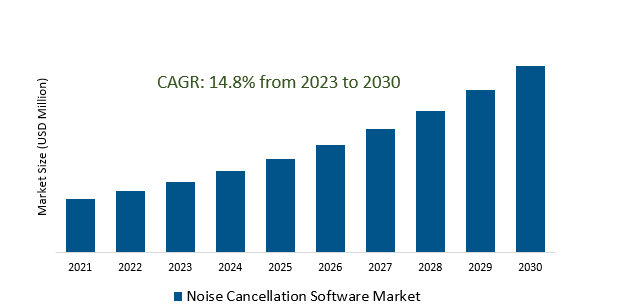
The Noise Cancellation Software Market Size is estimated to register 14.8% growth over the forecast period from 2023 to 2030.
Noise Cancellation Software Market Overview
The rising consumer demand for superior audio experiences, especially in communication devices, headphones, and earphones, propels the need for noise cancellation software to improve sound quality by reducing ambient noise are the prime factors. Noise cancellation features are being integrated into a wide range of consumer electronics beyond audio devices, including smartphones, laptops, smart home devices, and automotive systems, enhancing user experience and productivity. Increased emphasis on noise cancellation software for teleconferencing and remote work solutions due to the rising trend of remote work setups, requiring improved audio quality and noise suppression for clear communication is propelling the market growth. Further, the popularity of TWS earbuds with noise-cancellation capabilities fuels the demand for noise-cancellation software, providing users with wireless and immersive audio experiences.
Noise Cancellation Software Market Dynamics
Market Trends- Emphasis on Personalized and Adaptive Noise Cancellation Solutions in the Noise Cancellation Software Market.
The development of personalized noise cancellation profiles, allowing users to customize their auditory experience by adjusting settings to suit their specific preferences or surrounding environment is driving the demand.
Adaptive technology, often leveraging sensors or sophisticated algorithms, aims to offer more precise and effective noise reduction, catering to diverse environments and user preferences.
Further, AI-driven algorithms are continuously learning and adapting to different sound environments, improving the software's ability to recognize and suppress specific types of noise is contributing to more efficient and accurate noise reduction, especially in complex and dynamic settings.
Market Driver- Proliferation of Remote Work is driving the demand for Noise Cancellation Software.
The increased need for noise cancellation software to facilitate clear and uninterrupted communication during virtual meetings, video conferences, and telecommuting are the major factors.
Minimizing distractions caused by background noise, enabling remote workers to create conducive work environments and maintain focus are increasing the market growth.
Additionally, the adoption of remote work policies by organizations is accelerating the demand, as companies seek to provide their employees with the necessary tools to maintain productivity and communication standards while working from home or in remote settings.
Market Opportunity- Growing integration of noise cancellation across diverse consumer electronics meets the rising demand for enhanced audio experiences.
The expansion beyond traditional audio devices, extending into smartphones, laptops, smart speakers, and wearables, responding to the evolving consumer demand for enhanced audio experiences across a broader spectrum of everyday devices drives the market growth.
Advancements in miniaturization techniques are enabling manufacturers to embed noise cancellation components into smaller devices while maintaining or improving performance.
Further, Manufacturers are focusing on seamlessly integrating noise cancellation functionalities into these devices without compromising their design or usability, thereby driving the market demand.
Market Share Analysis- Cloud Based will register the fastest growth.
The Noise Cancellation Software Market is analyzed across Cloud Based & On Premise. Cloud Based is poised to register the fastest growth. This innovative approach involves hosting noise cancellation features on remote servers accessible via the internet, providing users with enhanced flexibility, scalability, and accessibility. One of the key advantages lies in its accessibility, allowing users to access noise cancellation functionalities from any location with internet connectivity, fostering remote work capabilities and on-the-go usage. Scalability is another crucial aspect, enabling users to adjust resources based on their evolving needs, ensuring efficient handling of varying workloads. Moreover, the cost-efficiency of Cloud-Based models, often structured on subscription or pay-as-you-go pricing, eliminates substantial upfront infrastructure investments. Service providers manage updates, maintenance, and security remotely, ensuring users access the latest features without the burden of managing software updates.
Market Share Analysis- Large Enterprises held a significant market share in 2023.
The Noise Cancellation Software Market is analyzed across various Organizations including SMEs, Large Enterprises, and others. Of these, Large Enterprises held a significant market share in 2023. These enterprises often seek robust and comprehensive noise cancellation solutions tailored to meet stringent security standards, compliance regulations, and integration complexities. Large Enterprises typically prioritize solutions that seamlessly integrate with their existing infrastructure and systems. While some might opt for on-premises noise cancellation software to have greater control and customization over security measures, others may increasingly turn to Cloud-Based solutions for scalability and flexibility. These enterprises often have geographically dispersed teams and complex communication needs. Therefore, noise cancellation software that enables remote collaboration, seamless integration with various communication platforms, and robust security features tends to be highly valued.
Noise Cancellation Software Market Segmentation
By Type
By Application
By Platform
By Region
- North America (United States, Canada, Mexico)
- Europe (Germany, France, United Kingdom, Spain, Italy, Others)
- Asia Pacific (China, India, Japan, South Korea, Australia, Others)
- Latin America (Brazil, Argentina, Others)
- Middle East and Africa (Saudi Arabia, UAE, Kuwait, Other Middle East, South Africa, Nigeria, Other Africa)
Noise Cancellation Software Market Companies
- Krisp Technologies (United States)
- SoliCallPro (Israel)
- Audacity (United States)
- Noise Firewall (Israel)
- iZotope (United States)
- LALAL.AI (Switzerland)
- Noise Blocker (United States)
- Denoise (United States)
- IRIS Clarity (United Kingdom)
- ClaerityAI (United States)
*List not exhaustive
Noise Cancellation Software Market Outlook 2023
1 Market Overview
1.1 Introduction to the Noise Cancellation Software Market
1.2 Scope of the Study
1.3 Research Objective
1.3.1 Key Market Scope and Segments
1.3.2 Players Covered
1.3.3 Years Considered
2 Executive Summary
2.1 2023 Noise Cancellation Software Industry- Market Statistics
3 Market Dynamics
3.1 Market Drivers
3.2 Market Challenges
3.3 Market Opportunities
3.4 Market Trends
4 Market Factor Analysis
4.1 Porter’s Five Forces
4.2 Market Entropy
4.2.1 Global Noise Cancellation Software Market Companies with Area Served
4.2.2 Products Offerings Global Noise Cancellation Software Market
5 COVID-19 Impact Analysis and Outlook Scenarios
5.1.1 Covid-19 Impact Analysis
5.1.2 post-COVID-19 Scenario- Low Growth Case
5.1.3 post-COVID-19 Scenario- Reference Growth Case
5.1.4 post-COVID-19 Scenario- Low Growth Case
6 Global Noise Cancellation Software Market Trends
6.1 Global Noise Cancellation Software Revenue (USD Million) and CAGR (%) by Type (2018-2030)
6.2 Global Noise Cancellation Software Revenue (USD Million) and CAGR (%) by Applications (2018-2030)
6.3 Global Noise Cancellation Software Revenue (USD Million) and CAGR (%) by regions (2018-2030)
7 Global Noise Cancellation Software Market Revenue (USD Million) by Type, and Applications (2018-2022)
7.1 Global Noise Cancellation Software Revenue (USD Million) by Type (2018-2022)
7.1.1 Global Noise Cancellation Software Revenue (USD Million), Market Share (%) by Type (2018-2022)
7.2 Global Noise Cancellation Software Revenue (USD Million) by Applications (2018-2022)
7.2.1 Global Noise Cancellation Software Revenue (USD Million), Market Share (%) by Applications (2018-2022)
8 Global Noise Cancellation Software Development Regional Status and Outlook
8.1 Global Noise Cancellation Software Revenue (USD Million) By Regions (2018-2022)
8.2 North America Noise Cancellation Software Revenue (USD Million) by Type, and Application (2018-2022)
8.2.1 North America Noise Cancellation Software Revenue (USD Million) by Country (2018-2022)
8.2.2 North America Noise Cancellation Software Revenue (USD Million) by Type (2018-2022)
8.2.3 North America Noise Cancellation Software Revenue (USD Million) by Applications (2018-2022)
8.3 Europe Noise Cancellation Software Revenue (USD Million), by Type, and Applications (USD Million) (2018-2022)
8.3.1 Europe Noise Cancellation Software Revenue (USD Million), by Country (2018-2022)
8.3.2 Europe Noise Cancellation Software Revenue (USD Million) by Type (2018-2022)
8.3.3 Europe Noise Cancellation Software Revenue (USD Million) by Applications (2018-2022)
8.4 Asia Pacific Noise Cancellation Software Revenue (USD Million), and Revenue (USD Million) by Type, and Applications (2018-2022)
8.4.1 Asia Pacific Noise Cancellation Software Revenue (USD Million) by Country (2018-2022)
8.4.2 Asia Pacific Noise Cancellation Software Revenue (USD Million) by Type (2018-2022)
8.4.3 Asia Pacific Noise Cancellation Software Revenue (USD Million) by Applications (2018-2022)
8.5 South America Noise Cancellation Software Revenue (USD Million), by Type, and Applications (2018-2022)
8.5.1 South America Noise Cancellation Software Revenue (USD Million), by Country (2018-2022)
8.5.2 South America Noise Cancellation Software Revenue (USD Million) by Type (2018-2022)
8.5.3 South America Noise Cancellation Software Revenue (USD Million) by Applications (2018-2022)
8.6 Middle East and Africa Noise Cancellation Software Revenue (USD Million), by Type, Technology, Application, Thickness (2018-2022)
8.6.1 Middle East and Africa Noise Cancellation Software Revenue (USD Million) by Country (2018-2022)
8.6.2 Middle East and Africa Noise Cancellation Software Revenue (USD Million) by Type (2018-2022)
8.6.3 Middle East and Africa Noise Cancellation Software Revenue (USD Million) by Applications (2018-2022)
9 Company Profiles
10 Global Noise Cancellation Software Market Revenue (USD Million), by Type, and Applications (2023-2030)
10.1 Global Noise Cancellation Software Revenue (USD Million) and Market Share (%) by Type (2023-2030)
10.1.1 Global Noise Cancellation Software Revenue (USD Million), and Market Share (%) by Type (2023-2030)
10.2 Global Noise Cancellation Software Revenue (USD Million) and Market Share (%) by Applications (2023-2030)
10.2.1 Global Noise Cancellation Software Revenue (USD Million), and Market Share (%) by Applications (2023-2030)
11 Global Noise Cancellation Software Development Regional Status and Outlook Forecast
11.1 Global Noise Cancellation Software Revenue (USD Million) By Regions (2023-2030)
11.2 North America Noise Cancellation Software Revenue (USD Million) by Type, and Applications (2023-2030)
11.2.1 North America Noise Cancellation Software Revenue (USD) Million by Country (2023-2030)
11.2.2 North America Noise Cancellation Software Revenue (USD Million), by Type (2023-2030)
11.2.3 North America Noise Cancellation Software Revenue (USD Million), Market Share (%) by Applications (2023-2030)
11.3 Europe Noise Cancellation Software Revenue (USD Million), by Type, and Applications (2023-2030)
11.3.1 Europe Noise Cancellation Software Revenue (USD Million), by Country (2023-2030)
11.3.2 Europe Noise Cancellation Software Revenue (USD Million), by Type (2023-2030)
11.3.3 Europe Noise Cancellation Software Revenue (USD Million), by Applications (2023-2030)
11.4 Asia Pacific Noise Cancellation Software Revenue (USD Million) by Type, and Applications (2023-2030)
11.4.1 Asia Pacific Noise Cancellation Software Revenue (USD Million), by Country (2023-2030)
11.4.2 Asia Pacific Noise Cancellation Software Revenue (USD Million), by Type (2023-2030)
11.4.3 Asia Pacific Noise Cancellation Software Revenue (USD Million), by Applications (2023-2030)
11.5 South America Noise Cancellation Software Revenue (USD Million), by Type, and Applications (2023-2030)
11.5.1 South America Noise Cancellation Software Revenue (USD Million), by Country (2023-2030)
11.5.2 South America Noise Cancellation Software Revenue (USD Million), by Type (2023-2030)
11.5.3 South America Noise Cancellation Software Revenue (USD Million), by Applications (2023-2030)
11.6 Middle East and Africa Noise Cancellation Software Revenue (USD Million), by Type, and Applications (2023-2030)
11.6.1 Middle East and Africa Noise Cancellation Software Revenue (USD Million), by region (2023-2030)
11.6.2 Middle East and Africa Noise Cancellation Software Revenue (USD Million), by Type (2023-2030)
11.6.3 Middle East and Africa Noise Cancellation Software Revenue (USD Million), by Applications (2023-2030)
12 Methodology and Data Sources
12.1 Methodology/Research Approach
12.1.1 Research Programs/Design
12.1.2 Market Size Estimation
12.1.3 Market Breakdown and Data Triangulation
12.2 Data Sources
12.2.1 Secondary Sources
12.2.2 Primary Sources
12.3 Disclaimer
List of Tables
Table 1 Market Segmentation Analysis
Table 2 Global Noise Cancellation Software Market Companies with Areas Served
Table 3 Products Offerings Global Noise Cancellation Software Market
Table 4 Low Growth Scenario Forecasts
Table 5 Reference Case Growth Scenario
Table 6 High Growth Case Scenario
Table 7 Global Noise Cancellation Software Revenue (USD Million) And CAGR (%) By Type (2018-2030)
Table 8 Global Noise Cancellation Software Revenue (USD Million) And CAGR (%) By Applications (2018-2030)
Table 9 Global Noise Cancellation Software Revenue (USD Million) And CAGR (%) By Regions (2018-2030)
Table 10 Global Noise Cancellation Software Revenue (USD Million) By Type (2018-2022)
Table 11 Global Noise Cancellation Software Revenue Market Share (%) By Type (2018-2022)
Table 12 Global Noise Cancellation Software Revenue (USD Million) By Applications (2018-2022)
Table 13 Global Noise Cancellation Software Revenue Market Share (%) By Applications (2018-2022)
Table 14 Global Noise Cancellation Software Market Revenue (USD Million) By Regions (2018-2022)
Table 15 Global Noise Cancellation Software Market Share (%) By Regions (2018-2022)
Table 16 North America Noise Cancellation Software Revenue (USD Million) By Country (2018-2022)
Table 17 North America Noise Cancellation Software Revenue (USD Million) By Type (2018-2022)
Table 18 North America Noise Cancellation Software Revenue (USD Million) By Applications (2018-2022)
Table 19 Europe Noise Cancellation Software Revenue (USD Million) By Country (2018-2022)
Table 20 Europe Noise Cancellation Software Revenue (USD Million) By Type (2018-2022)
Table 21 Europe Noise Cancellation Software Revenue (USD Million) By Applications (2018-2022)
Table 22 Asia Pacific Noise Cancellation Software Revenue (USD Million) By Country (2018-2022)
Table 23 Asia Pacific Noise Cancellation Software Revenue (USD Million) By Type (2018-2022)
Table 24 Asia Pacific Noise Cancellation Software Revenue (USD Million) By Applications (2018-2022)
Table 25 South America Noise Cancellation Software Revenue (USD Million) By Country (2018-2022)
Table 26 South America Noise Cancellation Software Revenue (USD Million) By Type (2018-2022)
Table 27 South America Noise Cancellation Software Revenue (USD Million) By Applications (2018-2022)
Table 28 Middle East and Africa Noise Cancellation Software Revenue (USD Million) By Region (2018-2022)
Table 29 Middle East and Africa Noise Cancellation Software Revenue (USD Million) By Type (2018-2022)
Table 30 Middle East and Africa Noise Cancellation Software Revenue (USD Million) By Applications (2018-2022)
Table 31 Financial Analysis
Table 32 Global Noise Cancellation Software Revenue (USD Million) By Type (2023-2030)
Table 33 Global Noise Cancellation Software Revenue Market Share (%) By Type (2023-2030)
Table 34 Global Noise Cancellation Software Revenue (USD Million) By Applications (2023-2030)
Table 35 Global Noise Cancellation Software Revenue Market Share (%) By Applications (2023-2030)
Table 36 Global Noise Cancellation Software Market Revenue (USD Million), And Revenue (USD Million) By Regions (2023-2030)
Table 37 North America Noise Cancellation Software Revenue (USD)By Country (2023-2030)
Table 38 North America Noise Cancellation Software Revenue (USD Million) By Type (2023-2030)
Table 39 North America Noise Cancellation Software Revenue (USD Million) By Applications (2023-2030)
Table 40 Europe Noise Cancellation Software Revenue (USD Million) By Country (2023-2030)
Table 41 Europe Noise Cancellation Software Revenue (USD Million) By Type (2023-2030)
Table 42 Europe Noise Cancellation Software Revenue (USD Million) By Applications (2023-2030)
Table 43 Asia Pacific Noise Cancellation Software Revenue (USD Million) By Country (2023-2030)
Table 44 Asia Pacific Noise Cancellation Software Revenue (USD Million) By Type (2023-2030)
Table 45 Asia Pacific Noise Cancellation Software Revenue (USD Million) By Applications (2023-2030)
Table 46 South America Noise Cancellation Software Revenue (USD Million) By Country (2023-2030)
Table 47 South America Noise Cancellation Software Revenue (USD Million) By Type (2023-2030)
Table 48 South America Noise Cancellation Software Revenue (USD Million) By Applications (2023-2030)
Table 49 Middle East and Africa Noise Cancellation Software Revenue (USD Million) By Region (2023-2030)
Table 50 Middle East and Africa Noise Cancellation Software Revenue (USD Million) By Region (2023-2030)
Table 51 Middle East and Africa Noise Cancellation Software Revenue (USD Million) By Type (2023-2030)
Table 52 Middle East and Africa Noise Cancellation Software Revenue (USD Million) By Applications (2023-2030)
Table 53 Research Programs/Design for This Report
Table 54 Key Data Information from Secondary Sources
Table 55 Key Data Information from Primary Sources
List of Figures
Figure 1 Market Scope
Figure 2 Porter’s Five Forces
Figure 3 Global Noise Cancellation Software Revenue (USD Million) By Type (2018-2022)
Figure 4 Global Noise Cancellation Software Revenue Market Share (%) By Type (2022)
Figure 5 Global Noise Cancellation Software Revenue (USD Million) By Applications (2018-2022)
Figure 6 Global Noise Cancellation Software Revenue Market Share (%) By Applications (2022)
Figure 7 Global Noise Cancellation Software Market Revenue (USD Million) By Regions (2018-2022)
Figure 8 Global Noise Cancellation Software Market Share (%) By Regions (2022)
Figure 9 North America Noise Cancellation Software Revenue (USD Million) By Country (2018-2022)
Figure 10 North America Noise Cancellation Software Revenue (USD Million) By Type (2018-2022)
Figure 11 North America Noise Cancellation Software Revenue (USD Million) By Applications (2018-2022)
Figure 12 Europe Noise Cancellation Software Revenue (USD Million) By Country (2018-2022)
Figure 13 Europe Noise Cancellation Software Revenue (USD Million) By Type (2018-2022)
Figure 14 Europe Noise Cancellation Software Revenue (USD Million) By Applications (2018-2022)
Figure 15 Asia Pacific Noise Cancellation Software Revenue (USD Million) By Country (2018-2022)
Figure 16 Asia Pacific Noise Cancellation Software Revenue (USD Million) By Type (2018-2022)
Figure 17 Asia Pacific Noise Cancellation Software Revenue (USD Million) By Applications (2018-2022)
Figure 18 South America Noise Cancellation Software Revenue (USD Million) By Country (2018-2022)
Figure 19 South America Noise Cancellation Software Revenue (USD Million) By Type (2018-2022)
Figure 20 South America Noise Cancellation Software Revenue (USD Million) By Applications (2018-2022)
Figure 21 Middle East and Africa Noise Cancellation Software Revenue (USD Million) By Region (2018-2022)
Figure 22 Middle East and Africa Noise Cancellation Software Revenue (USD Million) By Type (2018-2022)
Figure 23 Middle East and Africa Noise Cancellation Software Revenue (USD Million) By Applications (2018-2022)
Figure 24 Global Noise Cancellation Software Revenue (USD Million) By Type (2023-2030)
Figure 25 Global Noise Cancellation Software Revenue Market Share (%) By Type (2030)
Figure 26 Global Noise Cancellation Software Revenue (USD Million) By Applications (2023-2030)
Figure 27 Global Noise Cancellation Software Revenue Market Share (%) By Applications (2030)
Figure 28 Global Noise Cancellation Software Market Revenue (USD Million) By Regions (2023-2030)
Figure 29 North America Noise Cancellation Software Revenue (USD Million) By Country (2023-2030)
Figure 30 North America Noise Cancellation Software Revenue (USD Million) By Type (2023-2030)
Figure 31 North America Noise Cancellation Software Revenue (USD Million) By Applications (2023-2030)
Figure 32 Europe Noise Cancellation Software Revenue (USD Million) By Country (2023-2030)
Figure 33 Europe Noise Cancellation Software Revenue (USD Million) By Type (2023-2030)
Figure 34 Europe Noise Cancellation Software Revenue (USD Million) By Applications (2023-2030)
Figure 35 Asia Pacific Noise Cancellation Software Revenue (USD Million) By Country (2023-2030)
Figure 36 Asia Pacific Noise Cancellation Software Revenue (USD Million) By Type (2023-2030)
Figure 37 Asia Pacific Noise Cancellation Software Revenue (USD Million) By Applications (2023-2030)
Figure 38 South America Noise Cancellation Software Revenue (USD Million) By Country (2023-2030)
Figure 39 South America Noise Cancellation Software Revenue (USD Million) By Type (2023-2030)
Figure 40 South America Noise Cancellation Software Revenue (USD Million) By Applications (2023-2030)
Figure 41 Middle East and Africa Noise Cancellation Software Revenue (USD Million) By Region (2023-2030)
Figure 42 Middle East and Africa Noise Cancellation Software Revenue (USD Million) By Region (2023-2030)
Figure 43 Middle East and Africa Noise Cancellation Software Revenue (USD Million) By Type (2023-2030)
Figure 44 Middle East and Africa Noise Cancellation Software Revenue (USD Million) By Applications (2023-2030)
Figure 45 Bottom-Up and Top-Down Approaches for This Report
Figure 46 Data Triangulation
