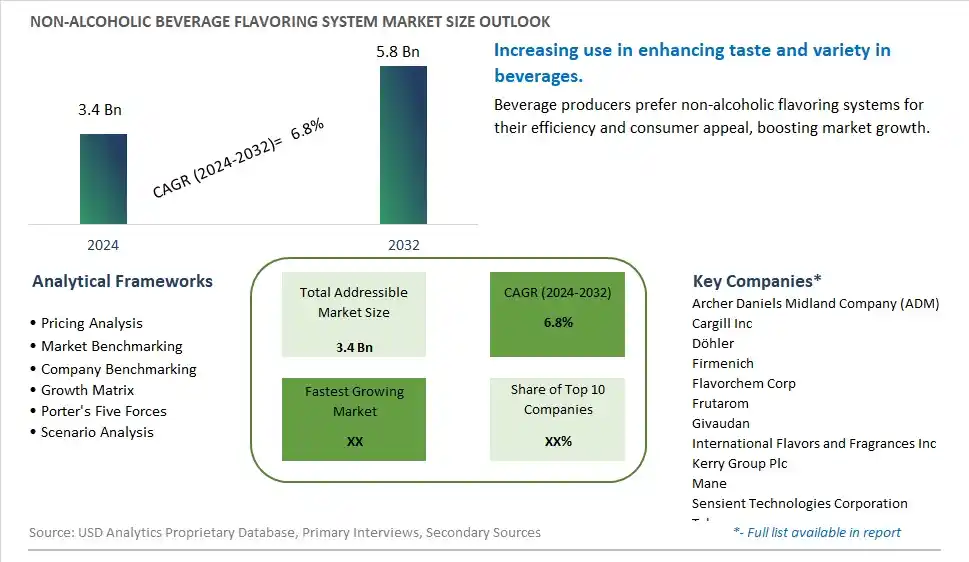
Global Non-Alcoholic Beverage Flavoring System Market Size is valued at $3.4 Billion in 2024 and is forecast to register a growth rate (CAGR) of 6.8% to reach $5.8 Billion by 2032.
The global Non-Alcoholic Beverage Flavoring System Market Comprehensive Study analyzes and forecasts the market size across 6 regions and 24 countries for diverse segments -By Type (Flavor Enhancers, Flavor Carriers, Flavoring Agents, Others), By Application (Bar, Restaurant, Coffee Shop, Fruit Juice Shop, Others)
An Introduction to Non-Alcoholic Beverage Flavoring System Market
The Non-Alcoholic Beverage Flavoring System Market focuses on the production and sale of flavoring systems used to enhance the taste of non-alcoholic beverages. These systems include natural and artificial flavors, extracts, and concentrates. The market is driven by increasing demand for innovative and flavorful beverages, rising popularity of functional and fortified drinks, and growing awareness about the benefits of natural flavors. Additionally, advancements in flavoring technologies and the expansion of product applications support market growth.
Non Alcoholic Beverage Flavoring System Competitive Landscape
The market report analyses the leading companies in the industry including Archer Daniels Midland Company (ADM), Cargill Inc, Döhler, Firmenich, Flavorchem Corp, Frutarom, Givaudan, International Flavors and Fragrances Inc, Kerry Group Plc, Mane, Sensient Technologies Corporation, Takasago, Tate & Lyle Plc, and Others.
Non Alcoholic Beverage Flavoring System Market Dynamics
Non-Alcoholic Beverage Flavoring System Market Trend: Increasing Use of Natural and Exotic Flavors
The most prominent trend in the Non-Alcoholic Beverage Flavoring System Market is the increasing use of natural and exotic flavors. As consumers seek unique and refreshing drink experiences, there is a growing demand for flavoring systems that incorporate natural ingredients and innovative flavor profiles. This trend is driven by the desire for healthier beverages that offer authentic and diverse taste experiences.
Non-Alcoholic Beverage Flavoring System Market Driver: Health Consciousness and Demand for Natural Ingredients
A key driver in the Non-Alcoholic Beverage Flavoring System Market is health consciousness and the demand for natural ingredients. As more individuals focus on improving their diet and avoiding artificial additives, there is a rising demand for beverage flavoring systems that use natural extracts, fruit concentrates, and botanical infusions. This demand supports the development of clean label and health-focused beverages, driving market growth.
Non-Alcoholic Beverage Flavoring System Market Opportunity: Innovation in Functional Flavoring Systems
One significant opportunity in the Non-Alcoholic Beverage Flavoring System Market lies in innovation in functional flavoring systems. Companies can develop new flavoring solutions that offer additional health benefits, such as added vitamins, minerals, and adaptogens, catering to the growing market for functional beverages. By offering diverse and health-focused flavoring options, manufacturers can attract a broader consumer base and drive market growth.
Non-Alcoholic Beverage Flavoring System Market Share Analysis- Largest Segment by Type
In the Non-Alcoholic Beverage Flavoring System Market, the Flavoring Agents segment is the largest. Flavoring agents are essential for creating and enhancing the taste profiles of a wide range of non-alcoholic beverages, including soft drinks, juices, and flavored waters. The demand for diverse and innovative beverage flavors drives the need for a variety of flavoring agents, which can include natural and artificial components. This segment's dominance is supported by the continuous innovation in flavor formulations and the growing consumer interest in unique and personalized beverage experiences.
Non-Alcoholic Beverage Flavoring System Market Share Analysis- Fastest Growing Segment by Application
The Coffee Shop application segment of the Non-Alcoholic Beverage Flavoring System Market is anticipated to grow the fastest over the next five years. Coffee shops are increasingly incorporating a variety of flavored syrups and additives to enhance their beverage offerings, catering to the growing consumer demand for customized and specialty drinks. The trend towards gourmet and personalized coffee experiences drives the need for innovative flavoring systems that can provide unique and high-quality flavors. Additionally, the expansion of coffee shop chains and the rise of premium coffee culture contribute to the rapid growth of this segment.
Non Alcoholic Beverage Flavoring System Market Segmentation
By Type
Flavor Enhancers
Flavor Carriers
Flavoring Agents
Others
By Application
Bar
Restaurant
Coffee Shop
Fruit Juice Shop
Others
Countries Analyzed
North America (US, Canada, Mexico)
Europe (Germany, UK, France, Spain, Italy, Russia, Rest of Europe)
Asia Pacific (China, India, Japan, South Korea, Australia, South East Asia, Rest of Asia)
South America (Brazil, Argentina, Rest of South America)
Middle East and Africa (Saudi Arabia, UAE, Rest of Middle East, South Africa, Egypt, Rest of Africa)
Non Alcoholic Beverage Flavoring System Companies Profiled in the Study
Archer Daniels Midland Company (ADM)
Cargill Inc
Döhler
Firmenich
Flavorchem Corp
Frutarom
Givaudan
International Flavors and Fragrances Inc
Kerry Group Plc
Mane
Sensient Technologies Corporation
Takasago
Tate & Lyle Plc
*- List Not Exhaustive
Chapter 1. TABLE OF CONTENTS
Chapter 2. Introduction to Non Alcoholic Beverage Flavoring System Market
2.1. Market Overview
2.2. Key Statistics and Report Highlights
2.3. Scope of the Comprehensive Study
2.3.1. Market Definition
2.3.2 Countries and Regions Covered
2.3.3 Research Objective
2.3.4 Units, Currency, and Conversions
2.3.5 Industry Value Chain
2.4. Key Market Segments
2.5. Key Companies
2.6. Study Period
Chapter 3. Strategic Analysis Review
3.1. Non Alcoholic Beverage Flavoring System Pricing Analysis and Forecast
3.2. Porter’s Five Forces
3.3. Market Ecosystem
3.4. SWOT Analysis
3.5. Regulatory Scenario
3.3. Effects of Inflation, Russia-Ukraine War, moderating economic growth, and other macroeconomic factors
Chapter 4. Competitive Landscape
4.1. Market Share Analysis
4.1.1. Global Non Alcoholic Beverage Flavoring System Market Share by Company, 2023
4.1.2. Product Offerings of Leading Non Alcoholic Beverage Flavoring System Companies
4.2. Market Entropy
4.2.1. New Product Launches in the Industry
4.2.2. Mergers, Acquisitions, Joint ventures, and Partnerships
4.3. Key Strategies and Best Practices
Chapter 5. Global Market Projections: Best, Reference, and Low Case Scenarios
5.1. Growth Analysis- Case Scenario Definitions
5.2. Low Growth Case Scenario Forecasts
5.3. Reference Growth Case Scenario Forecasts
5.4. High Growth Case Scenario Forecasts
Chapter 6. Market Dynamics
6.1. Non Alcoholic Beverage Flavoring System Market Drivers
6.2. Non Alcoholic Beverage Flavoring System Market Challenges
6.6. Non Alcoholic Beverage Flavoring System Market Opportunities
6.4. Non Alcoholic Beverage Flavoring System Market Trends
Chapter 7. Global Non Alcoholic Beverage Flavoring System Market Outlook Trends
7.1. Global Non Alcoholic Beverage Flavoring System Revenue (USD Million) and CAGR (%) by Type (2021-2032)
7.2. Global Non Alcoholic Beverage Flavoring System Revenue (USD Million) and CAGR (%) by Application (2021-2032)
7.3. Global Non Alcoholic Beverage Flavoring System Revenue (USD Million) and CAGR (%) by Product (2021-2032)
By Type
Flavor Enhancers
Flavor Carriers
Flavoring Agents
Others
By Application
Bar
Restaurant
Coffee Shop
Fruit Juice Shop
Others
Chapter 8. Global Non Alcoholic Beverage Flavoring System Regional Analysis and Outlook
8.1. Global Non Alcoholic Beverage Flavoring System Revenue (USD Million) By Regions (2021- 2032)
8.2. North America Non Alcoholic Beverage Flavoring System Revenue (USD Million) by Country (2021-2032)
8.2.1. United States Non Alcoholic Beverage Flavoring System Regional Analysis and Outlook
8.2.2. Canada Non Alcoholic Beverage Flavoring System Regional Analysis and Outlook
8.2.3. Mexico Non Alcoholic Beverage Flavoring System Regional Analysis and Outlook
8.3. Europe Non Alcoholic Beverage Flavoring System Revenue (USD Million), by Country (2021-2032)
8.3.1. Germany Non Alcoholic Beverage Flavoring System Regional Analysis and Outlook
8.3.2. France Non Alcoholic Beverage Flavoring System Regional Analysis and Outlook
8.3.3. United Kingdom Non Alcoholic Beverage Flavoring System Regional Analysis and Outlook
8.3.4. Spain Non Alcoholic Beverage Flavoring System Regional Analysis and Outlook
8.3.5. Italy Non Alcoholic Beverage Flavoring System Regional Analysis and Outlook
8.3.6. Russia Non Alcoholic Beverage Flavoring System Regional Analysis and Outlook
8.3.7. Rest of Europe Non Alcoholic Beverage Flavoring System Regional Analysis and Outlook
8.4. Asia Pacific Non Alcoholic Beverage Flavoring System Revenue (USD Million) by Country (2021-2032)
8.4.1. China Non Alcoholic Beverage Flavoring System Regional Analysis and Outlook
8.4.2. Japan Non Alcoholic Beverage Flavoring System Regional Analysis and Outlook
8.4.3. India Non Alcoholic Beverage Flavoring System Regional Analysis and Outlook
8.4.4. South Korea Non Alcoholic Beverage Flavoring System Regional Analysis and Outlook
8.4.5. Australia Non Alcoholic Beverage Flavoring System Regional Analysis and Outlook
8.4.6. South East Asia Non Alcoholic Beverage Flavoring System Regional Analysis and Outlook
8.4.7. Rest of Asia Pacific Non Alcoholic Beverage Flavoring System Regional Analysis and Outlook
8.5. South America Non Alcoholic Beverage Flavoring System Revenue (USD Million), by Country (2021-2032)
8.5.1. Brazil Non Alcoholic Beverage Flavoring System Regional Analysis and Outlook
8.5.2. Argentina Non Alcoholic Beverage Flavoring System Regional Analysis and Outlook
8.5.3. Rest of South America Non Alcoholic Beverage Flavoring System Regional Analysis and Outlook
8.6. Middle East and Africa Non Alcoholic Beverage Flavoring System Revenue (USD Million) by Country (2021-2032)
8.6.1. Middle East Non Alcoholic Beverage Flavoring System Regional Analysis and Outlook
8.6.2. Africa Non Alcoholic Beverage Flavoring System Regional Analysis and Outlook
Chapter 9. North America Non Alcoholic Beverage Flavoring System Analysis and Outlook
9.1. North America Non Alcoholic Beverage Flavoring System Revenue (USD Million) by Segments (2021-2032)
9.1.1. North America Non Alcoholic Beverage Flavoring System Revenue (USD Million) by Type (2021-2032)
9.1.2. North America Non Alcoholic Beverage Flavoring System Revenue (USD Million) by Application (2021-2032)
9.1.3. North America Non Alcoholic Beverage Flavoring System Revenue (USD Million) by Product (2021-2032)
By Type
Flavor Enhancers
Flavor Carriers
Flavoring Agents
Others
By Application
Bar
Restaurant
Coffee Shop
Fruit Juice Shop
Others
Chapter 10. Europe Non Alcoholic Beverage Flavoring System Analysis and Outlook
10.1. Europe Non Alcoholic Beverage Flavoring System Revenue (USD Million), by Segments (USD Million) (2021-2032)
10.1.1. Europe Non Alcoholic Beverage Flavoring System Revenue (USD Million) by Type (2021-2032)
10.1.2. Europe Non Alcoholic Beverage Flavoring System Revenue (USD Million) by Application (2021-2032)
10.1.3. Europe Non Alcoholic Beverage Flavoring System Revenue (USD Million) by Product (2021-2032)
By Type
Flavor Enhancers
Flavor Carriers
Flavoring Agents
Others
By Application
Bar
Restaurant
Coffee Shop
Fruit Juice Shop
Others
Chapter 11. Asia Pacific Non Alcoholic Beverage Flavoring System Analysis and Outlook
11.1. Asia Pacific Non Alcoholic Beverage Flavoring System Revenue (USD Million), and Revenue (USD Million) by Segments (2021-2032)
11.1.1. Asia Pacific Non Alcoholic Beverage Flavoring System Revenue (USD Million) by Type (2021-2032)
11.1.2. Asia Pacific Non Alcoholic Beverage Flavoring System Revenue (USD Million) by Application (2021-2032)
11.1.3. Asia Pacific Non Alcoholic Beverage Flavoring System Revenue (USD Million) by Product (2021-2032)
By Type
Flavor Enhancers
Flavor Carriers
Flavoring Agents
Others
By Application
Bar
Restaurant
Coffee Shop
Fruit Juice Shop
Others
Chapter 12. South America Non Alcoholic Beverage Flavoring System Analysis and Outlook
12.1. South America Non Alcoholic Beverage Flavoring System Revenue (USD Million), by Segments (2021-2032)
12.1.1. South America Non Alcoholic Beverage Flavoring System Revenue (USD Million) by Type (2021-2032)
12.1.2. South America Non Alcoholic Beverage Flavoring System Revenue (USD Million) by Application (2021-2032)
12.1.3. South America Non Alcoholic Beverage Flavoring System Revenue (USD Million) by Product (2021-2032)
By Type
Flavor Enhancers
Flavor Carriers
Flavoring Agents
Others
By Application
Bar
Restaurant
Coffee Shop
Fruit Juice Shop
Others
Chapter 13. Middle East and Africa Non Alcoholic Beverage Flavoring System Analysis and Outlook
13.1. Middle East and Africa Non Alcoholic Beverage Flavoring System Revenue (USD Million), by Segments (2021-2032)
13.1.1. Middle East and Africa Non Alcoholic Beverage Flavoring System Revenue (USD Million) by Type (2021-2032)
13.1.2. Middle East and Africa Non Alcoholic Beverage Flavoring System Revenue (USD Million) by Application (2021-2032)
13.1.3. Middle East and Africa Non Alcoholic Beverage Flavoring System Revenue (USD Million) by Product (2021-2032)
By Type
Flavor Enhancers
Flavor Carriers
Flavoring Agents
Others
By Application
Bar
Restaurant
Coffee Shop
Fruit Juice Shop
Others
Chapter 14. Non Alcoholic Beverage Flavoring System Company Profiles
14.1 Business Overview
14.2 Product Profiles
14.3 SWOT Profiles
14.5 Recent Developments
14.6 Financial Profile
List of Companies
Archer Daniels Midland Company (ADM)
Cargill Inc
Döhler
Firmenich
Flavorchem Corp
Frutarom
Givaudan
International Flavors and Fragrances Inc
Kerry Group Plc
Mane
Sensient Technologies Corporation
Takasago
Tate & Lyle Plc
15. Methodology and Data Sources
15.1 Customization Offerings
15.2 Subscription Services
15.3 Related Reports
15.4 Publisher Expertise
LIST OF TABLES
Table 1 Market Segmentation Analysis
Table 2 Global Non Alcoholic Beverage Flavoring System Market Share of Leading Companies, 2023
Table 3 Product Offerings of Leading Companies
Table 4 Low Growth Scenario Forecasts
Table 5 Reference Case Growth Scenario
Table 6 High Growth Case Scenario
Table 7 Global Non Alcoholic Beverage Flavoring System Revenue (USD Million) And CAGR (%) By Type (2021-2032)
Table 8 Global Non Alcoholic Beverage Flavoring System Revenue (USD Million) And CAGR (%) By Application (2021-2032)
Table 9 Global Non Alcoholic Beverage Flavoring System Revenue (USD Million) And CAGR (%) By Product (2021-2032)
Table 10 Global Non Alcoholic Beverage Flavoring System Market Revenue (USD Million) By Regions (2021-2032)
Table 11 Global Non Alcoholic Beverage Flavoring System Market Share (%) By Regions (2021-2032)
Table 12 North America Non Alcoholic Beverage Flavoring System Revenue (USD Million) By Country (2021-2032)
Table 13 Europe Non Alcoholic Beverage Flavoring System Revenue (USD Million) By Country (2021-2032)
Table 14 Asia Pacific Non Alcoholic Beverage Flavoring System Revenue (USD Million) By Country (2021-2032)
Table 15 South America Non Alcoholic Beverage Flavoring System Revenue (USD Million) By Country (2021-2032)
Table 16 Middle East and Africa Non Alcoholic Beverage Flavoring System Revenue (USD Million) By Region (2021-2032)
Table 17 North America Non Alcoholic Beverage Flavoring System Revenue (USD Million) By Type (2021-2032)
Table 18 North America Non Alcoholic Beverage Flavoring System Revenue (USD Million) By Application (2021-2032)
Table 19 North America Non Alcoholic Beverage Flavoring System Revenue (USD Million) By Product (2021-2032)
Table 20 Europe Non Alcoholic Beverage Flavoring System Revenue (USD Million) By Type (2021-2032)
Table 21 Europe Non Alcoholic Beverage Flavoring System Revenue (USD Million) By Application (2021-2032)
Table 22 Europe Non Alcoholic Beverage Flavoring System Revenue (USD Million) By Product (2021-2032)
Table 23 Asia Pacific Non Alcoholic Beverage Flavoring System Revenue (USD Million) By Type (2021-2032)
Table 24 Asia Pacific Non Alcoholic Beverage Flavoring System Revenue (USD Million) By Application (2021-2032)
Table 25 Asia Pacific Non Alcoholic Beverage Flavoring System Revenue (USD Million) By Product (2021-2032)
Table 26 South America Non Alcoholic Beverage Flavoring System Revenue (USD Million) By Type (2021-2032)
Table 27 South America Non Alcoholic Beverage Flavoring System Revenue (USD Million) By Application (2021-2032)
Table 28 South America Non Alcoholic Beverage Flavoring System Revenue (USD Million) By Product (2021-2032)
Table 29 Middle East and Africa Non Alcoholic Beverage Flavoring System Revenue (USD Million) By Type (2021-2032)
Table 30 Middle East and Africa Non Alcoholic Beverage Flavoring System Revenue (USD Million) By Application (2021-2032)
Table 31 Middle East and Africa Non Alcoholic Beverage Flavoring System Revenue (USD Million) By Product (2021-2032)
LIST OF FIGURES
Figure 1. Market Scope
Figure 2. Pricing Forecasts Per Unit, 2023- 2032
Figure 3. Porter’s Five Forces
Figure 4. Global Non Alcoholic Beverage Flavoring System Market Revenue (USD Million) By Regions (2021-2032)
Figure 5. Global Non Alcoholic Beverage Flavoring System Market Share (%) By Regions (2023)
Figure 6. North America Non Alcoholic Beverage Flavoring System Revenue (USD Million) By Country (2021-2032)
Figure 7. United States Non Alcoholic Beverage Flavoring System Revenue (USD Million) By Country (2021-2032)
Figure 8. Canada Non Alcoholic Beverage Flavoring System Revenue (USD Million) By Country (2021-2032)
Figure 9. Mexico Non Alcoholic Beverage Flavoring System Revenue (USD Million) By Country (2021-2032)
Figure 10. Europe Non Alcoholic Beverage Flavoring System Revenue (USD Million) By Country (2021-2032)
Figure 11. Germany Non Alcoholic Beverage Flavoring System Revenue (USD Million) By Country (2021-2032)
Figure 12. France Non Alcoholic Beverage Flavoring System Revenue (USD Million) By Country (2021-2032)
Figure 13. United Kingdom Non Alcoholic Beverage Flavoring System Revenue (USD Million) By Country (2021-2032)
Figure 14. Spain Non Alcoholic Beverage Flavoring System Revenue (USD Million) By Country (2021-2032)
Figure 15. Italy Non Alcoholic Beverage Flavoring System Revenue (USD Million) By Country (2021-2032)
Figure 16. Russia Non Alcoholic Beverage Flavoring System Revenue (USD Million) By Country (2021-2032)
Figure 17. Rest of Europe Non Alcoholic Beverage Flavoring System Revenue (USD Million) By Country (2021-2032)
Figure 11. Asia Pacific Non Alcoholic Beverage Flavoring System Revenue (USD Million) By Country (2021-2032)
Figure 12. China Non Alcoholic Beverage Flavoring System Revenue (USD Million) By Country (2021-2032)
Figure 13. Japan Non Alcoholic Beverage Flavoring System Revenue (USD Million) By Country (2021-2032)
Figure 14. India Non Alcoholic Beverage Flavoring System Revenue (USD Million) By Country (2021-2032)
Figure 15. South Korea Non Alcoholic Beverage Flavoring System Revenue (USD Million) By Country (2021-2032)
Figure 16. Australia Non Alcoholic Beverage Flavoring System Revenue (USD Million) By Country (2021-2032)
Figure 17. South East Asia Non Alcoholic Beverage Flavoring System Revenue (USD Million) By Country (2021-2032)
Figure 18. South America Non Alcoholic Beverage Flavoring System Revenue (USD Million) By Country (2021-2032)
Figure 19. Brazil Non Alcoholic Beverage Flavoring System Revenue (USD Million) By Country (2021-2032)
Figure 20. Argentina Non Alcoholic Beverage Flavoring System Revenue (USD Million) By Country (2021-2032)
Figure 21. Rest of Asia Pacific Non Alcoholic Beverage Flavoring System Revenue (USD Million) By Country (2021-2032)
Figure 22. Middle East and Africa Non Alcoholic Beverage Flavoring System Revenue (USD Million) By Region (2021-2032)
Figure 23. Saudi Arabia Non Alcoholic Beverage Flavoring System Revenue (USD Million) By Region (2021-2032)
Figure 24. The UAE Non Alcoholic Beverage Flavoring System Revenue (USD Million) By Region (2021-2032)
Figure 25. Rest of Middle East Non Alcoholic Beverage Flavoring System Revenue (USD Million) By Region (2021-2032)
Figure 26. South Africa Non Alcoholic Beverage Flavoring System Revenue (USD Million) By Region (2021-2032)
Figure 27. Africa Non Alcoholic Beverage Flavoring System Revenue (USD Million) By Region (2021-2032)
Figure 28. North America Non Alcoholic Beverage Flavoring System Revenue (USD Million) By Type (2021-2032)
Figure 29. North America Non Alcoholic Beverage Flavoring System Revenue (USD Million) By Application (2021-2032)
Figure 30. North America Non Alcoholic Beverage Flavoring System Revenue (USD Million) By Product (2021-2032)
Figure 31. Europe Non Alcoholic Beverage Flavoring System Revenue (USD Million) By Type (2021-2032)
Figure 32. Europe Non Alcoholic Beverage Flavoring System Revenue (USD Million) By Application (2021-2032)
Figure 33. Europe Non Alcoholic Beverage Flavoring System Revenue (USD Million) By Product (2021-2032)
Figure 34. Asia Pacific Non Alcoholic Beverage Flavoring System Revenue (USD Million) By Type (2021-2032)
Figure 35. Asia Pacific Non Alcoholic Beverage Flavoring System Revenue (USD Million) By Application (2021-2032)
Figure 36. Asia Pacific Non Alcoholic Beverage Flavoring System Revenue (USD Million) By Product (2021-2032)
Figure 37. South America Non Alcoholic Beverage Flavoring System Revenue (USD Million) By Type (2021-2032)
Figure 38. South America Non Alcoholic Beverage Flavoring System Revenue (USD Million) By Application (2021-2032)
Figure 39. South America Non Alcoholic Beverage Flavoring System Revenue (USD Million) By Product (2021-2032)
Figure 40. Middle East and Africa Non Alcoholic Beverage Flavoring System Revenue (USD Million) By Type (2021-2032)
Figure 41. Middle East and Africa Non Alcoholic Beverage Flavoring System Revenue (USD Million) By Application (2021-2032)
Figure 42. Middle East and Africa Non Alcoholic Beverage Flavoring System Revenue (USD Million) By Product (2021-2032)
By Type
Flavor Enhancers
Flavor Carriers
Flavoring Agents
Others
By Application
Bar
Restaurant
Coffee Shop
Fruit Juice Shop
Others
Countries Analyzed
North America (US, Canada, Mexico)
Europe (Germany, UK, France, Spain, Italy, Russia, Rest of Europe)
Asia Pacific (China, India, Japan, South Korea, Australia, South East Asia, Rest of Asia)
South America (Brazil, Argentina, Rest of South America)
Middle East and Africa (Saudi Arabia, UAE, Rest of Middle East, South Africa, Egypt, Rest of Africa)
