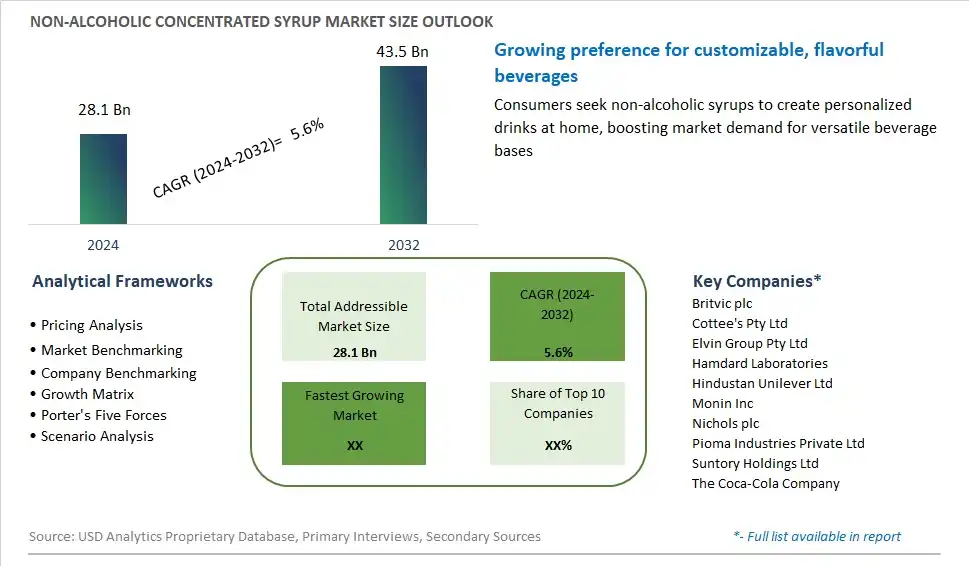
Global Non-Alcoholic Concentrated Syrup Market Size is valued at $28.1 Billion in 2024 and is forecast to register a growth rate (CAGR) of 5.6% to reach $43.5 Billion by 2032.
The global Non-Alcoholic Concentrated Syrup Market Comprehensive Study analyzes and forecasts the market size across 6 regions and 24 countries for diverse segments -By Product (Fruit, Vegetable, Herbs & Spices, Medical), By Distribution Channel (Supermarkets/Hypermarkets, Convenience Stores, Online)
An Introduction to Non-Alcoholic Concentrated Syrup Market
The non-alcoholic concentrated syrup market in 2024 is flourishing, driven by increasing demand for customizable and versatile beverage options. These syrups, used to flavor a variety of drinks such as sodas, mocktails, and teas, offer consumers the ability to create personalized beverages at home or in foodservice settings. The market includes a wide range of flavors, from classic fruit and berry to exotic and gourmet options, catering to diverse taste preferences. Health-conscious consumers are driving demand for syrups made with natural ingredients, reduced sugar, and added functional benefits such as vitamins and antioxidants. The rise of the craft beverage movement and the growing popularity of non-alcoholic drinks have further propelled the market's growth. Innovations in packaging and dispensing technologies, along with expanding distribution channels, are making non-alcoholic concentrated syrups more accessible and appealing to a broad audience seeking high-quality, customizable drink solutions.
Non Alcoholic Concentrated Syrup Competitive Landscape
The market report analyses the leading companies in the industry including Britvic plc, Cottee's Pty Ltd, Elvin Group Pty Ltd, Hamdard Laboratories, Hindustan Unilever Ltd, Monin Inc, Nichols plc, Pioma Industries Private Ltd, Suntory Holdings Ltd, The Coca-Cola Company, and Others.
Non Alcoholic Concentrated Syrup Market Dynamics
Market Trend: Rise of DIY Beverage Culture
The most prominent trend in the Non-Alcoholic Concentrated Syrup Market is the rise of the DIY beverage culture. Consumers are increasingly interested in creating their own drinks at home, from mocktails and flavored sodas to custom coffee and tea beverages. Non-alcoholic concentrated syrups provide a convenient and versatile solution for this trend, allowing consumers to experiment with different flavors and customize their drinks. The growing popularity of home brewing and mixology is driving the demand for high-quality concentrated syrups
Market Driver: Health and Wellness Movement
The health and wellness movement is a major driver of the Non-Alcoholic Concentrated Syrup Market. As consumers become more health-conscious, they are seeking alternatives to sugary and artificially flavored beverages. Non-alcoholic concentrated syrups, especially those made with natural ingredients and low sugar content, are appealing to this health-conscious demographic. The demand for healthier drink options is driving market growth as manufacturers respond with syrups that align with current health trends
Market Opportunity: Introduction of Functional Syrups
A significant opportunity in the Non-Alcoholic Concentrated Syrup Market lies in the introduction of functional syrups. These syrups, which can be enriched with vitamins, minerals, and other health-promoting ingredients, offer added value to consumers seeking both flavor and functionality in their beverages. By developing and marketing functional syrups, companies can tap into the growing demand for functional foods and beverages, attract health-conscious consumers, and differentiate their products in the market
Non-Alcoholic Concentrated Syrup Market Share Analysis: By Product (Fruit, Vegetable, Herbs & Spices, Medical)
The fruit segment is expected to be the fastest-growing in the Non-Alcoholic Concentrated Syrup Market by product to 2032. Fruit syrups are widely used in various applications, including beverages, desserts, and culinary preparations, due to their natural sweetness and flavor. The increasing demand for natural and healthy ingredients drives the growth of the fruit syrup segment. Additionally, the rising popularity of homemade and artisanal beverages, such as mocktails and flavored water, boosts the demand for fruit syrups. The availability of a wide range of fruit flavors and the growing trend of clean label and organic products further support the expansion of this segment.
Non-Alcoholic Concentrated Syrup Market Share Analysis: By Distribution Channel (Supermarkets/Hypermarkets, Convenience Stores, Online)
The online distribution channel is projected to be the fastest-growing segment in the Non-Alcoholic Concentrated Syrup Market by distribution channel to 2032. The rise of e-commerce platforms and the increasing preference for online shopping among consumers, particularly due to the convenience and wider product selection, drive this growth. Online platforms offer detailed product descriptions, reviews, and often more competitive pricing, which appeal to informed and price-sensitive consumers. The COVID-19 pandemic has significantly accelerated the shift towards online grocery shopping, making it a preferred option for many. Subscription services and direct-to-consumer models also contribute to the segment's rapid expansion, allowing consumers to regularly receive their favorite non-alcoholic concentrated syrup products at their doorstep.
Non Alcoholic Concentrated Syrup Market Segmentation
By Product
Fruit
Vegetable
Herbs & Spices
Medical
By Distribution Channel
Supermarkets/Hypermarkets
Convenience Stores
Online
Countries Analyzed
North America (US, Canada, Mexico)
Europe (Germany, UK, France, Spain, Italy, Russia, Rest of Europe)
Asia Pacific (China, India, Japan, South Korea, Australia, South East Asia, Rest of Asia)
South America (Brazil, Argentina, Rest of South America)
Middle East and Africa (Saudi Arabia, UAE, Rest of Middle East, South Africa, Egypt, Rest of Africa)
Non Alcoholic Concentrated Syrup Companies Profiled in the Study
Britvic plc
Cottee's Pty Ltd
Elvin Group Pty Ltd
Hamdard Laboratories
Hindustan Unilever Ltd
Monin Inc
Nichols plc
Pioma Industries Private Ltd
Suntory Holdings Ltd
The Coca-Cola Company
*- List Not Exhaustive
Chapter 1. TABLE OF CONTENTS
Chapter 2. Introduction to Non Alcoholic Concentrated Syrup Market
2.1. Market Overview
2.2. Key Statistics and Report Highlights
2.3. Scope of the Comprehensive Study
2.3.1. Market Definition
2.3.2 Countries and Regions Covered
2.3.3 Research Objective
2.3.4 Units, Currency, and Conversions
2.3.5 Industry Value Chain
2.4. Key Market Segments
2.5. Key Companies
2.6. Study Period
Chapter 3. Strategic Analysis Review
3.1. Non Alcoholic Concentrated Syrup Pricing Analysis and Forecast
3.2. Porter’s Five Forces
3.3. Market Ecosystem
3.4. SWOT Analysis
3.5. Regulatory Scenario
3.3. Effects of Inflation, Russia-Ukraine War, moderating economic growth, and other macroeconomic factors
Chapter 4. Competitive Landscape
4.1. Market Share Analysis
4.1.1. Global Non Alcoholic Concentrated Syrup Market Share by Company, 2023
4.1.2. Product Offerings of Leading Non Alcoholic Concentrated Syrup Companies
4.2. Market Entropy
4.2.1. New Product Launches in the Industry
4.2.2. Mergers, Acquisitions, Joint ventures, and Partnerships
4.3. Key Strategies and Best Practices
Chapter 5. Global Market Projections: Best, Reference, and Low Case Scenarios
5.1. Growth Analysis- Case Scenario Definitions
5.2. Low Growth Case Scenario Forecasts
5.3. Reference Growth Case Scenario Forecasts
5.4. High Growth Case Scenario Forecasts
Chapter 6. Market Dynamics
6.1. Non Alcoholic Concentrated Syrup Market Drivers
6.2. Non Alcoholic Concentrated Syrup Market Challenges
6.6. Non Alcoholic Concentrated Syrup Market Opportunities
6.4. Non Alcoholic Concentrated Syrup Market Trends
Chapter 7. Global Non Alcoholic Concentrated Syrup Market Outlook Trends
7.1. Global Non Alcoholic Concentrated Syrup Revenue (USD Million) and CAGR (%) by Type (2021-2032)
7.2. Global Non Alcoholic Concentrated Syrup Revenue (USD Million) and CAGR (%) by Application (2021-2032)
7.3. Global Non Alcoholic Concentrated Syrup Revenue (USD Million) and CAGR (%) by Product (2021-2032)
By Product
Fruit
Vegetable
Herbs & Spices
Medical
By Distribution Channel
Supermarkets/Hypermarkets
Convenience Stores
Online
Chapter 8. Global Non Alcoholic Concentrated Syrup Regional Analysis and Outlook
8.1. Global Non Alcoholic Concentrated Syrup Revenue (USD Million) By Regions (2021- 2032)
8.2. North America Non Alcoholic Concentrated Syrup Revenue (USD Million) by Country (2021-2032)
8.2.1. United States Non Alcoholic Concentrated Syrup Regional Analysis and Outlook
8.2.2. Canada Non Alcoholic Concentrated Syrup Regional Analysis and Outlook
8.2.3. Mexico Non Alcoholic Concentrated Syrup Regional Analysis and Outlook
8.3. Europe Non Alcoholic Concentrated Syrup Revenue (USD Million), by Country (2021-2032)
8.3.1. Germany Non Alcoholic Concentrated Syrup Regional Analysis and Outlook
8.3.2. France Non Alcoholic Concentrated Syrup Regional Analysis and Outlook
8.3.3. United Kingdom Non Alcoholic Concentrated Syrup Regional Analysis and Outlook
8.3.4. Spain Non Alcoholic Concentrated Syrup Regional Analysis and Outlook
8.3.5. Italy Non Alcoholic Concentrated Syrup Regional Analysis and Outlook
8.3.6. Russia Non Alcoholic Concentrated Syrup Regional Analysis and Outlook
8.3.7. Rest of Europe Non Alcoholic Concentrated Syrup Regional Analysis and Outlook
8.4. Asia Pacific Non Alcoholic Concentrated Syrup Revenue (USD Million) by Country (2021-2032)
8.4.1. China Non Alcoholic Concentrated Syrup Regional Analysis and Outlook
8.4.2. Japan Non Alcoholic Concentrated Syrup Regional Analysis and Outlook
8.4.3. India Non Alcoholic Concentrated Syrup Regional Analysis and Outlook
8.4.4. South Korea Non Alcoholic Concentrated Syrup Regional Analysis and Outlook
8.4.5. Australia Non Alcoholic Concentrated Syrup Regional Analysis and Outlook
8.4.6. South East Asia Non Alcoholic Concentrated Syrup Regional Analysis and Outlook
8.4.7. Rest of Asia Pacific Non Alcoholic Concentrated Syrup Regional Analysis and Outlook
8.5. South America Non Alcoholic Concentrated Syrup Revenue (USD Million), by Country (2021-2032)
8.5.1. Brazil Non Alcoholic Concentrated Syrup Regional Analysis and Outlook
8.5.2. Argentina Non Alcoholic Concentrated Syrup Regional Analysis and Outlook
8.5.3. Rest of South America Non Alcoholic Concentrated Syrup Regional Analysis and Outlook
8.6. Middle East and Africa Non Alcoholic Concentrated Syrup Revenue (USD Million) by Country (2021-2032)
8.6.1. Middle East Non Alcoholic Concentrated Syrup Regional Analysis and Outlook
8.6.2. Africa Non Alcoholic Concentrated Syrup Regional Analysis and Outlook
Chapter 9. North America Non Alcoholic Concentrated Syrup Analysis and Outlook
9.1. North America Non Alcoholic Concentrated Syrup Revenue (USD Million) by Segments (2021-2032)
9.1.1. North America Non Alcoholic Concentrated Syrup Revenue (USD Million) by Type (2021-2032)
9.1.2. North America Non Alcoholic Concentrated Syrup Revenue (USD Million) by Application (2021-2032)
9.1.3. North America Non Alcoholic Concentrated Syrup Revenue (USD Million) by Product (2021-2032)
By Product
Fruit
Vegetable
Herbs & Spices
Medical
By Distribution Channel
Supermarkets/Hypermarkets
Convenience Stores
Online
Chapter 10. Europe Non Alcoholic Concentrated Syrup Analysis and Outlook
10.1. Europe Non Alcoholic Concentrated Syrup Revenue (USD Million), by Segments (USD Million) (2021-2032)
10.1.1. Europe Non Alcoholic Concentrated Syrup Revenue (USD Million) by Type (2021-2032)
10.1.2. Europe Non Alcoholic Concentrated Syrup Revenue (USD Million) by Application (2021-2032)
10.1.3. Europe Non Alcoholic Concentrated Syrup Revenue (USD Million) by Product (2021-2032)
By Product
Fruit
Vegetable
Herbs & Spices
Medical
By Distribution Channel
Supermarkets/Hypermarkets
Convenience Stores
Online
Chapter 11. Asia Pacific Non Alcoholic Concentrated Syrup Analysis and Outlook
11.1. Asia Pacific Non Alcoholic Concentrated Syrup Revenue (USD Million), and Revenue (USD Million) by Segments (2021-2032)
11.1.1. Asia Pacific Non Alcoholic Concentrated Syrup Revenue (USD Million) by Type (2021-2032)
11.1.2. Asia Pacific Non Alcoholic Concentrated Syrup Revenue (USD Million) by Application (2021-2032)
11.1.3. Asia Pacific Non Alcoholic Concentrated Syrup Revenue (USD Million) by Product (2021-2032)
By Product
Fruit
Vegetable
Herbs & Spices
Medical
By Distribution Channel
Supermarkets/Hypermarkets
Convenience Stores
Online
Chapter 12. South America Non Alcoholic Concentrated Syrup Analysis and Outlook
12.1. South America Non Alcoholic Concentrated Syrup Revenue (USD Million), by Segments (2021-2032)
12.1.1. South America Non Alcoholic Concentrated Syrup Revenue (USD Million) by Type (2021-2032)
12.1.2. South America Non Alcoholic Concentrated Syrup Revenue (USD Million) by Application (2021-2032)
12.1.3. South America Non Alcoholic Concentrated Syrup Revenue (USD Million) by Product (2021-2032)
By Product
Fruit
Vegetable
Herbs & Spices
Medical
By Distribution Channel
Supermarkets/Hypermarkets
Convenience Stores
Online
Chapter 13. Middle East and Africa Non Alcoholic Concentrated Syrup Analysis and Outlook
13.1. Middle East and Africa Non Alcoholic Concentrated Syrup Revenue (USD Million), by Segments (2021-2032)
13.1.1. Middle East and Africa Non Alcoholic Concentrated Syrup Revenue (USD Million) by Type (2021-2032)
13.1.2. Middle East and Africa Non Alcoholic Concentrated Syrup Revenue (USD Million) by Application (2021-2032)
13.1.3. Middle East and Africa Non Alcoholic Concentrated Syrup Revenue (USD Million) by Product (2021-2032)
By Product
Fruit
Vegetable
Herbs & Spices
Medical
By Distribution Channel
Supermarkets/Hypermarkets
Convenience Stores
Online
Chapter 14. Non Alcoholic Concentrated Syrup Company Profiles
14.1 Business Overview
14.2 Product Profiles
14.3 SWOT Profiles
14.5 Recent Developments
14.6 Financial Profile
List of Companies
Britvic plc
Cottee's Pty Ltd
Elvin Group Pty Ltd
Hamdard Laboratories
Hindustan Unilever Ltd
Monin Inc
Nichols plc
Pioma Industries Private Ltd
Suntory Holdings Ltd
The Coca-Cola Company
15. Methodology and Data Sources
15.1 Customization Offerings
15.2 Subscription Services
15.3 Related Reports
15.4 Publisher Expertise
LIST OF TABLES
Table 1 Market Segmentation Analysis
Table 2 Global Non Alcoholic Concentrated Syrup Market Share of Leading Companies, 2023
Table 3 Product Offerings of Leading Companies
Table 4 Low Growth Scenario Forecasts
Table 5 Reference Case Growth Scenario
Table 6 High Growth Case Scenario
Table 7 Global Non Alcoholic Concentrated Syrup Revenue (USD Million) And CAGR (%) By Type (2021-2032)
Table 8 Global Non Alcoholic Concentrated Syrup Revenue (USD Million) And CAGR (%) By Application (2021-2032)
Table 9 Global Non Alcoholic Concentrated Syrup Revenue (USD Million) And CAGR (%) By Product (2021-2032)
Table 10 Global Non Alcoholic Concentrated Syrup Market Revenue (USD Million) By Regions (2021-2032)
Table 11 Global Non Alcoholic Concentrated Syrup Market Share (%) By Regions (2021-2032)
Table 12 North America Non Alcoholic Concentrated Syrup Revenue (USD Million) By Country (2021-2032)
Table 13 Europe Non Alcoholic Concentrated Syrup Revenue (USD Million) By Country (2021-2032)
Table 14 Asia Pacific Non Alcoholic Concentrated Syrup Revenue (USD Million) By Country (2021-2032)
Table 15 South America Non Alcoholic Concentrated Syrup Revenue (USD Million) By Country (2021-2032)
Table 16 Middle East and Africa Non Alcoholic Concentrated Syrup Revenue (USD Million) By Region (2021-2032)
Table 17 North America Non Alcoholic Concentrated Syrup Revenue (USD Million) By Type (2021-2032)
Table 18 North America Non Alcoholic Concentrated Syrup Revenue (USD Million) By Application (2021-2032)
Table 19 North America Non Alcoholic Concentrated Syrup Revenue (USD Million) By Product (2021-2032)
Table 20 Europe Non Alcoholic Concentrated Syrup Revenue (USD Million) By Type (2021-2032)
Table 21 Europe Non Alcoholic Concentrated Syrup Revenue (USD Million) By Application (2021-2032)
Table 22 Europe Non Alcoholic Concentrated Syrup Revenue (USD Million) By Product (2021-2032)
Table 23 Asia Pacific Non Alcoholic Concentrated Syrup Revenue (USD Million) By Type (2021-2032)
Table 24 Asia Pacific Non Alcoholic Concentrated Syrup Revenue (USD Million) By Application (2021-2032)
Table 25 Asia Pacific Non Alcoholic Concentrated Syrup Revenue (USD Million) By Product (2021-2032)
Table 26 South America Non Alcoholic Concentrated Syrup Revenue (USD Million) By Type (2021-2032)
Table 27 South America Non Alcoholic Concentrated Syrup Revenue (USD Million) By Application (2021-2032)
Table 28 South America Non Alcoholic Concentrated Syrup Revenue (USD Million) By Product (2021-2032)
Table 29 Middle East and Africa Non Alcoholic Concentrated Syrup Revenue (USD Million) By Type (2021-2032)
Table 30 Middle East and Africa Non Alcoholic Concentrated Syrup Revenue (USD Million) By Application (2021-2032)
Table 31 Middle East and Africa Non Alcoholic Concentrated Syrup Revenue (USD Million) By Product (2021-2032)
LIST OF FIGURES
Figure 1. Market Scope
Figure 2. Pricing Forecasts Per Unit, 2023- 2032
Figure 3. Porter’s Five Forces
Figure 4. Global Non Alcoholic Concentrated Syrup Market Revenue (USD Million) By Regions (2021-2032)
Figure 5. Global Non Alcoholic Concentrated Syrup Market Share (%) By Regions (2023)
Figure 6. North America Non Alcoholic Concentrated Syrup Revenue (USD Million) By Country (2021-2032)
Figure 7. United States Non Alcoholic Concentrated Syrup Revenue (USD Million) By Country (2021-2032)
Figure 8. Canada Non Alcoholic Concentrated Syrup Revenue (USD Million) By Country (2021-2032)
Figure 9. Mexico Non Alcoholic Concentrated Syrup Revenue (USD Million) By Country (2021-2032)
Figure 10. Europe Non Alcoholic Concentrated Syrup Revenue (USD Million) By Country (2021-2032)
Figure 11. Germany Non Alcoholic Concentrated Syrup Revenue (USD Million) By Country (2021-2032)
Figure 12. France Non Alcoholic Concentrated Syrup Revenue (USD Million) By Country (2021-2032)
Figure 13. United Kingdom Non Alcoholic Concentrated Syrup Revenue (USD Million) By Country (2021-2032)
Figure 14. Spain Non Alcoholic Concentrated Syrup Revenue (USD Million) By Country (2021-2032)
Figure 15. Italy Non Alcoholic Concentrated Syrup Revenue (USD Million) By Country (2021-2032)
Figure 16. Russia Non Alcoholic Concentrated Syrup Revenue (USD Million) By Country (2021-2032)
Figure 17. Rest of Europe Non Alcoholic Concentrated Syrup Revenue (USD Million) By Country (2021-2032)
Figure 11. Asia Pacific Non Alcoholic Concentrated Syrup Revenue (USD Million) By Country (2021-2032)
Figure 12. China Non Alcoholic Concentrated Syrup Revenue (USD Million) By Country (2021-2032)
Figure 13. Japan Non Alcoholic Concentrated Syrup Revenue (USD Million) By Country (2021-2032)
Figure 14. India Non Alcoholic Concentrated Syrup Revenue (USD Million) By Country (2021-2032)
Figure 15. South Korea Non Alcoholic Concentrated Syrup Revenue (USD Million) By Country (2021-2032)
Figure 16. Australia Non Alcoholic Concentrated Syrup Revenue (USD Million) By Country (2021-2032)
Figure 17. South East Asia Non Alcoholic Concentrated Syrup Revenue (USD Million) By Country (2021-2032)
Figure 18. South America Non Alcoholic Concentrated Syrup Revenue (USD Million) By Country (2021-2032)
Figure 19. Brazil Non Alcoholic Concentrated Syrup Revenue (USD Million) By Country (2021-2032)
Figure 20. Argentina Non Alcoholic Concentrated Syrup Revenue (USD Million) By Country (2021-2032)
Figure 21. Rest of Asia Pacific Non Alcoholic Concentrated Syrup Revenue (USD Million) By Country (2021-2032)
Figure 22. Middle East and Africa Non Alcoholic Concentrated Syrup Revenue (USD Million) By Region (2021-2032)
Figure 23. Saudi Arabia Non Alcoholic Concentrated Syrup Revenue (USD Million) By Region (2021-2032)
Figure 24. The UAE Non Alcoholic Concentrated Syrup Revenue (USD Million) By Region (2021-2032)
Figure 25. Rest of Middle East Non Alcoholic Concentrated Syrup Revenue (USD Million) By Region (2021-2032)
Figure 26. South Africa Non Alcoholic Concentrated Syrup Revenue (USD Million) By Region (2021-2032)
Figure 27. Africa Non Alcoholic Concentrated Syrup Revenue (USD Million) By Region (2021-2032)
Figure 28. North America Non Alcoholic Concentrated Syrup Revenue (USD Million) By Type (2021-2032)
Figure 29. North America Non Alcoholic Concentrated Syrup Revenue (USD Million) By Application (2021-2032)
Figure 30. North America Non Alcoholic Concentrated Syrup Revenue (USD Million) By Product (2021-2032)
Figure 31. Europe Non Alcoholic Concentrated Syrup Revenue (USD Million) By Type (2021-2032)
Figure 32. Europe Non Alcoholic Concentrated Syrup Revenue (USD Million) By Application (2021-2032)
Figure 33. Europe Non Alcoholic Concentrated Syrup Revenue (USD Million) By Product (2021-2032)
Figure 34. Asia Pacific Non Alcoholic Concentrated Syrup Revenue (USD Million) By Type (2021-2032)
Figure 35. Asia Pacific Non Alcoholic Concentrated Syrup Revenue (USD Million) By Application (2021-2032)
Figure 36. Asia Pacific Non Alcoholic Concentrated Syrup Revenue (USD Million) By Product (2021-2032)
Figure 37. South America Non Alcoholic Concentrated Syrup Revenue (USD Million) By Type (2021-2032)
Figure 38. South America Non Alcoholic Concentrated Syrup Revenue (USD Million) By Application (2021-2032)
Figure 39. South America Non Alcoholic Concentrated Syrup Revenue (USD Million) By Product (2021-2032)
Figure 40. Middle East and Africa Non Alcoholic Concentrated Syrup Revenue (USD Million) By Type (2021-2032)
Figure 41. Middle East and Africa Non Alcoholic Concentrated Syrup Revenue (USD Million) By Application (2021-2032)
Figure 42. Middle East and Africa Non Alcoholic Concentrated Syrup Revenue (USD Million) By Product (2021-2032)
By Product
Fruit
Vegetable
Herbs & Spices
Medical
By Distribution Channel
Supermarkets/Hypermarkets
Convenience Stores
Online
Countries Analyzed
North America (US, Canada, Mexico)
Europe (Germany, UK, France, Spain, Italy, Russia, Rest of Europe)
Asia Pacific (China, India, Japan, South Korea, Australia, South East Asia, Rest of Asia)
South America (Brazil, Argentina, Rest of South America)
Middle East and Africa (Saudi Arabia, UAE, Rest of Middle East, South Africa, Egypt, Rest of Africa)
