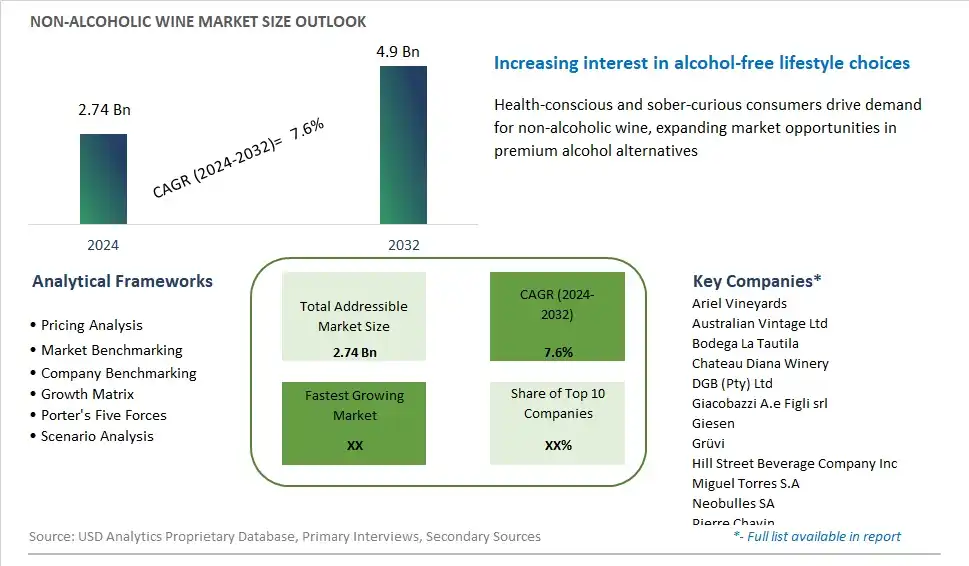
Global Non-Alcoholic Wine Market Size is valued at $2.74 Billion in 2024 and is forecast to register a growth rate (CAGR) of 7.6% to reach $4.9 Billion by 2032.
The global Non-Alcoholic Wine Market Comprehensive Study analyzes and forecasts the market size across 6 regions and 24 countries for diverse segments -By Product (Sparkling Wine, Still Wine), By ABV (ABV (0.0%), ABV (Up to 0.5%), ABV (Up to 1.2%)), By Packaging (Bottles, Cans), By Distribution Channel (On-Trade, Off-Trade)
An Introduction to Non-Alcoholic Wine Market
The non-alcoholic wines market in 2024 is witnessing robust growth, driven by the increasing demand for healthier and mindful drinking alternatives. Non-alcoholic wines offer the sophisticated taste and experience of traditional wines without the alcohol content, appealing to health-conscious consumers and those seeking to reduce or eliminate alcohol intake. This market includes a variety of wine types, from reds and whites to sparkling and rosé, catering to diverse palates and occasions. Advances in winemaking technology have significantly improved the quality and authenticity of non-alcoholic wines, making them more appealing to wine enthusiasts. The rise of sober-curious and wellness trends, along with growing social acceptance of non-alcoholic beverages, has further propelled market growth. As consumers continue to prioritize health and well-being, the non-alcoholic wines market is poised for continued expansion, with increasing product variety and availability enhancing its appeal.
Non alcoholic Wine Competitive Landscape
The market report analyses the leading companies in the industry including Ariel Vineyards, Australian Vintage Ltd, Bodega La Tautila, Chateau Diana Winery, DGB (Pty) Ltd, Giacobazzi A.e Figli srl, Giesen, Grüvi, Hill Street Beverage Company Inc, Miguel Torres S.A, Neobulles SA, Pierre Chavin, Proxies, San Antonio Winery, Schloss Wachenheim AG, Sutter Home Wine Estate, Thomson and Scott, Weingut Leitz KG, and Others.
Non alcoholic Wine Market Dynamics
Market Trend: Increasing Popularity of Sober Lifestyle
The most prominent trend in the Non-Alcoholic Wines Market is the increasing popularity of the sober lifestyle. More consumers are choosing to reduce or eliminate alcohol consumption for health, wellness, and personal reasons. This trend is driving the demand for high-quality non-alcoholic wines that offer the taste and experience of traditional wine without the alcohol content. Innovations in production techniques and flavor enhancement are making non-alcoholic wines more appealing to a broader audience
Market Driver: Health and Wellness Awareness
Health and wellness awareness is a major driver of the Non-Alcoholic Wines Market. Consumers are becoming more conscious of the negative health impacts of alcohol consumption, such as liver damage and increased cancer risk. This awareness is prompting them to seek healthier beverage alternatives. Non-alcoholic wines, which offer the benefits of traditional wine without the harmful effects of alcohol, are gaining popularity among health-conscious consumers, driving market growth
Market Opportunity: Expansion of Product Variety
A significant opportunity in the Non-Alcoholic Wines Market lies in the expansion of product variety. As the demand for non-alcoholic wines grows, there is potential for companies to introduce a wider range of options, including different varietals, flavors, and packaging formats. By offering a diverse selection of non-alcoholic wines, companies can cater to various consumer preferences and occasions, enhancing their market presence and attracting new customers
Non-Alcoholic Wines Market Share Analysis: By Product (Sparkling Wine, Still Wine)
The sparkling wine segment is anticipated to be the fastest-growing in the Non-Alcoholic Wines Market by product to 2032. Sparkling wine is increasingly favored by consumers seeking a festive and celebratory beverage without the alcohol content. The growing trend towards health and wellness, along with the demand for sophisticated and indulgent non-alcoholic options, drives the growth of the sparkling wine segment. Additionally, the expanding availability of high-quality, non-alcoholic sparkling wines in various flavors and styles appeals to a broad consumer base. The rise of social occasions and events where non-alcoholic options are preferred further supports the segment's rapid growth.
Non-Alcoholic Wines Market Share Analysis: ABV (ABV (0.0%), ABV (Up to 0.5%), ABV (Up to 1.2%))
The ABV (0.0%) segment is expected to be the fastest-growing in the Non-Alcoholic Wines Market by ABV to 2032. The demand for completely alcohol-free beverages is rising, driven by health-conscious consumers and those who avoid alcohol for personal, religious, or medical reasons. The ABV (0.0%) wines cater to a growing market segment seeking the taste and experience of traditional wines without any alcohol content. Additionally, advancements in winemaking technology have improved the quality and flavor profile of 0.0% ABV wines, making them more appealing to discerning consumers. The increasing awareness of the negative health impacts of alcohol consumption further fuels the demand for 0.0% ABV wines.
Non-Alcoholic Wines Market Share Analysis: Packaging (Bottles, Cans)
The cans segment is anticipated to be the fastest-growing in the Non-Alcoholic Wines Market by packaging to 2032. Canned non-alcoholic wines offer several advantages, including portability, convenience, and portion control, which appeal to modern consumers with active lifestyles. The rise of outdoor activities, picnics, and on-the-go consumption has increased the demand for canned beverages. Additionally, cans are more environmentally friendly and easier to recycle than glass bottles, aligning with the growing consumer preference for sustainable packaging. The expanding variety of canned non-alcoholic wine options in different flavors and styles further drives the segment's growth.
Non-Alcoholic Wines Market Share Analysis: Distribution Channel (On-Trade, Off-Trade)
The on-trade segment is expected to be the fastest-growing in the Non-Alcoholic Wines Market by distribution channel to 2032. The increasing popularity of non-alcoholic wines in restaurants, bars, and hotels drives the growth of this segment. Consumers are increasingly seeking sophisticated and enjoyable non-alcoholic beverage options when dining out or socializing. The growing trend of mindful drinking and the rise of health-conscious consumers contribute to the demand for non-alcoholic wines in on-trade establishments. Additionally, the expansion of non-alcoholic wine offerings in premium and upscale venues enhances the segment's growth.
Non alcoholic Wine Market Segmentation
By Product
Sparkling Wine
Still Wine
By ABV (%)
ABV (0.0%)
ABV (Up to 0.5%)
ABV (Up to 1.2%)
By Packaging
Bottles
Cans
By Distribution Channel
On-Trade
Off-Trade
-Hypermarkets/Supermarkets
-Online
-Specialty Stores & Tasting Rooms
-Others
Countries Analyzed
North America (US, Canada, Mexico)
Europe (Germany, UK, France, Spain, Italy, Russia, Rest of Europe)
Asia Pacific (China, India, Japan, South Korea, Australia, South East Asia, Rest of Asia)
South America (Brazil, Argentina, Rest of South America)
Middle East and Africa (Saudi Arabia, UAE, Rest of Middle East, South Africa, Egypt, Rest of Africa)
Non alcoholic Wine Companies Profiled in the Study
Ariel Vineyards
Australian Vintage Ltd
Bodega La Tautila
Chateau Diana Winery
DGB (Pty) Ltd
Giacobazzi A.e Figli srl
Giesen
Grüvi
Hill Street Beverage Company Inc
Miguel Torres S.A
Neobulles SA
Pierre Chavin
Proxies
San Antonio Winery
Schloss Wachenheim AG
Sutter Home Wine Estate
Thomson and Scott
Weingut Leitz KG
*- List Not Exhaustive
Chapter 1. TABLE OF CONTENTS
Chapter 2. Introduction to Non alcoholic Wine Market
2.1. Market Overview
2.2. Key Statistics and Report Highlights
2.3. Scope of the Comprehensive Study
2.3.1. Market Definition
2.3.2 Countries and Regions Covered
2.3.3 Research Objective
2.3.4 Units, Currency, and Conversions
2.3.5 Industry Value Chain
2.4. Key Market Segments
2.5. Key Companies
2.6. Study Period
Chapter 3. Strategic Analysis Review
3.1. Non alcoholic Wine Pricing Analysis and Forecast
3.2. Porter’s Five Forces
3.3. Market Ecosystem
3.4. SWOT Analysis
3.5. Regulatory Scenario
3.3. Effects of Inflation, Russia-Ukraine War, moderating economic growth, and other macroeconomic factors
Chapter 4. Competitive Landscape
4.1. Market Share Analysis
4.1.1. Global Non alcoholic Wine Market Share by Company, 2023
4.1.2. Product Offerings of Leading Non alcoholic Wine Companies
4.2. Market Entropy
4.2.1. New Product Launches in the Industry
4.2.2. Mergers, Acquisitions, Joint ventures, and Partnerships
4.3. Key Strategies and Best Practices
Chapter 5. Global Market Projections: Best, Reference, and Low Case Scenarios
5.1. Growth Analysis- Case Scenario Definitions
5.2. Low Growth Case Scenario Forecasts
5.3. Reference Growth Case Scenario Forecasts
5.4. High Growth Case Scenario Forecasts
Chapter 6. Market Dynamics
6.1. Non alcoholic Wine Market Drivers
6.2. Non alcoholic Wine Market Challenges
6.6. Non alcoholic Wine Market Opportunities
6.4. Non alcoholic Wine Market Trends
Chapter 7. Global Non alcoholic Wine Market Outlook Trends
7.1. Global Non alcoholic Wine Revenue (USD Million) and CAGR (%) by Type (2021-2032)
7.2. Global Non alcoholic Wine Revenue (USD Million) and CAGR (%) by Application (2021-2032)
7.3. Global Non alcoholic Wine Revenue (USD Million) and CAGR (%) by Product (2021-2032)
By Product
Sparkling Wine
Still Wine
By ABV (%)
ABV (0.0%)
ABV (Up to 0.5%)
ABV (Up to 1.2%)
By Packaging
Bottles
Cans
By Distribution Channel
On-Trade
Off-Trade
-Hypermarkets/Supermarkets
-Online
-Specialty Stores & Tasting Rooms
-Others
Chapter 8. Global Non alcoholic Wine Regional Analysis and Outlook
8.1. Global Non alcoholic Wine Revenue (USD Million) By Regions (2021- 2032)
8.2. North America Non alcoholic Wine Revenue (USD Million) by Country (2021-2032)
8.2.1. United States Non alcoholic Wine Regional Analysis and Outlook
8.2.2. Canada Non alcoholic Wine Regional Analysis and Outlook
8.2.3. Mexico Non alcoholic Wine Regional Analysis and Outlook
8.3. Europe Non alcoholic Wine Revenue (USD Million), by Country (2021-2032)
8.3.1. Germany Non alcoholic Wine Regional Analysis and Outlook
8.3.2. France Non alcoholic Wine Regional Analysis and Outlook
8.3.3. United Kingdom Non alcoholic Wine Regional Analysis and Outlook
8.3.4. Spain Non alcoholic Wine Regional Analysis and Outlook
8.3.5. Italy Non alcoholic Wine Regional Analysis and Outlook
8.3.6. Russia Non alcoholic Wine Regional Analysis and Outlook
8.3.7. Rest of Europe Non alcoholic Wine Regional Analysis and Outlook
8.4. Asia Pacific Non alcoholic Wine Revenue (USD Million) by Country (2021-2032)
8.4.1. China Non alcoholic Wine Regional Analysis and Outlook
8.4.2. Japan Non alcoholic Wine Regional Analysis and Outlook
8.4.3. India Non alcoholic Wine Regional Analysis and Outlook
8.4.4. South Korea Non alcoholic Wine Regional Analysis and Outlook
8.4.5. Australia Non alcoholic Wine Regional Analysis and Outlook
8.4.6. South East Asia Non alcoholic Wine Regional Analysis and Outlook
8.4.7. Rest of Asia Pacific Non alcoholic Wine Regional Analysis and Outlook
8.5. South America Non alcoholic Wine Revenue (USD Million), by Country (2021-2032)
8.5.1. Brazil Non alcoholic Wine Regional Analysis and Outlook
8.5.2. Argentina Non alcoholic Wine Regional Analysis and Outlook
8.5.3. Rest of South America Non alcoholic Wine Regional Analysis and Outlook
8.6. Middle East and Africa Non alcoholic Wine Revenue (USD Million) by Country (2021-2032)
8.6.1. Middle East Non alcoholic Wine Regional Analysis and Outlook
8.6.2. Africa Non alcoholic Wine Regional Analysis and Outlook
Chapter 9. North America Non alcoholic Wine Analysis and Outlook
9.1. North America Non alcoholic Wine Revenue (USD Million) by Segments (2021-2032)
9.1.1. North America Non alcoholic Wine Revenue (USD Million) by Type (2021-2032)
9.1.2. North America Non alcoholic Wine Revenue (USD Million) by Application (2021-2032)
9.1.3. North America Non alcoholic Wine Revenue (USD Million) by Product (2021-2032)
By Product
Sparkling Wine
Still Wine
By ABV (%)
ABV (0.0%)
ABV (Up to 0.5%)
ABV (Up to 1.2%)
By Packaging
Bottles
Cans
By Distribution Channel
On-Trade
Off-Trade
-Hypermarkets/Supermarkets
-Online
-Specialty Stores & Tasting Rooms
-Others
Chapter 10. Europe Non alcoholic Wine Analysis and Outlook
10.1. Europe Non alcoholic Wine Revenue (USD Million), by Segments (USD Million) (2021-2032)
10.1.1. Europe Non alcoholic Wine Revenue (USD Million) by Type (2021-2032)
10.1.2. Europe Non alcoholic Wine Revenue (USD Million) by Application (2021-2032)
10.1.3. Europe Non alcoholic Wine Revenue (USD Million) by Product (2021-2032)
By Product
Sparkling Wine
Still Wine
By ABV (%)
ABV (0.0%)
ABV (Up to 0.5%)
ABV (Up to 1.2%)
By Packaging
Bottles
Cans
By Distribution Channel
On-Trade
Off-Trade
-Hypermarkets/Supermarkets
-Online
-Specialty Stores & Tasting Rooms
-Others
Chapter 11. Asia Pacific Non alcoholic Wine Analysis and Outlook
11.1. Asia Pacific Non alcoholic Wine Revenue (USD Million), and Revenue (USD Million) by Segments (2021-2032)
11.1.1. Asia Pacific Non alcoholic Wine Revenue (USD Million) by Type (2021-2032)
11.1.2. Asia Pacific Non alcoholic Wine Revenue (USD Million) by Application (2021-2032)
11.1.3. Asia Pacific Non alcoholic Wine Revenue (USD Million) by Product (2021-2032)
By Product
Sparkling Wine
Still Wine
By ABV (%)
ABV (0.0%)
ABV (Up to 0.5%)
ABV (Up to 1.2%)
By Packaging
Bottles
Cans
By Distribution Channel
On-Trade
Off-Trade
-Hypermarkets/Supermarkets
-Online
-Specialty Stores & Tasting Rooms
-Others
Chapter 12. South America Non alcoholic Wine Analysis and Outlook
12.1. South America Non alcoholic Wine Revenue (USD Million), by Segments (2021-2032)
12.1.1. South America Non alcoholic Wine Revenue (USD Million) by Type (2021-2032)
12.1.2. South America Non alcoholic Wine Revenue (USD Million) by Application (2021-2032)
12.1.3. South America Non alcoholic Wine Revenue (USD Million) by Product (2021-2032)
By Product
Sparkling Wine
Still Wine
By ABV (%)
ABV (0.0%)
ABV (Up to 0.5%)
ABV (Up to 1.2%)
By Packaging
Bottles
Cans
By Distribution Channel
On-Trade
Off-Trade
-Hypermarkets/Supermarkets
-Online
-Specialty Stores & Tasting Rooms
-Others
Chapter 13. Middle East and Africa Non alcoholic Wine Analysis and Outlook
13.1. Middle East and Africa Non alcoholic Wine Revenue (USD Million), by Segments (2021-2032)
13.1.1. Middle East and Africa Non alcoholic Wine Revenue (USD Million) by Type (2021-2032)
13.1.2. Middle East and Africa Non alcoholic Wine Revenue (USD Million) by Application (2021-2032)
13.1.3. Middle East and Africa Non alcoholic Wine Revenue (USD Million) by Product (2021-2032)
By Product
Sparkling Wine
Still Wine
By ABV (%)
ABV (0.0%)
ABV (Up to 0.5%)
ABV (Up to 1.2%)
By Packaging
Bottles
Cans
By Distribution Channel
On-Trade
Off-Trade
-Hypermarkets/Supermarkets
-Online
-Specialty Stores & Tasting Rooms
-Others
Chapter 14. Non alcoholic Wine Company Profiles
14.1 Business Overview
14.2 Product Profiles
14.3 SWOT Profiles
14.5 Recent Developments
14.6 Financial Profile
List of Companies
Ariel Vineyards
Australian Vintage Ltd
Bodega La Tautila
Chateau Diana Winery
DGB (Pty) Ltd
Giacobazzi A.e Figli srl
Giesen
Grüvi
Hill Street Beverage Company Inc
Miguel Torres S.A
Neobulles SA
Pierre Chavin
Proxies
San Antonio Winery
Schloss Wachenheim AG
Sutter Home Wine Estate
Thomson and Scott
Weingut Leitz KG
15. Methodology and Data Sources
15.1 Customization Offerings
15.2 Subscription Services
15.3 Related Reports
15.4 Publisher Expertise
LIST OF TABLES
Table 1 Market Segmentation Analysis
Table 2 Global Non alcoholic Wine Market Share of Leading Companies, 2023
Table 3 Product Offerings of Leading Companies
Table 4 Low Growth Scenario Forecasts
Table 5 Reference Case Growth Scenario
Table 6 High Growth Case Scenario
Table 7 Global Non alcoholic Wine Revenue (USD Million) And CAGR (%) By Type (2021-2032)
Table 8 Global Non alcoholic Wine Revenue (USD Million) And CAGR (%) By Application (2021-2032)
Table 9 Global Non alcoholic Wine Revenue (USD Million) And CAGR (%) By Product (2021-2032)
Table 10 Global Non alcoholic Wine Market Revenue (USD Million) By Regions (2021-2032)
Table 11 Global Non alcoholic Wine Market Share (%) By Regions (2021-2032)
Table 12 North America Non alcoholic Wine Revenue (USD Million) By Country (2021-2032)
Table 13 Europe Non alcoholic Wine Revenue (USD Million) By Country (2021-2032)
Table 14 Asia Pacific Non alcoholic Wine Revenue (USD Million) By Country (2021-2032)
Table 15 South America Non alcoholic Wine Revenue (USD Million) By Country (2021-2032)
Table 16 Middle East and Africa Non alcoholic Wine Revenue (USD Million) By Region (2021-2032)
Table 17 North America Non alcoholic Wine Revenue (USD Million) By Type (2021-2032)
Table 18 North America Non alcoholic Wine Revenue (USD Million) By Application (2021-2032)
Table 19 North America Non alcoholic Wine Revenue (USD Million) By Product (2021-2032)
Table 20 Europe Non alcoholic Wine Revenue (USD Million) By Type (2021-2032)
Table 21 Europe Non alcoholic Wine Revenue (USD Million) By Application (2021-2032)
Table 22 Europe Non alcoholic Wine Revenue (USD Million) By Product (2021-2032)
Table 23 Asia Pacific Non alcoholic Wine Revenue (USD Million) By Type (2021-2032)
Table 24 Asia Pacific Non alcoholic Wine Revenue (USD Million) By Application (2021-2032)
Table 25 Asia Pacific Non alcoholic Wine Revenue (USD Million) By Product (2021-2032)
Table 26 South America Non alcoholic Wine Revenue (USD Million) By Type (2021-2032)
Table 27 South America Non alcoholic Wine Revenue (USD Million) By Application (2021-2032)
Table 28 South America Non alcoholic Wine Revenue (USD Million) By Product (2021-2032)
Table 29 Middle East and Africa Non alcoholic Wine Revenue (USD Million) By Type (2021-2032)
Table 30 Middle East and Africa Non alcoholic Wine Revenue (USD Million) By Application (2021-2032)
Table 31 Middle East and Africa Non alcoholic Wine Revenue (USD Million) By Product (2021-2032)
LIST OF FIGURES
Figure 1. Market Scope
Figure 2. Pricing Forecasts Per Unit, 2023- 2032
Figure 3. Porter’s Five Forces
Figure 4. Global Non alcoholic Wine Market Revenue (USD Million) By Regions (2021-2032)
Figure 5. Global Non alcoholic Wine Market Share (%) By Regions (2023)
Figure 6. North America Non alcoholic Wine Revenue (USD Million) By Country (2021-2032)
Figure 7. United States Non alcoholic Wine Revenue (USD Million) By Country (2021-2032)
Figure 8. Canada Non alcoholic Wine Revenue (USD Million) By Country (2021-2032)
Figure 9. Mexico Non alcoholic Wine Revenue (USD Million) By Country (2021-2032)
Figure 10. Europe Non alcoholic Wine Revenue (USD Million) By Country (2021-2032)
Figure 11. Germany Non alcoholic Wine Revenue (USD Million) By Country (2021-2032)
Figure 12. France Non alcoholic Wine Revenue (USD Million) By Country (2021-2032)
Figure 13. United Kingdom Non alcoholic Wine Revenue (USD Million) By Country (2021-2032)
Figure 14. Spain Non alcoholic Wine Revenue (USD Million) By Country (2021-2032)
Figure 15. Italy Non alcoholic Wine Revenue (USD Million) By Country (2021-2032)
Figure 16. Russia Non alcoholic Wine Revenue (USD Million) By Country (2021-2032)
Figure 17. Rest of Europe Non alcoholic Wine Revenue (USD Million) By Country (2021-2032)
Figure 11. Asia Pacific Non alcoholic Wine Revenue (USD Million) By Country (2021-2032)
Figure 12. China Non alcoholic Wine Revenue (USD Million) By Country (2021-2032)
Figure 13. Japan Non alcoholic Wine Revenue (USD Million) By Country (2021-2032)
Figure 14. India Non alcoholic Wine Revenue (USD Million) By Country (2021-2032)
Figure 15. South Korea Non alcoholic Wine Revenue (USD Million) By Country (2021-2032)
Figure 16. Australia Non alcoholic Wine Revenue (USD Million) By Country (2021-2032)
Figure 17. South East Asia Non alcoholic Wine Revenue (USD Million) By Country (2021-2032)
Figure 18. South America Non alcoholic Wine Revenue (USD Million) By Country (2021-2032)
Figure 19. Brazil Non alcoholic Wine Revenue (USD Million) By Country (2021-2032)
Figure 20. Argentina Non alcoholic Wine Revenue (USD Million) By Country (2021-2032)
Figure 21. Rest of Asia Pacific Non alcoholic Wine Revenue (USD Million) By Country (2021-2032)
Figure 22. Middle East and Africa Non alcoholic Wine Revenue (USD Million) By Region (2021-2032)
Figure 23. Saudi Arabia Non alcoholic Wine Revenue (USD Million) By Region (2021-2032)
Figure 24. The UAE Non alcoholic Wine Revenue (USD Million) By Region (2021-2032)
Figure 25. Rest of Middle East Non alcoholic Wine Revenue (USD Million) By Region (2021-2032)
Figure 26. South Africa Non alcoholic Wine Revenue (USD Million) By Region (2021-2032)
Figure 27. Africa Non alcoholic Wine Revenue (USD Million) By Region (2021-2032)
Figure 28. North America Non alcoholic Wine Revenue (USD Million) By Type (2021-2032)
Figure 29. North America Non alcoholic Wine Revenue (USD Million) By Application (2021-2032)
Figure 30. North America Non alcoholic Wine Revenue (USD Million) By Product (2021-2032)
Figure 31. Europe Non alcoholic Wine Revenue (USD Million) By Type (2021-2032)
Figure 32. Europe Non alcoholic Wine Revenue (USD Million) By Application (2021-2032)
Figure 33. Europe Non alcoholic Wine Revenue (USD Million) By Product (2021-2032)
Figure 34. Asia Pacific Non alcoholic Wine Revenue (USD Million) By Type (2021-2032)
Figure 35. Asia Pacific Non alcoholic Wine Revenue (USD Million) By Application (2021-2032)
Figure 36. Asia Pacific Non alcoholic Wine Revenue (USD Million) By Product (2021-2032)
Figure 37. South America Non alcoholic Wine Revenue (USD Million) By Type (2021-2032)
Figure 38. South America Non alcoholic Wine Revenue (USD Million) By Application (2021-2032)
Figure 39. South America Non alcoholic Wine Revenue (USD Million) By Product (2021-2032)
Figure 40. Middle East and Africa Non alcoholic Wine Revenue (USD Million) By Type (2021-2032)
Figure 41. Middle East and Africa Non alcoholic Wine Revenue (USD Million) By Application (2021-2032)
Figure 42. Middle East and Africa Non alcoholic Wine Revenue (USD Million) By Product (2021-2032)
By Product
Sparkling Wine
Still Wine
By ABV (%)
ABV (0.0%)
ABV (Up to 0.5%)
ABV (Up to 1.2%)
By Packaging
Bottles
Cans
By Distribution Channel
On-Trade
Off-Trade
-Hypermarkets/Supermarkets
-Online
-Specialty Stores & Tasting Rooms
-Others
Countries Analyzed
North America (US, Canada, Mexico)
Europe (Germany, UK, France, Spain, Italy, Russia, Rest of Europe)
Asia Pacific (China, India, Japan, South Korea, Australia, South East Asia, Rest of Asia)
South America (Brazil, Argentina, Rest of South America)
Middle East and Africa (Saudi Arabia, UAE, Rest of Middle East, South Africa, Egypt, Rest of Africa)
