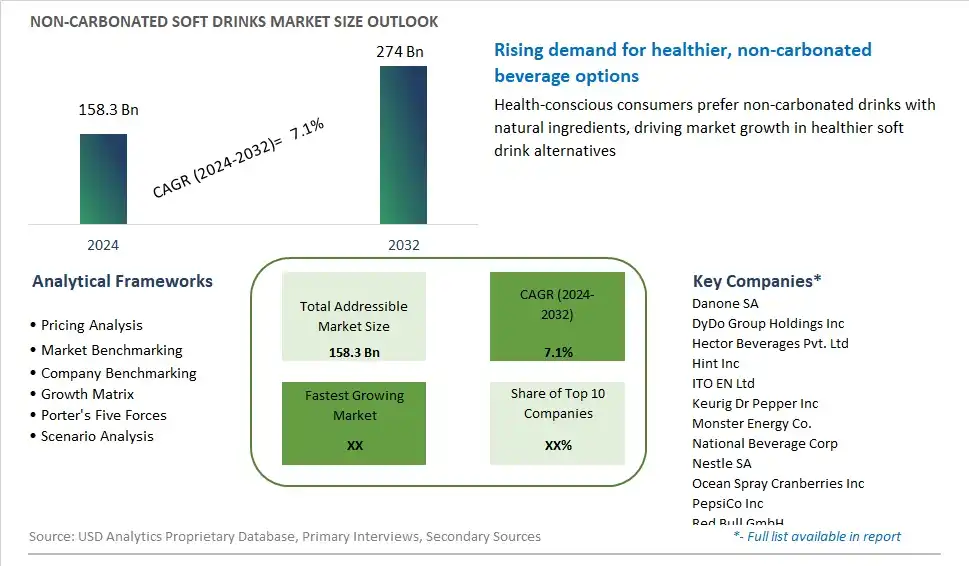
Global Non-Carbonated Soft Drinks Market Size is valued at $158.3 Billion in 2024 and is forecast to register a growth rate (CAGR) of 7.1% to reach $274 Billion by 2032.
The global Non-Carbonated Soft Drinks Market Comprehensive Study analyzes and forecasts the market size across 6 regions and 24 countries for diverse segments -By Product (RTD, Sparkling & Flavored Water), By Distribution Channel (Hypermarkets/Supermarkets, Convenience Store, Online, Others)
An Introduction to Non-Carbonated Soft Drinks Market
In 2024, the non-carbonated soft drinks market is thriving, reflecting a growing consumer preference for healthier and more diverse beverage options. This market includes a wide range of products such as fruit juices, iced teas, sports drinks, flavored waters, and functional beverages. The trend towards health and wellness has significantly impacted this market, with consumers seeking drinks that offer nutritional benefits, natural ingredients, and low or no sugar content. Innovations in flavor and formulation have led to the development of beverages that cater to specific health needs, such as hydration, energy, and immunity. The market is also influenced by the increasing demand for clean label products, with consumers favoring transparency in ingredients and minimal processing. As the global population continues to prioritize health and convenience, the non-carbonated soft drinks market is set for sustained growth, driven by ongoing product innovation and expanding distribution channels.
Non Carbonated Soft Drinks Competitive Landscape
The market report analyses the leading companies in the industry including Danone SA, DyDo Group Holdings Inc, Hector Beverages Pvt. Ltd, Hint Inc, ITO EN Ltd, Keurig Dr Pepper Inc, Monster Energy Co., National Beverage Corp, Nestle SA, Ocean Spray Cranberries Inc, PepsiCo Inc, Red Bull GmbH, Spindrift Beverage Co. Inc, Suntory Holdings Ltd, The Coca-Cola Company, The Hain Celestial Group Inc, The Kraft Heinz Company, and Others.
Non Carbonated Soft Drinks Market Dynamics
Market Trend: Shift Towards Healthier Beverages
The most prominent trend in the Non-Carbonated Soft Drinks Market is the shift towards healthier beverages. Consumers are increasingly seeking out drinks that are low in sugar, free from artificial additives, and enriched with natural ingredients. This trend is driven by the growing health and wellness movement, which emphasizes the importance of a balanced diet and mindful consumption. As a result, non-carbonated soft drinks that meet these criteria are gaining popularity and driving market innovation
Market Driver: Demand for Functional Beverages
The demand for functional beverages is a major driver of the Non-Carbonated Soft Drinks Market. Consumers are looking for drinks that offer additional health benefits, such as hydration, energy, and immunity support. Non-carbonated soft drinks that incorporate functional ingredients like vitamins, minerals, and herbal extracts are meeting this demand. The growing interest in functional foods and beverages is driving market growth as manufacturers develop new products that cater to these consumer needs
Market Opportunity: Innovation in Natural Ingredients
A significant opportunity in the Non-Carbonated Soft Drinks Market lies in innovation in natural ingredients. As consumers become more discerning about the quality and source of their beverages, there is a rising demand for drinks made with organic, non-GMO, and sustainably sourced ingredients. Companies can capitalize on this by introducing non-carbonated soft drinks that highlight their use of premium natural ingredients, appealing to health-conscious and environmentally aware consumers
Non-Carbonated Soft Drinks Market Share Analysis: Product (RTD, Sparkling & Flavored Water)
Ready-to-drink (RTD) beverages are projected to be the fastest-growing segment in the Non-Carbonated Soft Drinks Market by product to 2032. The convenience and portability of RTD beverages, combined with the growing demand for healthier and functional drink options, drive this segment's rapid growth. Consumers increasingly prefer RTD beverages that offer hydration, energy, and nutritional benefits without the added sugars and artificial ingredients commonly found in carbonated drinks. The wide variety of flavors, ingredients, and formulations available in the RTD segment appeals to diverse consumer preferences. Additionally, the rise of on-the-go lifestyles and the increasing availability of RTD beverages in various retail channels support the segment's expansion.
Non-Carbonated Soft Drinks Market Share Analysis: Distribution Channel (Hypermarkets/Supermarkets, Convenience Store, Online, Others)
The online distribution channel is anticipated to be the fastest-growing segment in the Non-Carbonated Soft Drinks Market by distribution channel to 2032. The convenience and accessibility of online shopping, combined with the growing consumer preference for e-commerce, drive the rapid growth of this segment. Online platforms offer a wide variety of non-carbonated soft drinks, detailed product descriptions, and customer reviews, making it easier for consumers to make informed purchasing decisions. The COVID-19 pandemic has further accelerated the shift towards online shopping, as consumers seek contactless and convenient ways to purchase their favorite beverages. Subscription services and direct-to-consumer models also contribute to the segment's expansion, providing consumers with regular deliveries of their preferred non-carbonated soft drinks.
Non Carbonated Soft Drinks Market Segmentation
By Product
RTD
Sparkling & Flavored Water
By Distribution Channel
Hypermarkets/Supermarkets
Convenience Store
Online
Others
Countries Analyzed
North America (US, Canada, Mexico)
Europe (Germany, UK, France, Spain, Italy, Russia, Rest of Europe)
Asia Pacific (China, India, Japan, South Korea, Australia, South East Asia, Rest of Asia)
South America (Brazil, Argentina, Rest of South America)
Middle East and Africa (Saudi Arabia, UAE, Rest of Middle East, South Africa, Egypt, Rest of Africa)
Non Carbonated Soft Drinks Companies Profiled in the Study
Danone SA
DyDo Group Holdings Inc
Hector Beverages Pvt. Ltd
Hint Inc
ITO EN Ltd
Keurig Dr Pepper Inc
Monster Energy Co.
National Beverage Corp
Nestle SA
Ocean Spray Cranberries Inc
PepsiCo Inc
Red Bull GmbH
Spindrift Beverage Co. Inc
Suntory Holdings Ltd
The Coca-Cola Company
The Hain Celestial Group Inc
The Kraft Heinz Company
*- List Not Exhaustive
Chapter 1. TABLE OF CONTENTS
Chapter 2. Introduction to Non Carbonated Soft Drinks Market
2.1. Market Overview
2.2. Key Statistics and Report Highlights
2.3. Scope of the Comprehensive Study
2.3.1. Market Definition
2.3.2 Countries and Regions Covered
2.3.3 Research Objective
2.3.4 Units, Currency, and Conversions
2.3.5 Industry Value Chain
2.4. Key Market Segments
2.5. Key Companies
2.6. Study Period
Chapter 3. Strategic Analysis Review
3.1. Non Carbonated Soft Drinks Pricing Analysis and Forecast
3.2. Porter’s Five Forces
3.3. Market Ecosystem
3.4. SWOT Analysis
3.5. Regulatory Scenario
3.3. Effects of Inflation, Russia-Ukraine War, moderating economic growth, and other macroeconomic factors
Chapter 4. Competitive Landscape
4.1. Market Share Analysis
4.1.1. Global Non Carbonated Soft Drinks Market Share by Company, 2023
4.1.2. Product Offerings of Leading Non Carbonated Soft Drinks Companies
4.2. Market Entropy
4.2.1. New Product Launches in the Industry
4.2.2. Mergers, Acquisitions, Joint ventures, and Partnerships
4.3. Key Strategies and Best Practices
Chapter 5. Global Market Projections: Best, Reference, and Low Case Scenarios
5.1. Growth Analysis- Case Scenario Definitions
5.2. Low Growth Case Scenario Forecasts
5.3. Reference Growth Case Scenario Forecasts
5.4. High Growth Case Scenario Forecasts
Chapter 6. Market Dynamics
6.1. Non Carbonated Soft Drinks Market Drivers
6.2. Non Carbonated Soft Drinks Market Challenges
6.6. Non Carbonated Soft Drinks Market Opportunities
6.4. Non Carbonated Soft Drinks Market Trends
Chapter 7. Global Non Carbonated Soft Drinks Market Outlook Trends
7.1. Global Non Carbonated Soft Drinks Revenue (USD Million) and CAGR (%) by Type (2021-2032)
7.2. Global Non Carbonated Soft Drinks Revenue (USD Million) and CAGR (%) by Application (2021-2032)
7.3. Global Non Carbonated Soft Drinks Revenue (USD Million) and CAGR (%) by Product (2021-2032)
By Product
RTD
Sparkling & Flavored Water
By Distribution Channel
Hypermarkets/Supermarkets
Convenience Store
Online
Others
Chapter 8. Global Non Carbonated Soft Drinks Regional Analysis and Outlook
8.1. Global Non Carbonated Soft Drinks Revenue (USD Million) By Regions (2021- 2032)
8.2. North America Non Carbonated Soft Drinks Revenue (USD Million) by Country (2021-2032)
8.2.1. United States Non Carbonated Soft Drinks Regional Analysis and Outlook
8.2.2. Canada Non Carbonated Soft Drinks Regional Analysis and Outlook
8.2.3. Mexico Non Carbonated Soft Drinks Regional Analysis and Outlook
8.3. Europe Non Carbonated Soft Drinks Revenue (USD Million), by Country (2021-2032)
8.3.1. Germany Non Carbonated Soft Drinks Regional Analysis and Outlook
8.3.2. France Non Carbonated Soft Drinks Regional Analysis and Outlook
8.3.3. United Kingdom Non Carbonated Soft Drinks Regional Analysis and Outlook
8.3.4. Spain Non Carbonated Soft Drinks Regional Analysis and Outlook
8.3.5. Italy Non Carbonated Soft Drinks Regional Analysis and Outlook
8.3.6. Russia Non Carbonated Soft Drinks Regional Analysis and Outlook
8.3.7. Rest of Europe Non Carbonated Soft Drinks Regional Analysis and Outlook
8.4. Asia Pacific Non Carbonated Soft Drinks Revenue (USD Million) by Country (2021-2032)
8.4.1. China Non Carbonated Soft Drinks Regional Analysis and Outlook
8.4.2. Japan Non Carbonated Soft Drinks Regional Analysis and Outlook
8.4.3. India Non Carbonated Soft Drinks Regional Analysis and Outlook
8.4.4. South Korea Non Carbonated Soft Drinks Regional Analysis and Outlook
8.4.5. Australia Non Carbonated Soft Drinks Regional Analysis and Outlook
8.4.6. South East Asia Non Carbonated Soft Drinks Regional Analysis and Outlook
8.4.7. Rest of Asia Pacific Non Carbonated Soft Drinks Regional Analysis and Outlook
8.5. South America Non Carbonated Soft Drinks Revenue (USD Million), by Country (2021-2032)
8.5.1. Brazil Non Carbonated Soft Drinks Regional Analysis and Outlook
8.5.2. Argentina Non Carbonated Soft Drinks Regional Analysis and Outlook
8.5.3. Rest of South America Non Carbonated Soft Drinks Regional Analysis and Outlook
8.6. Middle East and Africa Non Carbonated Soft Drinks Revenue (USD Million) by Country (2021-2032)
8.6.1. Middle East Non Carbonated Soft Drinks Regional Analysis and Outlook
8.6.2. Africa Non Carbonated Soft Drinks Regional Analysis and Outlook
Chapter 9. North America Non Carbonated Soft Drinks Analysis and Outlook
9.1. North America Non Carbonated Soft Drinks Revenue (USD Million) by Segments (2021-2032)
9.1.1. North America Non Carbonated Soft Drinks Revenue (USD Million) by Type (2021-2032)
9.1.2. North America Non Carbonated Soft Drinks Revenue (USD Million) by Application (2021-2032)
9.1.3. North America Non Carbonated Soft Drinks Revenue (USD Million) by Product (2021-2032)
By Product
RTD
Sparkling & Flavored Water
By Distribution Channel
Hypermarkets/Supermarkets
Convenience Store
Online
Others
Chapter 10. Europe Non Carbonated Soft Drinks Analysis and Outlook
10.1. Europe Non Carbonated Soft Drinks Revenue (USD Million), by Segments (USD Million) (2021-2032)
10.1.1. Europe Non Carbonated Soft Drinks Revenue (USD Million) by Type (2021-2032)
10.1.2. Europe Non Carbonated Soft Drinks Revenue (USD Million) by Application (2021-2032)
10.1.3. Europe Non Carbonated Soft Drinks Revenue (USD Million) by Product (2021-2032)
By Product
RTD
Sparkling & Flavored Water
By Distribution Channel
Hypermarkets/Supermarkets
Convenience Store
Online
Others
Chapter 11. Asia Pacific Non Carbonated Soft Drinks Analysis and Outlook
11.1. Asia Pacific Non Carbonated Soft Drinks Revenue (USD Million), and Revenue (USD Million) by Segments (2021-2032)
11.1.1. Asia Pacific Non Carbonated Soft Drinks Revenue (USD Million) by Type (2021-2032)
11.1.2. Asia Pacific Non Carbonated Soft Drinks Revenue (USD Million) by Application (2021-2032)
11.1.3. Asia Pacific Non Carbonated Soft Drinks Revenue (USD Million) by Product (2021-2032)
By Product
RTD
Sparkling & Flavored Water
By Distribution Channel
Hypermarkets/Supermarkets
Convenience Store
Online
Others
Chapter 12. South America Non Carbonated Soft Drinks Analysis and Outlook
12.1. South America Non Carbonated Soft Drinks Revenue (USD Million), by Segments (2021-2032)
12.1.1. South America Non Carbonated Soft Drinks Revenue (USD Million) by Type (2021-2032)
12.1.2. South America Non Carbonated Soft Drinks Revenue (USD Million) by Application (2021-2032)
12.1.3. South America Non Carbonated Soft Drinks Revenue (USD Million) by Product (2021-2032)
By Product
RTD
Sparkling & Flavored Water
By Distribution Channel
Hypermarkets/Supermarkets
Convenience Store
Online
Others
Chapter 13. Middle East and Africa Non Carbonated Soft Drinks Analysis and Outlook
13.1. Middle East and Africa Non Carbonated Soft Drinks Revenue (USD Million), by Segments (2021-2032)
13.1.1. Middle East and Africa Non Carbonated Soft Drinks Revenue (USD Million) by Type (2021-2032)
13.1.2. Middle East and Africa Non Carbonated Soft Drinks Revenue (USD Million) by Application (2021-2032)
13.1.3. Middle East and Africa Non Carbonated Soft Drinks Revenue (USD Million) by Product (2021-2032)
By Product
RTD
Sparkling & Flavored Water
By Distribution Channel
Hypermarkets/Supermarkets
Convenience Store
Online
Others
Chapter 14. Non Carbonated Soft Drinks Company Profiles
14.1 Business Overview
14.2 Product Profiles
14.3 SWOT Profiles
14.5 Recent Developments
14.6 Financial Profile
List of Companies
Danone SA
DyDo Group Holdings Inc
Hector Beverages Pvt. Ltd
Hint Inc
ITO EN Ltd
Keurig Dr Pepper Inc
Monster Energy Co.
National Beverage Corp
Nestle SA
Ocean Spray Cranberries Inc
PepsiCo Inc
Red Bull GmbH
Spindrift Beverage Co. Inc
Suntory Holdings Ltd
The Coca-Cola Company
The Hain Celestial Group Inc
The Kraft Heinz Company
15. Methodology and Data Sources
15.1 Customization Offerings
15.2 Subscription Services
15.3 Related Reports
15.4 Publisher Expertise
LIST OF TABLES
Table 1 Market Segmentation Analysis
Table 2 Global Non Carbonated Soft Drinks Market Share of Leading Companies, 2023
Table 3 Product Offerings of Leading Companies
Table 4 Low Growth Scenario Forecasts
Table 5 Reference Case Growth Scenario
Table 6 High Growth Case Scenario
Table 7 Global Non Carbonated Soft Drinks Revenue (USD Million) And CAGR (%) By Type (2021-2032)
Table 8 Global Non Carbonated Soft Drinks Revenue (USD Million) And CAGR (%) By Application (2021-2032)
Table 9 Global Non Carbonated Soft Drinks Revenue (USD Million) And CAGR (%) By Product (2021-2032)
Table 10 Global Non Carbonated Soft Drinks Market Revenue (USD Million) By Regions (2021-2032)
Table 11 Global Non Carbonated Soft Drinks Market Share (%) By Regions (2021-2032)
Table 12 North America Non Carbonated Soft Drinks Revenue (USD Million) By Country (2021-2032)
Table 13 Europe Non Carbonated Soft Drinks Revenue (USD Million) By Country (2021-2032)
Table 14 Asia Pacific Non Carbonated Soft Drinks Revenue (USD Million) By Country (2021-2032)
Table 15 South America Non Carbonated Soft Drinks Revenue (USD Million) By Country (2021-2032)
Table 16 Middle East and Africa Non Carbonated Soft Drinks Revenue (USD Million) By Region (2021-2032)
Table 17 North America Non Carbonated Soft Drinks Revenue (USD Million) By Type (2021-2032)
Table 18 North America Non Carbonated Soft Drinks Revenue (USD Million) By Application (2021-2032)
Table 19 North America Non Carbonated Soft Drinks Revenue (USD Million) By Product (2021-2032)
Table 20 Europe Non Carbonated Soft Drinks Revenue (USD Million) By Type (2021-2032)
Table 21 Europe Non Carbonated Soft Drinks Revenue (USD Million) By Application (2021-2032)
Table 22 Europe Non Carbonated Soft Drinks Revenue (USD Million) By Product (2021-2032)
Table 23 Asia Pacific Non Carbonated Soft Drinks Revenue (USD Million) By Type (2021-2032)
Table 24 Asia Pacific Non Carbonated Soft Drinks Revenue (USD Million) By Application (2021-2032)
Table 25 Asia Pacific Non Carbonated Soft Drinks Revenue (USD Million) By Product (2021-2032)
Table 26 South America Non Carbonated Soft Drinks Revenue (USD Million) By Type (2021-2032)
Table 27 South America Non Carbonated Soft Drinks Revenue (USD Million) By Application (2021-2032)
Table 28 South America Non Carbonated Soft Drinks Revenue (USD Million) By Product (2021-2032)
Table 29 Middle East and Africa Non Carbonated Soft Drinks Revenue (USD Million) By Type (2021-2032)
Table 30 Middle East and Africa Non Carbonated Soft Drinks Revenue (USD Million) By Application (2021-2032)
Table 31 Middle East and Africa Non Carbonated Soft Drinks Revenue (USD Million) By Product (2021-2032)
LIST OF FIGURES
Figure 1. Market Scope
Figure 2. Pricing Forecasts Per Unit, 2023- 2032
Figure 3. Porter’s Five Forces
Figure 4. Global Non Carbonated Soft Drinks Market Revenue (USD Million) By Regions (2021-2032)
Figure 5. Global Non Carbonated Soft Drinks Market Share (%) By Regions (2023)
Figure 6. North America Non Carbonated Soft Drinks Revenue (USD Million) By Country (2021-2032)
Figure 7. United States Non Carbonated Soft Drinks Revenue (USD Million) By Country (2021-2032)
Figure 8. Canada Non Carbonated Soft Drinks Revenue (USD Million) By Country (2021-2032)
Figure 9. Mexico Non Carbonated Soft Drinks Revenue (USD Million) By Country (2021-2032)
Figure 10. Europe Non Carbonated Soft Drinks Revenue (USD Million) By Country (2021-2032)
Figure 11. Germany Non Carbonated Soft Drinks Revenue (USD Million) By Country (2021-2032)
Figure 12. France Non Carbonated Soft Drinks Revenue (USD Million) By Country (2021-2032)
Figure 13. United Kingdom Non Carbonated Soft Drinks Revenue (USD Million) By Country (2021-2032)
Figure 14. Spain Non Carbonated Soft Drinks Revenue (USD Million) By Country (2021-2032)
Figure 15. Italy Non Carbonated Soft Drinks Revenue (USD Million) By Country (2021-2032)
Figure 16. Russia Non Carbonated Soft Drinks Revenue (USD Million) By Country (2021-2032)
Figure 17. Rest of Europe Non Carbonated Soft Drinks Revenue (USD Million) By Country (2021-2032)
Figure 11. Asia Pacific Non Carbonated Soft Drinks Revenue (USD Million) By Country (2021-2032)
Figure 12. China Non Carbonated Soft Drinks Revenue (USD Million) By Country (2021-2032)
Figure 13. Japan Non Carbonated Soft Drinks Revenue (USD Million) By Country (2021-2032)
Figure 14. India Non Carbonated Soft Drinks Revenue (USD Million) By Country (2021-2032)
Figure 15. South Korea Non Carbonated Soft Drinks Revenue (USD Million) By Country (2021-2032)
Figure 16. Australia Non Carbonated Soft Drinks Revenue (USD Million) By Country (2021-2032)
Figure 17. South East Asia Non Carbonated Soft Drinks Revenue (USD Million) By Country (2021-2032)
Figure 18. South America Non Carbonated Soft Drinks Revenue (USD Million) By Country (2021-2032)
Figure 19. Brazil Non Carbonated Soft Drinks Revenue (USD Million) By Country (2021-2032)
Figure 20. Argentina Non Carbonated Soft Drinks Revenue (USD Million) By Country (2021-2032)
Figure 21. Rest of Asia Pacific Non Carbonated Soft Drinks Revenue (USD Million) By Country (2021-2032)
Figure 22. Middle East and Africa Non Carbonated Soft Drinks Revenue (USD Million) By Region (2021-2032)
Figure 23. Saudi Arabia Non Carbonated Soft Drinks Revenue (USD Million) By Region (2021-2032)
Figure 24. The UAE Non Carbonated Soft Drinks Revenue (USD Million) By Region (2021-2032)
Figure 25. Rest of Middle East Non Carbonated Soft Drinks Revenue (USD Million) By Region (2021-2032)
Figure 26. South Africa Non Carbonated Soft Drinks Revenue (USD Million) By Region (2021-2032)
Figure 27. Africa Non Carbonated Soft Drinks Revenue (USD Million) By Region (2021-2032)
Figure 28. North America Non Carbonated Soft Drinks Revenue (USD Million) By Type (2021-2032)
Figure 29. North America Non Carbonated Soft Drinks Revenue (USD Million) By Application (2021-2032)
Figure 30. North America Non Carbonated Soft Drinks Revenue (USD Million) By Product (2021-2032)
Figure 31. Europe Non Carbonated Soft Drinks Revenue (USD Million) By Type (2021-2032)
Figure 32. Europe Non Carbonated Soft Drinks Revenue (USD Million) By Application (2021-2032)
Figure 33. Europe Non Carbonated Soft Drinks Revenue (USD Million) By Product (2021-2032)
Figure 34. Asia Pacific Non Carbonated Soft Drinks Revenue (USD Million) By Type (2021-2032)
Figure 35. Asia Pacific Non Carbonated Soft Drinks Revenue (USD Million) By Application (2021-2032)
Figure 36. Asia Pacific Non Carbonated Soft Drinks Revenue (USD Million) By Product (2021-2032)
Figure 37. South America Non Carbonated Soft Drinks Revenue (USD Million) By Type (2021-2032)
Figure 38. South America Non Carbonated Soft Drinks Revenue (USD Million) By Application (2021-2032)
Figure 39. South America Non Carbonated Soft Drinks Revenue (USD Million) By Product (2021-2032)
Figure 40. Middle East and Africa Non Carbonated Soft Drinks Revenue (USD Million) By Type (2021-2032)
Figure 41. Middle East and Africa Non Carbonated Soft Drinks Revenue (USD Million) By Application (2021-2032)
Figure 42. Middle East and Africa Non Carbonated Soft Drinks Revenue (USD Million) By Product (2021-2032)
By Product
RTD
Sparkling & Flavored Water
By Distribution Channel
Hypermarkets/Supermarkets
Convenience Store
Online
Others
Countries Analyzed
North America (US, Canada, Mexico)
Europe (Germany, UK, France, Spain, Italy, Russia, Rest of Europe)
Asia Pacific (China, India, Japan, South Korea, Australia, South East Asia, Rest of Asia)
South America (Brazil, Argentina, Rest of South America)
Middle East and Africa (Saudi Arabia, UAE, Rest of Middle East, South Africa, Egypt, Rest of Africa)
