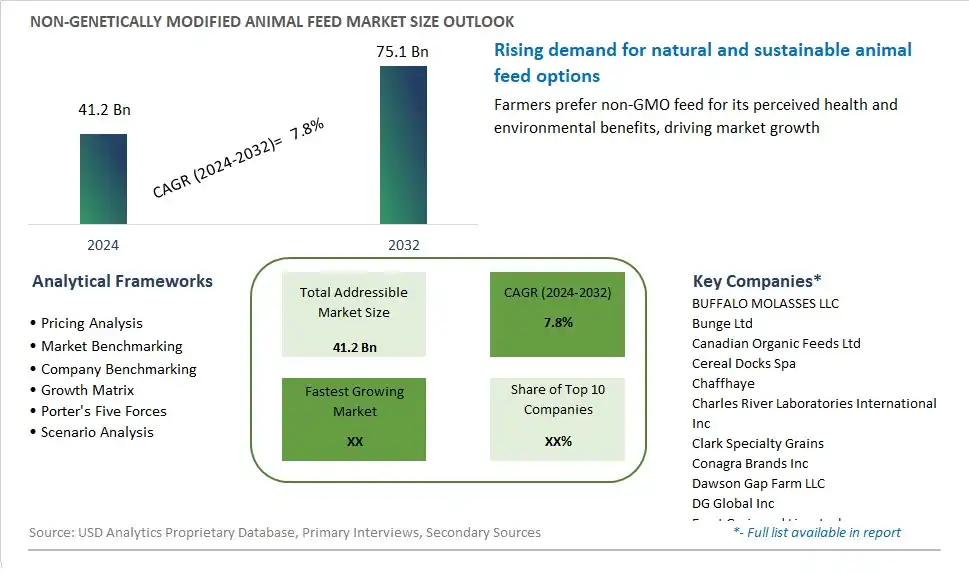
Global Non-Genetically Modified Animal Feed Market Size is valued at $41.2 Billion in 2024 and is forecast to register a growth rate (CAGR) of 7.8% to reach $75.1 Billion by 2032.
The global Non-Genetically Modified Animal Feed Market Comprehensive Study analyzes and forecasts the market size across 6 regions and 24 countries for diverse segments -By Product (Poultry, Swine, Ruminant, Aquaculture, Others), By Distribution Channel (Offline, Online)
An Introduction to Non-Genetically Modified Animal Feed Market
The Non-Genetically Modified (Non-GMO) Animal Feed Market focuses on the production and sale of animal feed made from non-GMO ingredients. This market caters to consumers and farmers seeking to avoid genetically modified organisms in their food supply. The market is driven by increasing demand for natural and organic products, rising awareness about the potential risks of GMOs, and growing consumer preference for transparency in food labeling. Additionally, advancements in non-GMO crop production and feed formulation support market growth.
Non Genetically Modified Animal Feed Competitive Landscape
The market report analyses the leading companies in the industry including BUFFALO MOLASSES LLC, Bunge Ltd, Canadian Organic Feeds Ltd, Cereal Docks Spa, Chaffhaye, Charles River Laboratories International Inc, Clark Specialty Grains, Conagra Brands Inc, Dawson Gap Farm LLC, DG Global Inc, Ernst Grain and Livestock, General Mills Inc, Givaudan SA, Hiland Naturals, Modesto Milling Inc, Nestle SA, The Kraft Heinz Co, and Others.
Non Genetically Modified Animal Feed Market Dynamics
Market Trend: Shift Towards Non-GMO Ingredients
The most prominent trend in the Non-Genetically Modified (Non-GMO) Animal Feed Market is the shift towards non-GMO ingredients. As consumers become more concerned about the potential health and environmental impacts of genetically modified organisms (GMOs), there is a growing demand for non-GMO feed options. This trend is driven by the desire for transparency and sustainability in the food supply chain, leading to an increased preference for non-GMO animal feed
Market Driver: Rising Consumer Demand for Non-GMO Animal Products
A major driver of the Non-GMO Animal Feed Market is the rising consumer demand for non-GMO animal products. As more consumers seek out meat, dairy, and eggs that are free from GMOs, livestock producers are under pressure to switch to non-GMO feed. This driver is pushing the animal agriculture industry to adopt non-GMO feed practices to meet consumer preferences and market demands
Market Opportunity: Development of Certified Non-GMO Feed Products
A significant opportunity in the Non-GMO Animal Feed Market lies in the development of certified non-GMO feed products. By obtaining certification from recognized non-GMO organizations, manufacturers can provide assurance to consumers and producers about the authenticity of their non-GMO claims. This certification can help build trust, attract more customers, and create a competitive advantage in the growing non-GMO market segment
Non-Genetically Modified (Non-GMO) Animal Feed Market Share Analysis: Product (Poultry, Swine, Ruminant, Aquaculture, Others)
The poultry segment is expected to be the fastest-growing in the Non-Genetically Modified (Non-GMO) Animal Feed Market by product to 2032. The demand for non-GMO poultry feed is driven by the increasing consumer preference for natural and sustainably produced poultry products. Non-GMO feed is perceived as safer and healthier for both animals and consumers, aligning with the growing trend of health and wellness. Additionally, advancements in feed formulation and the development of high-quality, non-GMO ingredients contribute to the segment's rapid growth. The expansion of the poultry industry and the increasing adoption of non-GMO practices in poultry farming support the growth of this segment.
Non-Genetically Modified (Non-GMO) Animal Feed Market Share Analysis: Distribution Channel (Offline, Online)
The online distribution channel is anticipated to be the fastest-growing segment in the Non-Genetically Modified (Non-GMO) Animal Feed Market by distribution channel to 2032. The convenience and accessibility of online shopping, combined with the growing preference for e-commerce, drive the rapid growth of this segment. Online platforms offer a wide variety of non-GMO animal feed products, detailed product descriptions, and customer reviews, making it easier for buyers to make informed purchasing decisions. The COVID-19 pandemic has further accelerated the shift towards online shopping, as customers seek contactless and convenient ways to purchase their preferred feed products. Subscription services and direct-to-consumer models also contribute to the segment's expansion, providing regular deliveries of non-GMO animal feed to customers.
Non Genetically Modified Animal Feed Market Segmentation
By Product
Poultry
Swine
Ruminant
Aquaculture
Others
By Distribution Channel
Offline
Online
Countries Analyzed
North America (US, Canada, Mexico)
Europe (Germany, UK, France, Spain, Italy, Russia, Rest of Europe)
Asia Pacific (China, India, Japan, South Korea, Australia, South East Asia, Rest of Asia)
South America (Brazil, Argentina, Rest of South America)
Middle East and Africa (Saudi Arabia, UAE, Rest of Middle East, South Africa, Egypt, Rest of Africa)
Non Genetically Modified Animal Feed Companies Profiled in the Study
BUFFALO MOLASSES LLC
Bunge Ltd
Canadian Organic Feeds Ltd
Cereal Docks Spa
Chaffhaye
Charles River Laboratories International Inc
Clark Specialty Grains
Conagra Brands Inc
Dawson Gap Farm LLC
DG Global Inc
Ernst Grain and Livestock
General Mills Inc
Givaudan SA
Hiland Naturals
Modesto Milling Inc
Nestle SA
The Kraft Heinz Co
*- List Not Exhaustive
Chapter 1. TABLE OF CONTENTS
Chapter 2. Introduction to Non Genetically Modified Animal Feed Market
2.1. Market Overview
2.2. Key Statistics and Report Highlights
2.3. Scope of the Comprehensive Study
2.3.1. Market Definition
2.3.2 Countries and Regions Covered
2.3.3 Research Objective
2.3.4 Units, Currency, and Conversions
2.3.5 Industry Value Chain
2.4. Key Market Segments
2.5. Key Companies
2.6. Study Period
Chapter 3. Strategic Analysis Review
3.1. Non Genetically Modified Animal Feed Pricing Analysis and Forecast
3.2. Porter’s Five Forces
3.3. Market Ecosystem
3.4. SWOT Analysis
3.5. Regulatory Scenario
3.3. Effects of Inflation, Russia-Ukraine War, moderating economic growth, and other macroeconomic factors
Chapter 4. Competitive Landscape
4.1. Market Share Analysis
4.1.1. Global Non Genetically Modified Animal Feed Market Share by Company, 2023
4.1.2. Product Offerings of Leading Non Genetically Modified Animal Feed Companies
4.2. Market Entropy
4.2.1. New Product Launches in the Industry
4.2.2. Mergers, Acquisitions, Joint ventures, and Partnerships
4.3. Key Strategies and Best Practices
Chapter 5. Global Market Projections: Best, Reference, and Low Case Scenarios
5.1. Growth Analysis- Case Scenario Definitions
5.2. Low Growth Case Scenario Forecasts
5.3. Reference Growth Case Scenario Forecasts
5.4. High Growth Case Scenario Forecasts
Chapter 6. Market Dynamics
6.1. Non Genetically Modified Animal Feed Market Drivers
6.2. Non Genetically Modified Animal Feed Market Challenges
6.6. Non Genetically Modified Animal Feed Market Opportunities
6.4. Non Genetically Modified Animal Feed Market Trends
Chapter 7. Global Non Genetically Modified Animal Feed Market Outlook Trends
7.1. Global Non Genetically Modified Animal Feed Revenue (USD Million) and CAGR (%) by Type (2021-2032)
7.2. Global Non Genetically Modified Animal Feed Revenue (USD Million) and CAGR (%) by Application (2021-2032)
7.3. Global Non Genetically Modified Animal Feed Revenue (USD Million) and CAGR (%) by Product (2021-2032)
By Product
Poultry
Swine
Ruminant
Aquaculture
Others
By Distribution Channel
Offline
Online
Chapter 8. Global Non Genetically Modified Animal Feed Regional Analysis and Outlook
8.1. Global Non Genetically Modified Animal Feed Revenue (USD Million) By Regions (2021- 2032)
8.2. North America Non Genetically Modified Animal Feed Revenue (USD Million) by Country (2021-2032)
8.2.1. United States Non Genetically Modified Animal Feed Regional Analysis and Outlook
8.2.2. Canada Non Genetically Modified Animal Feed Regional Analysis and Outlook
8.2.3. Mexico Non Genetically Modified Animal Feed Regional Analysis and Outlook
8.3. Europe Non Genetically Modified Animal Feed Revenue (USD Million), by Country (2021-2032)
8.3.1. Germany Non Genetically Modified Animal Feed Regional Analysis and Outlook
8.3.2. France Non Genetically Modified Animal Feed Regional Analysis and Outlook
8.3.3. United Kingdom Non Genetically Modified Animal Feed Regional Analysis and Outlook
8.3.4. Spain Non Genetically Modified Animal Feed Regional Analysis and Outlook
8.3.5. Italy Non Genetically Modified Animal Feed Regional Analysis and Outlook
8.3.6. Russia Non Genetically Modified Animal Feed Regional Analysis and Outlook
8.3.7. Rest of Europe Non Genetically Modified Animal Feed Regional Analysis and Outlook
8.4. Asia Pacific Non Genetically Modified Animal Feed Revenue (USD Million) by Country (2021-2032)
8.4.1. China Non Genetically Modified Animal Feed Regional Analysis and Outlook
8.4.2. Japan Non Genetically Modified Animal Feed Regional Analysis and Outlook
8.4.3. India Non Genetically Modified Animal Feed Regional Analysis and Outlook
8.4.4. South Korea Non Genetically Modified Animal Feed Regional Analysis and Outlook
8.4.5. Australia Non Genetically Modified Animal Feed Regional Analysis and Outlook
8.4.6. South East Asia Non Genetically Modified Animal Feed Regional Analysis and Outlook
8.4.7. Rest of Asia Pacific Non Genetically Modified Animal Feed Regional Analysis and Outlook
8.5. South America Non Genetically Modified Animal Feed Revenue (USD Million), by Country (2021-2032)
8.5.1. Brazil Non Genetically Modified Animal Feed Regional Analysis and Outlook
8.5.2. Argentina Non Genetically Modified Animal Feed Regional Analysis and Outlook
8.5.3. Rest of South America Non Genetically Modified Animal Feed Regional Analysis and Outlook
8.6. Middle East and Africa Non Genetically Modified Animal Feed Revenue (USD Million) by Country (2021-2032)
8.6.1. Middle East Non Genetically Modified Animal Feed Regional Analysis and Outlook
8.6.2. Africa Non Genetically Modified Animal Feed Regional Analysis and Outlook
Chapter 9. North America Non Genetically Modified Animal Feed Analysis and Outlook
9.1. North America Non Genetically Modified Animal Feed Revenue (USD Million) by Segments (2021-2032)
9.1.1. North America Non Genetically Modified Animal Feed Revenue (USD Million) by Type (2021-2032)
9.1.2. North America Non Genetically Modified Animal Feed Revenue (USD Million) by Application (2021-2032)
9.1.3. North America Non Genetically Modified Animal Feed Revenue (USD Million) by Product (2021-2032)
By Product
Poultry
Swine
Ruminant
Aquaculture
Others
By Distribution Channel
Offline
Online
Chapter 10. Europe Non Genetically Modified Animal Feed Analysis and Outlook
10.1. Europe Non Genetically Modified Animal Feed Revenue (USD Million), by Segments (USD Million) (2021-2032)
10.1.1. Europe Non Genetically Modified Animal Feed Revenue (USD Million) by Type (2021-2032)
10.1.2. Europe Non Genetically Modified Animal Feed Revenue (USD Million) by Application (2021-2032)
10.1.3. Europe Non Genetically Modified Animal Feed Revenue (USD Million) by Product (2021-2032)
By Product
Poultry
Swine
Ruminant
Aquaculture
Others
By Distribution Channel
Offline
Online
Chapter 11. Asia Pacific Non Genetically Modified Animal Feed Analysis and Outlook
11.1. Asia Pacific Non Genetically Modified Animal Feed Revenue (USD Million), and Revenue (USD Million) by Segments (2021-2032)
11.1.1. Asia Pacific Non Genetically Modified Animal Feed Revenue (USD Million) by Type (2021-2032)
11.1.2. Asia Pacific Non Genetically Modified Animal Feed Revenue (USD Million) by Application (2021-2032)
11.1.3. Asia Pacific Non Genetically Modified Animal Feed Revenue (USD Million) by Product (2021-2032)
By Product
Poultry
Swine
Ruminant
Aquaculture
Others
By Distribution Channel
Offline
Online
Chapter 12. South America Non Genetically Modified Animal Feed Analysis and Outlook
12.1. South America Non Genetically Modified Animal Feed Revenue (USD Million), by Segments (2021-2032)
12.1.1. South America Non Genetically Modified Animal Feed Revenue (USD Million) by Type (2021-2032)
12.1.2. South America Non Genetically Modified Animal Feed Revenue (USD Million) by Application (2021-2032)
12.1.3. South America Non Genetically Modified Animal Feed Revenue (USD Million) by Product (2021-2032)
By Product
Poultry
Swine
Ruminant
Aquaculture
Others
By Distribution Channel
Offline
Online
Chapter 13. Middle East and Africa Non Genetically Modified Animal Feed Analysis and Outlook
13.1. Middle East and Africa Non Genetically Modified Animal Feed Revenue (USD Million), by Segments (2021-2032)
13.1.1. Middle East and Africa Non Genetically Modified Animal Feed Revenue (USD Million) by Type (2021-2032)
13.1.2. Middle East and Africa Non Genetically Modified Animal Feed Revenue (USD Million) by Application (2021-2032)
13.1.3. Middle East and Africa Non Genetically Modified Animal Feed Revenue (USD Million) by Product (2021-2032)
By Product
Poultry
Swine
Ruminant
Aquaculture
Others
By Distribution Channel
Offline
Online
Chapter 14. Non Genetically Modified Animal Feed Company Profiles
14.1 Business Overview
14.2 Product Profiles
14.3 SWOT Profiles
14.5 Recent Developments
14.6 Financial Profile
List of Companies
BUFFALO MOLASSES LLC
Bunge Ltd
Canadian Organic Feeds Ltd
Cereal Docks Spa
Chaffhaye
Charles River Laboratories International Inc
Clark Specialty Grains
Conagra Brands Inc
Dawson Gap Farm LLC
DG Global Inc
Ernst Grain and Livestock
General Mills Inc
Givaudan SA
Hiland Naturals
Modesto Milling Inc
Nestle SA
The Kraft Heinz Co
15. Methodology and Data Sources
15.1 Customization Offerings
15.2 Subscription Services
15.3 Related Reports
15.4 Publisher Expertise
LIST OF TABLES
Table 1 Market Segmentation Analysis
Table 2 Global Non Genetically Modified Animal Feed Market Share of Leading Companies, 2023
Table 3 Product Offerings of Leading Companies
Table 4 Low Growth Scenario Forecasts
Table 5 Reference Case Growth Scenario
Table 6 High Growth Case Scenario
Table 7 Global Non Genetically Modified Animal Feed Revenue (USD Million) And CAGR (%) By Type (2021-2032)
Table 8 Global Non Genetically Modified Animal Feed Revenue (USD Million) And CAGR (%) By Application (2021-2032)
Table 9 Global Non Genetically Modified Animal Feed Revenue (USD Million) And CAGR (%) By Product (2021-2032)
Table 10 Global Non Genetically Modified Animal Feed Market Revenue (USD Million) By Regions (2021-2032)
Table 11 Global Non Genetically Modified Animal Feed Market Share (%) By Regions (2021-2032)
Table 12 North America Non Genetically Modified Animal Feed Revenue (USD Million) By Country (2021-2032)
Table 13 Europe Non Genetically Modified Animal Feed Revenue (USD Million) By Country (2021-2032)
Table 14 Asia Pacific Non Genetically Modified Animal Feed Revenue (USD Million) By Country (2021-2032)
Table 15 South America Non Genetically Modified Animal Feed Revenue (USD Million) By Country (2021-2032)
Table 16 Middle East and Africa Non Genetically Modified Animal Feed Revenue (USD Million) By Region (2021-2032)
Table 17 North America Non Genetically Modified Animal Feed Revenue (USD Million) By Type (2021-2032)
Table 18 North America Non Genetically Modified Animal Feed Revenue (USD Million) By Application (2021-2032)
Table 19 North America Non Genetically Modified Animal Feed Revenue (USD Million) By Product (2021-2032)
Table 20 Europe Non Genetically Modified Animal Feed Revenue (USD Million) By Type (2021-2032)
Table 21 Europe Non Genetically Modified Animal Feed Revenue (USD Million) By Application (2021-2032)
Table 22 Europe Non Genetically Modified Animal Feed Revenue (USD Million) By Product (2021-2032)
Table 23 Asia Pacific Non Genetically Modified Animal Feed Revenue (USD Million) By Type (2021-2032)
Table 24 Asia Pacific Non Genetically Modified Animal Feed Revenue (USD Million) By Application (2021-2032)
Table 25 Asia Pacific Non Genetically Modified Animal Feed Revenue (USD Million) By Product (2021-2032)
Table 26 South America Non Genetically Modified Animal Feed Revenue (USD Million) By Type (2021-2032)
Table 27 South America Non Genetically Modified Animal Feed Revenue (USD Million) By Application (2021-2032)
Table 28 South America Non Genetically Modified Animal Feed Revenue (USD Million) By Product (2021-2032)
Table 29 Middle East and Africa Non Genetically Modified Animal Feed Revenue (USD Million) By Type (2021-2032)
Table 30 Middle East and Africa Non Genetically Modified Animal Feed Revenue (USD Million) By Application (2021-2032)
Table 31 Middle East and Africa Non Genetically Modified Animal Feed Revenue (USD Million) By Product (2021-2032)
LIST OF FIGURES
Figure 1. Market Scope
Figure 2. Pricing Forecasts Per Unit, 2023- 2032
Figure 3. Porter’s Five Forces
Figure 4. Global Non Genetically Modified Animal Feed Market Revenue (USD Million) By Regions (2021-2032)
Figure 5. Global Non Genetically Modified Animal Feed Market Share (%) By Regions (2023)
Figure 6. North America Non Genetically Modified Animal Feed Revenue (USD Million) By Country (2021-2032)
Figure 7. United States Non Genetically Modified Animal Feed Revenue (USD Million) By Country (2021-2032)
Figure 8. Canada Non Genetically Modified Animal Feed Revenue (USD Million) By Country (2021-2032)
Figure 9. Mexico Non Genetically Modified Animal Feed Revenue (USD Million) By Country (2021-2032)
Figure 10. Europe Non Genetically Modified Animal Feed Revenue (USD Million) By Country (2021-2032)
Figure 11. Germany Non Genetically Modified Animal Feed Revenue (USD Million) By Country (2021-2032)
Figure 12. France Non Genetically Modified Animal Feed Revenue (USD Million) By Country (2021-2032)
Figure 13. United Kingdom Non Genetically Modified Animal Feed Revenue (USD Million) By Country (2021-2032)
Figure 14. Spain Non Genetically Modified Animal Feed Revenue (USD Million) By Country (2021-2032)
Figure 15. Italy Non Genetically Modified Animal Feed Revenue (USD Million) By Country (2021-2032)
Figure 16. Russia Non Genetically Modified Animal Feed Revenue (USD Million) By Country (2021-2032)
Figure 17. Rest of Europe Non Genetically Modified Animal Feed Revenue (USD Million) By Country (2021-2032)
Figure 11. Asia Pacific Non Genetically Modified Animal Feed Revenue (USD Million) By Country (2021-2032)
Figure 12. China Non Genetically Modified Animal Feed Revenue (USD Million) By Country (2021-2032)
Figure 13. Japan Non Genetically Modified Animal Feed Revenue (USD Million) By Country (2021-2032)
Figure 14. India Non Genetically Modified Animal Feed Revenue (USD Million) By Country (2021-2032)
Figure 15. South Korea Non Genetically Modified Animal Feed Revenue (USD Million) By Country (2021-2032)
Figure 16. Australia Non Genetically Modified Animal Feed Revenue (USD Million) By Country (2021-2032)
Figure 17. South East Asia Non Genetically Modified Animal Feed Revenue (USD Million) By Country (2021-2032)
Figure 18. South America Non Genetically Modified Animal Feed Revenue (USD Million) By Country (2021-2032)
Figure 19. Brazil Non Genetically Modified Animal Feed Revenue (USD Million) By Country (2021-2032)
Figure 20. Argentina Non Genetically Modified Animal Feed Revenue (USD Million) By Country (2021-2032)
Figure 21. Rest of Asia Pacific Non Genetically Modified Animal Feed Revenue (USD Million) By Country (2021-2032)
Figure 22. Middle East and Africa Non Genetically Modified Animal Feed Revenue (USD Million) By Region (2021-2032)
Figure 23. Saudi Arabia Non Genetically Modified Animal Feed Revenue (USD Million) By Region (2021-2032)
Figure 24. The UAE Non Genetically Modified Animal Feed Revenue (USD Million) By Region (2021-2032)
Figure 25. Rest of Middle East Non Genetically Modified Animal Feed Revenue (USD Million) By Region (2021-2032)
Figure 26. South Africa Non Genetically Modified Animal Feed Revenue (USD Million) By Region (2021-2032)
Figure 27. Africa Non Genetically Modified Animal Feed Revenue (USD Million) By Region (2021-2032)
Figure 28. North America Non Genetically Modified Animal Feed Revenue (USD Million) By Type (2021-2032)
Figure 29. North America Non Genetically Modified Animal Feed Revenue (USD Million) By Application (2021-2032)
Figure 30. North America Non Genetically Modified Animal Feed Revenue (USD Million) By Product (2021-2032)
Figure 31. Europe Non Genetically Modified Animal Feed Revenue (USD Million) By Type (2021-2032)
Figure 32. Europe Non Genetically Modified Animal Feed Revenue (USD Million) By Application (2021-2032)
Figure 33. Europe Non Genetically Modified Animal Feed Revenue (USD Million) By Product (2021-2032)
Figure 34. Asia Pacific Non Genetically Modified Animal Feed Revenue (USD Million) By Type (2021-2032)
Figure 35. Asia Pacific Non Genetically Modified Animal Feed Revenue (USD Million) By Application (2021-2032)
Figure 36. Asia Pacific Non Genetically Modified Animal Feed Revenue (USD Million) By Product (2021-2032)
Figure 37. South America Non Genetically Modified Animal Feed Revenue (USD Million) By Type (2021-2032)
Figure 38. South America Non Genetically Modified Animal Feed Revenue (USD Million) By Application (2021-2032)
Figure 39. South America Non Genetically Modified Animal Feed Revenue (USD Million) By Product (2021-2032)
Figure 40. Middle East and Africa Non Genetically Modified Animal Feed Revenue (USD Million) By Type (2021-2032)
Figure 41. Middle East and Africa Non Genetically Modified Animal Feed Revenue (USD Million) By Application (2021-2032)
Figure 42. Middle East and Africa Non Genetically Modified Animal Feed Revenue (USD Million) By Product (2021-2032)
By Product
Poultry
Swine
Ruminant
Aquaculture
Others
By Distribution Channel
Offline
Online
Countries Analyzed
North America (US, Canada, Mexico)
Europe (Germany, UK, France, Spain, Italy, Russia, Rest of Europe)
Asia Pacific (China, India, Japan, South Korea, Australia, South East Asia, Rest of Asia)
South America (Brazil, Argentina, Rest of South America)
Middle East and Africa (Saudi Arabia, UAE, Rest of Middle East, South Africa, Egypt, Rest of Africa)
