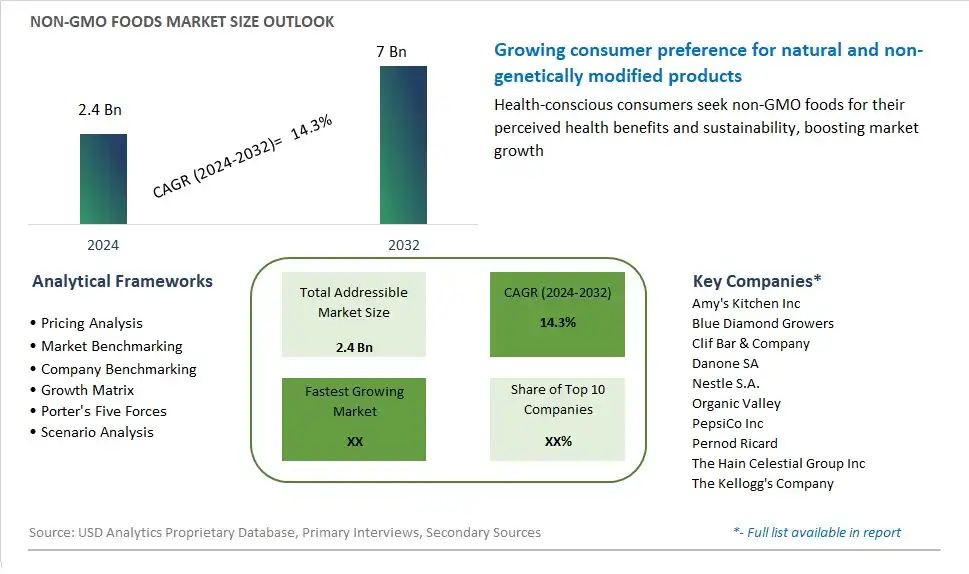
Global Non-GMO Foods Market Size is valued at $2.4 Billion in 2024 and is forecast to register a growth rate (CAGR) of 14.3% to reach $7 Billion by 2032.
The global Non-GMO Foods Market Comprehensive Study analyzes and forecasts the market size across 6 regions and 24 countries for diverse segments -By Product (Beverage, -Non-Alcoholic Beverages, -Alcoholic Beverages, Food, -Dairy Products, -Baby Foods and Infant Formula Products, -Bakery Products, -Confectionary Products, -Meat and Poultry Products, -Cereals and Grains, Others), By Distribution Channel (Supermarkets/Hypermarkets, Convenience Stores, Online Retail Stores, Others)
An Introduction to Non-GMO Foods Market
The Non-GMO Foods Market involves the production and sale of food products made without genetically modified organisms. This market caters to consumers seeking natural and organic foods. The market is driven by increasing consumer awareness about the potential health and environmental impacts of GMOs, rising demand for organic and natural products, and growing preference for clean label foods. Additionally, regulatory support and advancements in non-GMO crop production support market growth.
Non GMO Foods Competitive Landscape
The market report analyses the leading companies in the industry including Amy's Kitchen Inc, Blue Diamond Growers, Clif Bar & Company, Danone SA, Nestle S.A., Organic Valley, PepsiCo Inc, Pernod Ricard, The Hain Celestial Group Inc, The Kellogg's Company, and Others.
Non GMO Foods Market Dynamics
Market Trend: Growing Consumer Demand for Natural and Organic Products
The most prominent trend in the Non-GMO Foods Market is the growing consumer demand for natural and organic products. As consumers become more health-conscious and environmentally aware, there is a rising preference for foods that are free from genetically modified organisms (GMOs). This trend is driven by the desire for transparency in food production, concerns about the potential health risks of GMOs, and the environmental impact of GMO farming practices
Market Driver: Regulatory Support and Certification Programs
A major driver of the Non-GMO Foods Market is the increasing regulatory support and the establishment of certification programs. Governments and independent organizations are implementing stricter regulations and certification standards for non-GMO foods, providing consumers with assurance about the authenticity of their purchases. These certifications help build consumer trust and drive demand for non-GMO products, encouraging more producers to adopt non-GMO practices
Market Opportunity: Expansion of Non-GMO Product Lines
A significant opportunity in the Non-GMO Foods Market lies in the expansion of non-GMO product lines. Companies can innovate by developing a wider variety of non-GMO foods, including snacks, beverages, and convenience foods, to cater to diverse consumer preferences. By offering more options, businesses can attract a broader audience and strengthen their market position in the growing non-GMO segment
Non-GMO Foods Market Share Analysis: Product (Beverage, Non-Alcoholic Beverages, Alcoholic Beverages, Food, Dairy Products, Baby Foods and Infant Formula Products, Bakery Products, Confectionery Products, Meat and Poultry Products, Cereals and Grains, Others)
The baby foods and infant formula products segment is expected to be the fastest-growing in the Non-GMO Foods Market by product to 2032. The demand for non-GMO baby foods and infant formula products is driven by the increasing awareness of the potential health risks associated with genetically modified ingredients and the growing preference for natural and organic products. Parents are increasingly seeking safe and nutritious options for their infants, making non-GMO products a preferred choice. Additionally, advancements in food formulation and the development of high-quality, non-GMO ingredients contribute to the segment's rapid growth. The expansion of product offerings and the increasing availability of non-GMO baby foods and infant formula products in various retail channels support the growth of this segment.
Non-GMO Foods Market Share Analysis: Distribution Channel (Supermarkets/Hypermarkets, Convenience Stores, Online Retail Stores, Others)
The online retail stores segment is anticipated to be the fastest-growing in the Non-GMO Foods Market by distribution channel to 2032. The convenience and accessibility of online shopping, combined with the growing consumer preference for e-commerce, drive the rapid growth of this segment. Online platforms offer a wide variety of non-GMO food products, detailed product descriptions, and customer reviews, making it easier for consumers to make informed purchasing decisions. The COVID-19 pandemic has further accelerated the shift towards online shopping, as consumers seek contactless and convenient ways to purchase their favorite non-GMO products. Subscription services and direct-to-consumer models also contribute to the segment's expansion, providing consumers with regular deliveries of their preferred non-GMO foods.
Non GMO Foods Market Segmentation
By Product
Beverage
-Non-Alcoholic Beverages
-Alcoholic Beverages
Food
-Dairy Products
-Baby Foods and Infant Formula Products
-Bakery Products
-Confectionary Products
-Meat and Poultry Products
-Cereals and Grains
Others
By Distribution Channel
Supermarkets/Hypermarkets
Convenience Stores
Online Retail Stores
Others
Countries Analyzed
North America (US, Canada, Mexico)
Europe (Germany, UK, France, Spain, Italy, Russia, Rest of Europe)
Asia Pacific (China, India, Japan, South Korea, Australia, South East Asia, Rest of Asia)
South America (Brazil, Argentina, Rest of South America)
Middle East and Africa (Saudi Arabia, UAE, Rest of Middle East, South Africa, Egypt, Rest of Africa)
Non GMO Foods Companies Profiled in the Study
Amy's Kitchen Inc
Blue Diamond Growers
Clif Bar & Company
Danone SA
Nestle S.A.
Organic Valley
PepsiCo Inc
Pernod Ricard
The Hain Celestial Group Inc
The Kellogg's Company
*- List Not Exhaustive
Chapter 1. TABLE OF CONTENTS
Chapter 2. Introduction to Non GMO Foods Market
2.1. Market Overview
2.2. Key Statistics and Report Highlights
2.3. Scope of the Comprehensive Study
2.3.1. Market Definition
2.3.2 Countries and Regions Covered
2.3.3 Research Objective
2.3.4 Units, Currency, and Conversions
2.3.5 Industry Value Chain
2.4. Key Market Segments
2.5. Key Companies
2.6. Study Period
Chapter 3. Strategic Analysis Review
3.1. Non GMO Foods Pricing Analysis and Forecast
3.2. Porter’s Five Forces
3.3. Market Ecosystem
3.4. SWOT Analysis
3.5. Regulatory Scenario
3.3. Effects of Inflation, Russia-Ukraine War, moderating economic growth, and other macroeconomic factors
Chapter 4. Competitive Landscape
4.1. Market Share Analysis
4.1.1. Global Non GMO Foods Market Share by Company, 2023
4.1.2. Product Offerings of Leading Non GMO Foods Companies
4.2. Market Entropy
4.2.1. New Product Launches in the Industry
4.2.2. Mergers, Acquisitions, Joint ventures, and Partnerships
4.3. Key Strategies and Best Practices
Chapter 5. Global Market Projections: Best, Reference, and Low Case Scenarios
5.1. Growth Analysis- Case Scenario Definitions
5.2. Low Growth Case Scenario Forecasts
5.3. Reference Growth Case Scenario Forecasts
5.4. High Growth Case Scenario Forecasts
Chapter 6. Market Dynamics
6.1. Non GMO Foods Market Drivers
6.2. Non GMO Foods Market Challenges
6.6. Non GMO Foods Market Opportunities
6.4. Non GMO Foods Market Trends
Chapter 7. Global Non GMO Foods Market Outlook Trends
7.1. Global Non GMO Foods Revenue (USD Million) and CAGR (%) by Type (2021-2032)
7.2. Global Non GMO Foods Revenue (USD Million) and CAGR (%) by Application (2021-2032)
7.3. Global Non GMO Foods Revenue (USD Million) and CAGR (%) by Product (2021-2032)
By Product
Beverage
-Non-Alcoholic Beverages
-Alcoholic Beverages
Food
-Dairy Products
-Baby Foods and Infant Formula Products
-Bakery Products
-Confectionary Products
-Meat and Poultry Products
-Cereals and Grains
Others
By Distribution Channel
Supermarkets/Hypermarkets
Convenience Stores
Online Retail Stores
Others
Chapter 8. Global Non GMO Foods Regional Analysis and Outlook
8.1. Global Non GMO Foods Revenue (USD Million) By Regions (2021- 2032)
8.2. North America Non GMO Foods Revenue (USD Million) by Country (2021-2032)
8.2.1. United States Non GMO Foods Regional Analysis and Outlook
8.2.2. Canada Non GMO Foods Regional Analysis and Outlook
8.2.3. Mexico Non GMO Foods Regional Analysis and Outlook
8.3. Europe Non GMO Foods Revenue (USD Million), by Country (2021-2032)
8.3.1. Germany Non GMO Foods Regional Analysis and Outlook
8.3.2. France Non GMO Foods Regional Analysis and Outlook
8.3.3. United Kingdom Non GMO Foods Regional Analysis and Outlook
8.3.4. Spain Non GMO Foods Regional Analysis and Outlook
8.3.5. Italy Non GMO Foods Regional Analysis and Outlook
8.3.6. Russia Non GMO Foods Regional Analysis and Outlook
8.3.7. Rest of Europe Non GMO Foods Regional Analysis and Outlook
8.4. Asia Pacific Non GMO Foods Revenue (USD Million) by Country (2021-2032)
8.4.1. China Non GMO Foods Regional Analysis and Outlook
8.4.2. Japan Non GMO Foods Regional Analysis and Outlook
8.4.3. India Non GMO Foods Regional Analysis and Outlook
8.4.4. South Korea Non GMO Foods Regional Analysis and Outlook
8.4.5. Australia Non GMO Foods Regional Analysis and Outlook
8.4.6. South East Asia Non GMO Foods Regional Analysis and Outlook
8.4.7. Rest of Asia Pacific Non GMO Foods Regional Analysis and Outlook
8.5. South America Non GMO Foods Revenue (USD Million), by Country (2021-2032)
8.5.1. Brazil Non GMO Foods Regional Analysis and Outlook
8.5.2. Argentina Non GMO Foods Regional Analysis and Outlook
8.5.3. Rest of South America Non GMO Foods Regional Analysis and Outlook
8.6. Middle East and Africa Non GMO Foods Revenue (USD Million) by Country (2021-2032)
8.6.1. Middle East Non GMO Foods Regional Analysis and Outlook
8.6.2. Africa Non GMO Foods Regional Analysis and Outlook
Chapter 9. North America Non GMO Foods Analysis and Outlook
9.1. North America Non GMO Foods Revenue (USD Million) by Segments (2021-2032)
9.1.1. North America Non GMO Foods Revenue (USD Million) by Type (2021-2032)
9.1.2. North America Non GMO Foods Revenue (USD Million) by Application (2021-2032)
9.1.3. North America Non GMO Foods Revenue (USD Million) by Product (2021-2032)
By Product
Beverage
-Non-Alcoholic Beverages
-Alcoholic Beverages
Food
-Dairy Products
-Baby Foods and Infant Formula Products
-Bakery Products
-Confectionary Products
-Meat and Poultry Products
-Cereals and Grains
Others
By Distribution Channel
Supermarkets/Hypermarkets
Convenience Stores
Online Retail Stores
Others
Chapter 10. Europe Non GMO Foods Analysis and Outlook
10.1. Europe Non GMO Foods Revenue (USD Million), by Segments (USD Million) (2021-2032)
10.1.1. Europe Non GMO Foods Revenue (USD Million) by Type (2021-2032)
10.1.2. Europe Non GMO Foods Revenue (USD Million) by Application (2021-2032)
10.1.3. Europe Non GMO Foods Revenue (USD Million) by Product (2021-2032)
By Product
Beverage
-Non-Alcoholic Beverages
-Alcoholic Beverages
Food
-Dairy Products
-Baby Foods and Infant Formula Products
-Bakery Products
-Confectionary Products
-Meat and Poultry Products
-Cereals and Grains
Others
By Distribution Channel
Supermarkets/Hypermarkets
Convenience Stores
Online Retail Stores
Others
Chapter 11. Asia Pacific Non GMO Foods Analysis and Outlook
11.1. Asia Pacific Non GMO Foods Revenue (USD Million), and Revenue (USD Million) by Segments (2021-2032)
11.1.1. Asia Pacific Non GMO Foods Revenue (USD Million) by Type (2021-2032)
11.1.2. Asia Pacific Non GMO Foods Revenue (USD Million) by Application (2021-2032)
11.1.3. Asia Pacific Non GMO Foods Revenue (USD Million) by Product (2021-2032)
By Product
Beverage
-Non-Alcoholic Beverages
-Alcoholic Beverages
Food
-Dairy Products
-Baby Foods and Infant Formula Products
-Bakery Products
-Confectionary Products
-Meat and Poultry Products
-Cereals and Grains
Others
By Distribution Channel
Supermarkets/Hypermarkets
Convenience Stores
Online Retail Stores
Others
Chapter 12. South America Non GMO Foods Analysis and Outlook
12.1. South America Non GMO Foods Revenue (USD Million), by Segments (2021-2032)
12.1.1. South America Non GMO Foods Revenue (USD Million) by Type (2021-2032)
12.1.2. South America Non GMO Foods Revenue (USD Million) by Application (2021-2032)
12.1.3. South America Non GMO Foods Revenue (USD Million) by Product (2021-2032)
By Product
Beverage
-Non-Alcoholic Beverages
-Alcoholic Beverages
Food
-Dairy Products
-Baby Foods and Infant Formula Products
-Bakery Products
-Confectionary Products
-Meat and Poultry Products
-Cereals and Grains
Others
By Distribution Channel
Supermarkets/Hypermarkets
Convenience Stores
Online Retail Stores
Others
Chapter 13. Middle East and Africa Non GMO Foods Analysis and Outlook
13.1. Middle East and Africa Non GMO Foods Revenue (USD Million), by Segments (2021-2032)
13.1.1. Middle East and Africa Non GMO Foods Revenue (USD Million) by Type (2021-2032)
13.1.2. Middle East and Africa Non GMO Foods Revenue (USD Million) by Application (2021-2032)
13.1.3. Middle East and Africa Non GMO Foods Revenue (USD Million) by Product (2021-2032)
By Product
Beverage
-Non-Alcoholic Beverages
-Alcoholic Beverages
Food
-Dairy Products
-Baby Foods and Infant Formula Products
-Bakery Products
-Confectionary Products
-Meat and Poultry Products
-Cereals and Grains
Others
By Distribution Channel
Supermarkets/Hypermarkets
Convenience Stores
Online Retail Stores
Others
Chapter 14. Non GMO Foods Company Profiles
14.1 Business Overview
14.2 Product Profiles
14.3 SWOT Profiles
14.5 Recent Developments
14.6 Financial Profile
List of Companies
Amy's Kitchen Inc
Blue Diamond Growers
Clif Bar & Company
Danone SA
Nestle S.A.
Organic Valley
PepsiCo Inc
Pernod Ricard
The Hain Celestial Group Inc
The Kellogg's Company
15. Methodology and Data Sources
15.1 Customization Offerings
15.2 Subscription Services
15.3 Related Reports
15.4 Publisher Expertise
LIST OF TABLES
Table 1 Market Segmentation Analysis
Table 2 Global Non GMO Foods Market Share of Leading Companies, 2023
Table 3 Product Offerings of Leading Companies
Table 4 Low Growth Scenario Forecasts
Table 5 Reference Case Growth Scenario
Table 6 High Growth Case Scenario
Table 7 Global Non GMO Foods Revenue (USD Million) And CAGR (%) By Type (2021-2032)
Table 8 Global Non GMO Foods Revenue (USD Million) And CAGR (%) By Application (2021-2032)
Table 9 Global Non GMO Foods Revenue (USD Million) And CAGR (%) By Product (2021-2032)
Table 10 Global Non GMO Foods Market Revenue (USD Million) By Regions (2021-2032)
Table 11 Global Non GMO Foods Market Share (%) By Regions (2021-2032)
Table 12 North America Non GMO Foods Revenue (USD Million) By Country (2021-2032)
Table 13 Europe Non GMO Foods Revenue (USD Million) By Country (2021-2032)
Table 14 Asia Pacific Non GMO Foods Revenue (USD Million) By Country (2021-2032)
Table 15 South America Non GMO Foods Revenue (USD Million) By Country (2021-2032)
Table 16 Middle East and Africa Non GMO Foods Revenue (USD Million) By Region (2021-2032)
Table 17 North America Non GMO Foods Revenue (USD Million) By Type (2021-2032)
Table 18 North America Non GMO Foods Revenue (USD Million) By Application (2021-2032)
Table 19 North America Non GMO Foods Revenue (USD Million) By Product (2021-2032)
Table 20 Europe Non GMO Foods Revenue (USD Million) By Type (2021-2032)
Table 21 Europe Non GMO Foods Revenue (USD Million) By Application (2021-2032)
Table 22 Europe Non GMO Foods Revenue (USD Million) By Product (2021-2032)
Table 23 Asia Pacific Non GMO Foods Revenue (USD Million) By Type (2021-2032)
Table 24 Asia Pacific Non GMO Foods Revenue (USD Million) By Application (2021-2032)
Table 25 Asia Pacific Non GMO Foods Revenue (USD Million) By Product (2021-2032)
Table 26 South America Non GMO Foods Revenue (USD Million) By Type (2021-2032)
Table 27 South America Non GMO Foods Revenue (USD Million) By Application (2021-2032)
Table 28 South America Non GMO Foods Revenue (USD Million) By Product (2021-2032)
Table 29 Middle East and Africa Non GMO Foods Revenue (USD Million) By Type (2021-2032)
Table 30 Middle East and Africa Non GMO Foods Revenue (USD Million) By Application (2021-2032)
Table 31 Middle East and Africa Non GMO Foods Revenue (USD Million) By Product (2021-2032)
LIST OF FIGURES
Figure 1. Market Scope
Figure 2. Pricing Forecasts Per Unit, 2023- 2032
Figure 3. Porter’s Five Forces
Figure 4. Global Non GMO Foods Market Revenue (USD Million) By Regions (2021-2032)
Figure 5. Global Non GMO Foods Market Share (%) By Regions (2023)
Figure 6. North America Non GMO Foods Revenue (USD Million) By Country (2021-2032)
Figure 7. United States Non GMO Foods Revenue (USD Million) By Country (2021-2032)
Figure 8. Canada Non GMO Foods Revenue (USD Million) By Country (2021-2032)
Figure 9. Mexico Non GMO Foods Revenue (USD Million) By Country (2021-2032)
Figure 10. Europe Non GMO Foods Revenue (USD Million) By Country (2021-2032)
Figure 11. Germany Non GMO Foods Revenue (USD Million) By Country (2021-2032)
Figure 12. France Non GMO Foods Revenue (USD Million) By Country (2021-2032)
Figure 13. United Kingdom Non GMO Foods Revenue (USD Million) By Country (2021-2032)
Figure 14. Spain Non GMO Foods Revenue (USD Million) By Country (2021-2032)
Figure 15. Italy Non GMO Foods Revenue (USD Million) By Country (2021-2032)
Figure 16. Russia Non GMO Foods Revenue (USD Million) By Country (2021-2032)
Figure 17. Rest of Europe Non GMO Foods Revenue (USD Million) By Country (2021-2032)
Figure 11. Asia Pacific Non GMO Foods Revenue (USD Million) By Country (2021-2032)
Figure 12. China Non GMO Foods Revenue (USD Million) By Country (2021-2032)
Figure 13. Japan Non GMO Foods Revenue (USD Million) By Country (2021-2032)
Figure 14. India Non GMO Foods Revenue (USD Million) By Country (2021-2032)
Figure 15. South Korea Non GMO Foods Revenue (USD Million) By Country (2021-2032)
Figure 16. Australia Non GMO Foods Revenue (USD Million) By Country (2021-2032)
Figure 17. South East Asia Non GMO Foods Revenue (USD Million) By Country (2021-2032)
Figure 18. South America Non GMO Foods Revenue (USD Million) By Country (2021-2032)
Figure 19. Brazil Non GMO Foods Revenue (USD Million) By Country (2021-2032)
Figure 20. Argentina Non GMO Foods Revenue (USD Million) By Country (2021-2032)
Figure 21. Rest of Asia Pacific Non GMO Foods Revenue (USD Million) By Country (2021-2032)
Figure 22. Middle East and Africa Non GMO Foods Revenue (USD Million) By Region (2021-2032)
Figure 23. Saudi Arabia Non GMO Foods Revenue (USD Million) By Region (2021-2032)
Figure 24. The UAE Non GMO Foods Revenue (USD Million) By Region (2021-2032)
Figure 25. Rest of Middle East Non GMO Foods Revenue (USD Million) By Region (2021-2032)
Figure 26. South Africa Non GMO Foods Revenue (USD Million) By Region (2021-2032)
Figure 27. Africa Non GMO Foods Revenue (USD Million) By Region (2021-2032)
Figure 28. North America Non GMO Foods Revenue (USD Million) By Type (2021-2032)
Figure 29. North America Non GMO Foods Revenue (USD Million) By Application (2021-2032)
Figure 30. North America Non GMO Foods Revenue (USD Million) By Product (2021-2032)
Figure 31. Europe Non GMO Foods Revenue (USD Million) By Type (2021-2032)
Figure 32. Europe Non GMO Foods Revenue (USD Million) By Application (2021-2032)
Figure 33. Europe Non GMO Foods Revenue (USD Million) By Product (2021-2032)
Figure 34. Asia Pacific Non GMO Foods Revenue (USD Million) By Type (2021-2032)
Figure 35. Asia Pacific Non GMO Foods Revenue (USD Million) By Application (2021-2032)
Figure 36. Asia Pacific Non GMO Foods Revenue (USD Million) By Product (2021-2032)
Figure 37. South America Non GMO Foods Revenue (USD Million) By Type (2021-2032)
Figure 38. South America Non GMO Foods Revenue (USD Million) By Application (2021-2032)
Figure 39. South America Non GMO Foods Revenue (USD Million) By Product (2021-2032)
Figure 40. Middle East and Africa Non GMO Foods Revenue (USD Million) By Type (2021-2032)
Figure 41. Middle East and Africa Non GMO Foods Revenue (USD Million) By Application (2021-2032)
Figure 42. Middle East and Africa Non GMO Foods Revenue (USD Million) By Product (2021-2032)
By Product
Beverage
-Non-Alcoholic Beverages
-Alcoholic Beverages
Food
-Dairy Products
-Baby Foods and Infant Formula Products
-Bakery Products
-Confectionary Products
-Meat and Poultry Products
-Cereals and Grains
Others
By Distribution Channel
Supermarkets/Hypermarkets
Convenience Stores
Online Retail Stores
Others
Countries Analyzed
North America (US, Canada, Mexico)
Europe (Germany, UK, France, Spain, Italy, Russia, Rest of Europe)
Asia Pacific (China, India, Japan, South Korea, Australia, South East Asia, Rest of Asia)
South America (Brazil, Argentina, Rest of South America)
Middle East and Africa (Saudi Arabia, UAE, Rest of Middle East, South Africa, Egypt, Rest of Africa)
