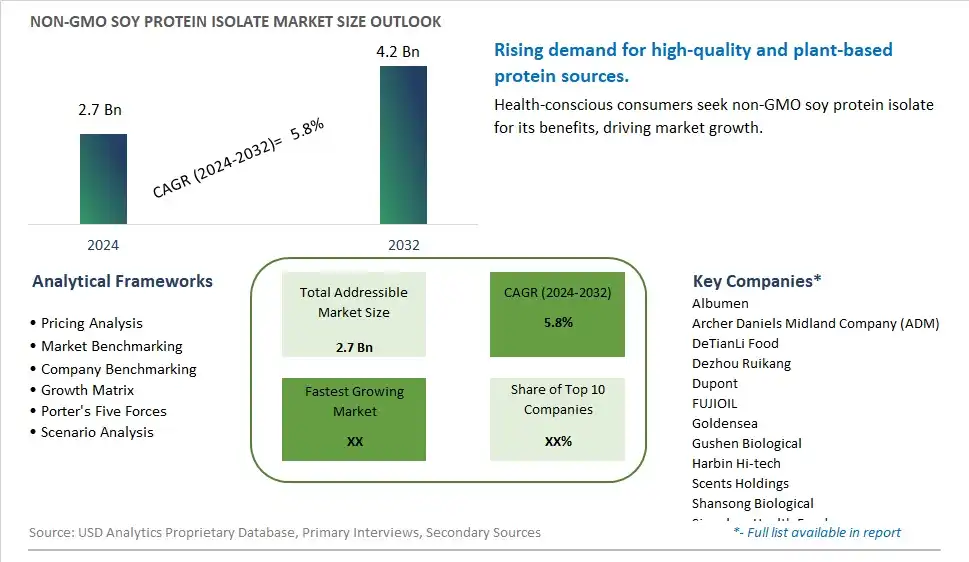
Global Non-GMO Soy Protein Isolate Market Size is valued at $2.7 Billion in 2024 and is forecast to register a growth rate (CAGR) of 5.8% to reach $4.2 Billion by 2032.
The global Non-GMO Soy Protein Isolate Market Comprehensive Study analyzes and forecasts the market size across 6 regions and 24 countries for diverse segments -By Type (Gelation Type, Injection Type, Dispersion Type, Others), By Application (Meat Products, Dairy Products, Flour Products, Beverage, Others)
An Introduction to Non-GMO Soy Protein Isolate Market
The Non-GMO Soy Protein Isolate Market focuses on the production and sale of soy protein isolate derived from non-genetically modified soybeans, catering to consumers seeking natural and sustainable protein sources. The market is driven by increasing demand for non-GMO and organic products, rising awareness about the benefits of soy protein, and growing applications in the food and beverage industry. Additionally, advancements in soy protein extraction technologies and the expansion of product offerings support market growth.
Non GMO Soy Protein Isolate Competitive Landscape
The market report analyses the leading companies in the industry including Albumen, Archer Daniels Midland Company (ADM), DeTianLi Food, Dezhou Ruikang, Dupont, FUJIOIL, Goldensea, Gushen Biological, Harbin Hi-tech, Scents Holdings, Shansong Biological, Sinoglory Health Food, Wonderful Industrial, Yuwang Group, and Others.
Non GMO Soy Protein Isolate Market Dynamics
Non-GMO Soy Protein Isolate Market Trend: Increasing Use in Plant-Based Proteins
The most prominent trend in the Non-GMO Soy Protein Isolate Market is the increasing use in plant-based proteins. Non-GMO soy protein isolate is gaining popularity as a key ingredient in plant-based foods and beverages, driven by the growing demand for vegan and vegetarian protein sources. This trend is fueled by the rise in plant-based diets, environmental concerns, and the desire for sustainable and ethical protein alternatives.
Non-GMO Soy Protein Isolate Market Driver: Health Consciousness and Protein Demand
A key driver in the Non-GMO Soy Protein Isolate Market is health consciousness and the rising demand for protein. As more individuals focus on building a high-protein diet for muscle growth, weight management, and overall health, there is a growing need for non-GMO soy protein isolate that provides a high-quality, complete protein source without the potential risks associated with GMOs. This demand supports the growth of the market as consumers seek nutritious and sustainable protein options.
Non-GMO Soy Protein Isolate Market Opportunity: Expansion into Functional Foods and Beverages
One significant opportunity in the Non-GMO Soy Protein Isolate Market lies in the expansion into functional foods and beverages. Companies can innovate by incorporating non-GMO soy protein isolate into a variety of products, such as protein bars, shakes, meat alternatives, and dairy-free products, offering consumers convenient and health-focused protein solutions. By highlighting the benefits of non-GMO soy protein, manufacturers can attract health-conscious consumers and drive market growth.
Non-GMO Soy Protein Isolate Market Share Analysis- Largest Segment by Type
In the Non-GMO Soy Protein Isolate Market, the Dispersion Type is the largest segment. This dominance is due to the versatility and wide applicability of dispersion-type soy protein isolates in various food and beverage products. Dispersion-type isolates are valued for their ability to blend easily with other ingredients, providing a smooth texture and consistent quality. They are commonly used in beverages, dairy alternatives, and protein supplements, where uniform distribution is crucial. The functional properties and broad range of applications of dispersion-type soy protein isolates contribute to their leading position in the market.
Non-GMO Soy Protein Isolate Market Share Analysis- Fastest Growing Segment by Application
In the Non-GMO Soy Protein Isolate Market, the Beverage application segment is poised to grow the fastest over the next five years. This growth is driven by the rising popularity of plant-based and functional beverages that cater to health-conscious consumers. Non-GMO soy protein isolates are increasingly used in plant-based milk alternatives, protein shakes, and nutritional beverages due to their high protein content and health benefits. As the demand for plant-based and fortified beverages continues to rise, this segment is expected to experience significant growth, driven by consumer preferences for non-GMO and functional ingredients.
Non-GMO Soy Protein Market Share Analysis- Largest Segment by Product
In the Non-GMO Soy Protein Market, Soy Protein Isolates represent the largest segment. This is due to their high protein content, functional versatility, and widespread use in various food applications. Soy protein isolates are valued for their ability to provide a significant protein boost while maintaining a neutral flavor and smooth texture, making them ideal for use in protein supplements, dairy alternatives, and meat substitutes. Their superior functional properties compared to other soy protein products, such as concentrates and textured soy protein, contribute to their dominant market position. Additionally, the increasing consumer demand for high-protein, non-GMO products supports the growth of this segment.
Non GMO Soy Protein Isolate Market Segmentation
By Type
Gelation Type
Injection Type
Dispersion Type
Others
By Application
Meat Products
Dairy Products
Flour Products
Beverage
Others
Countries Analyzed
North America (US, Canada, Mexico)
Europe (Germany, UK, France, Spain, Italy, Russia, Rest of Europe)
Asia Pacific (China, India, Japan, South Korea, Australia, South East Asia, Rest of Asia)
South America (Brazil, Argentina, Rest of South America)
Middle East and Africa (Saudi Arabia, UAE, Rest of Middle East, South Africa, Egypt, Rest of Africa)
Non GMO Soy Protein Isolate Companies Profiled in the Study
Albumen
Archer Daniels Midland Company (ADM)
DeTianLi Food
Dezhou Ruikang
Dupont
FUJIOIL
Goldensea
Gushen Biological
Harbin Hi-tech
Scents Holdings
Shansong Biological
Sinoglory Health Food
Wonderful Industrial
Yuwang Group
*- List Not Exhaustive
Chapter 1. TABLE OF CONTENTS
Chapter 2. Introduction to Non GMO Soy Protein Isolate Market
2.1. Market Overview
2.2. Key Statistics and Report Highlights
2.3. Scope of the Comprehensive Study
2.3.1. Market Definition
2.3.2 Countries and Regions Covered
2.3.3 Research Objective
2.3.4 Units, Currency, and Conversions
2.3.5 Industry Value Chain
2.4. Key Market Segments
2.5. Key Companies
2.6. Study Period
Chapter 3. Strategic Analysis Review
3.1. Non GMO Soy Protein Isolate Pricing Analysis and Forecast
3.2. Porter’s Five Forces
3.3. Market Ecosystem
3.4. SWOT Analysis
3.5. Regulatory Scenario
3.3. Effects of Inflation, Russia-Ukraine War, moderating economic growth, and other macroeconomic factors
Chapter 4. Competitive Landscape
4.1. Market Share Analysis
4.1.1. Global Non GMO Soy Protein Isolate Market Share by Company, 2023
4.1.2. Product Offerings of Leading Non GMO Soy Protein Isolate Companies
4.2. Market Entropy
4.2.1. New Product Launches in the Industry
4.2.2. Mergers, Acquisitions, Joint ventures, and Partnerships
4.3. Key Strategies and Best Practices
Chapter 5. Global Market Projections: Best, Reference, and Low Case Scenarios
5.1. Growth Analysis- Case Scenario Definitions
5.2. Low Growth Case Scenario Forecasts
5.3. Reference Growth Case Scenario Forecasts
5.4. High Growth Case Scenario Forecasts
Chapter 6. Market Dynamics
6.1. Non GMO Soy Protein Isolate Market Drivers
6.2. Non GMO Soy Protein Isolate Market Challenges
6.6. Non GMO Soy Protein Isolate Market Opportunities
6.4. Non GMO Soy Protein Isolate Market Trends
Chapter 7. Global Non GMO Soy Protein Isolate Market Outlook Trends
7.1. Global Non GMO Soy Protein Isolate Revenue (USD Million) and CAGR (%) by Type (2021-2032)
7.2. Global Non GMO Soy Protein Isolate Revenue (USD Million) and CAGR (%) by Application (2021-2032)
7.3. Global Non GMO Soy Protein Isolate Revenue (USD Million) and CAGR (%) by Product (2021-2032)
By Type
Gelation Type
Injection Type
Dispersion Type
Others
By Application
Meat Products
Dairy Products
Flour Products
Beverage
Others
Chapter 8. Global Non GMO Soy Protein Isolate Regional Analysis and Outlook
8.1. Global Non GMO Soy Protein Isolate Revenue (USD Million) By Regions (2021- 2032)
8.2. North America Non GMO Soy Protein Isolate Revenue (USD Million) by Country (2021-2032)
8.2.1. United States Non GMO Soy Protein Isolate Regional Analysis and Outlook
8.2.2. Canada Non GMO Soy Protein Isolate Regional Analysis and Outlook
8.2.3. Mexico Non GMO Soy Protein Isolate Regional Analysis and Outlook
8.3. Europe Non GMO Soy Protein Isolate Revenue (USD Million), by Country (2021-2032)
8.3.1. Germany Non GMO Soy Protein Isolate Regional Analysis and Outlook
8.3.2. France Non GMO Soy Protein Isolate Regional Analysis and Outlook
8.3.3. United Kingdom Non GMO Soy Protein Isolate Regional Analysis and Outlook
8.3.4. Spain Non GMO Soy Protein Isolate Regional Analysis and Outlook
8.3.5. Italy Non GMO Soy Protein Isolate Regional Analysis and Outlook
8.3.6. Russia Non GMO Soy Protein Isolate Regional Analysis and Outlook
8.3.7. Rest of Europe Non GMO Soy Protein Isolate Regional Analysis and Outlook
8.4. Asia Pacific Non GMO Soy Protein Isolate Revenue (USD Million) by Country (2021-2032)
8.4.1. China Non GMO Soy Protein Isolate Regional Analysis and Outlook
8.4.2. Japan Non GMO Soy Protein Isolate Regional Analysis and Outlook
8.4.3. India Non GMO Soy Protein Isolate Regional Analysis and Outlook
8.4.4. South Korea Non GMO Soy Protein Isolate Regional Analysis and Outlook
8.4.5. Australia Non GMO Soy Protein Isolate Regional Analysis and Outlook
8.4.6. South East Asia Non GMO Soy Protein Isolate Regional Analysis and Outlook
8.4.7. Rest of Asia Pacific Non GMO Soy Protein Isolate Regional Analysis and Outlook
8.5. South America Non GMO Soy Protein Isolate Revenue (USD Million), by Country (2021-2032)
8.5.1. Brazil Non GMO Soy Protein Isolate Regional Analysis and Outlook
8.5.2. Argentina Non GMO Soy Protein Isolate Regional Analysis and Outlook
8.5.3. Rest of South America Non GMO Soy Protein Isolate Regional Analysis and Outlook
8.6. Middle East and Africa Non GMO Soy Protein Isolate Revenue (USD Million) by Country (2021-2032)
8.6.1. Middle East Non GMO Soy Protein Isolate Regional Analysis and Outlook
8.6.2. Africa Non GMO Soy Protein Isolate Regional Analysis and Outlook
Chapter 9. North America Non GMO Soy Protein Isolate Analysis and Outlook
9.1. North America Non GMO Soy Protein Isolate Revenue (USD Million) by Segments (2021-2032)
9.1.1. North America Non GMO Soy Protein Isolate Revenue (USD Million) by Type (2021-2032)
9.1.2. North America Non GMO Soy Protein Isolate Revenue (USD Million) by Application (2021-2032)
9.1.3. North America Non GMO Soy Protein Isolate Revenue (USD Million) by Product (2021-2032)
By Type
Gelation Type
Injection Type
Dispersion Type
Others
By Application
Meat Products
Dairy Products
Flour Products
Beverage
Others
Chapter 10. Europe Non GMO Soy Protein Isolate Analysis and Outlook
10.1. Europe Non GMO Soy Protein Isolate Revenue (USD Million), by Segments (USD Million) (2021-2032)
10.1.1. Europe Non GMO Soy Protein Isolate Revenue (USD Million) by Type (2021-2032)
10.1.2. Europe Non GMO Soy Protein Isolate Revenue (USD Million) by Application (2021-2032)
10.1.3. Europe Non GMO Soy Protein Isolate Revenue (USD Million) by Product (2021-2032)
By Type
Gelation Type
Injection Type
Dispersion Type
Others
By Application
Meat Products
Dairy Products
Flour Products
Beverage
Others
Chapter 11. Asia Pacific Non GMO Soy Protein Isolate Analysis and Outlook
11.1. Asia Pacific Non GMO Soy Protein Isolate Revenue (USD Million), and Revenue (USD Million) by Segments (2021-2032)
11.1.1. Asia Pacific Non GMO Soy Protein Isolate Revenue (USD Million) by Type (2021-2032)
11.1.2. Asia Pacific Non GMO Soy Protein Isolate Revenue (USD Million) by Application (2021-2032)
11.1.3. Asia Pacific Non GMO Soy Protein Isolate Revenue (USD Million) by Product (2021-2032)
By Type
Gelation Type
Injection Type
Dispersion Type
Others
By Application
Meat Products
Dairy Products
Flour Products
Beverage
Others
Chapter 12. South America Non GMO Soy Protein Isolate Analysis and Outlook
12.1. South America Non GMO Soy Protein Isolate Revenue (USD Million), by Segments (2021-2032)
12.1.1. South America Non GMO Soy Protein Isolate Revenue (USD Million) by Type (2021-2032)
12.1.2. South America Non GMO Soy Protein Isolate Revenue (USD Million) by Application (2021-2032)
12.1.3. South America Non GMO Soy Protein Isolate Revenue (USD Million) by Product (2021-2032)
By Type
Gelation Type
Injection Type
Dispersion Type
Others
By Application
Meat Products
Dairy Products
Flour Products
Beverage
Others
Chapter 13. Middle East and Africa Non GMO Soy Protein Isolate Analysis and Outlook
13.1. Middle East and Africa Non GMO Soy Protein Isolate Revenue (USD Million), by Segments (2021-2032)
13.1.1. Middle East and Africa Non GMO Soy Protein Isolate Revenue (USD Million) by Type (2021-2032)
13.1.2. Middle East and Africa Non GMO Soy Protein Isolate Revenue (USD Million) by Application (2021-2032)
13.1.3. Middle East and Africa Non GMO Soy Protein Isolate Revenue (USD Million) by Product (2021-2032)
By Type
Gelation Type
Injection Type
Dispersion Type
Others
By Application
Meat Products
Dairy Products
Flour Products
Beverage
Others
Chapter 14. Non GMO Soy Protein Isolate Company Profiles
14.1 Business Overview
14.2 Product Profiles
14.3 SWOT Profiles
14.5 Recent Developments
14.6 Financial Profile
List of Companies
Albumen
Archer Daniels Midland Company (ADM)
DeTianLi Food
Dezhou Ruikang
Dupont
FUJIOIL
Goldensea
Gushen Biological
Harbin Hi-tech
Scents Holdings
Shansong Biological
Sinoglory Health Food
Wonderful Industrial
Yuwang Group
15. Methodology and Data Sources
15.1 Customization Offerings
15.2 Subscription Services
15.3 Related Reports
15.4 Publisher Expertise
LIST OF TABLES
Table 1 Market Segmentation Analysis
Table 2 Global Non GMO Soy Protein Isolate Market Share of Leading Companies, 2023
Table 3 Product Offerings of Leading Companies
Table 4 Low Growth Scenario Forecasts
Table 5 Reference Case Growth Scenario
Table 6 High Growth Case Scenario
Table 7 Global Non GMO Soy Protein Isolate Revenue (USD Million) And CAGR (%) By Type (2021-2032)
Table 8 Global Non GMO Soy Protein Isolate Revenue (USD Million) And CAGR (%) By Application (2021-2032)
Table 9 Global Non GMO Soy Protein Isolate Revenue (USD Million) And CAGR (%) By Product (2021-2032)
Table 10 Global Non GMO Soy Protein Isolate Market Revenue (USD Million) By Regions (2021-2032)
Table 11 Global Non GMO Soy Protein Isolate Market Share (%) By Regions (2021-2032)
Table 12 North America Non GMO Soy Protein Isolate Revenue (USD Million) By Country (2021-2032)
Table 13 Europe Non GMO Soy Protein Isolate Revenue (USD Million) By Country (2021-2032)
Table 14 Asia Pacific Non GMO Soy Protein Isolate Revenue (USD Million) By Country (2021-2032)
Table 15 South America Non GMO Soy Protein Isolate Revenue (USD Million) By Country (2021-2032)
Table 16 Middle East and Africa Non GMO Soy Protein Isolate Revenue (USD Million) By Region (2021-2032)
Table 17 North America Non GMO Soy Protein Isolate Revenue (USD Million) By Type (2021-2032)
Table 18 North America Non GMO Soy Protein Isolate Revenue (USD Million) By Application (2021-2032)
Table 19 North America Non GMO Soy Protein Isolate Revenue (USD Million) By Product (2021-2032)
Table 20 Europe Non GMO Soy Protein Isolate Revenue (USD Million) By Type (2021-2032)
Table 21 Europe Non GMO Soy Protein Isolate Revenue (USD Million) By Application (2021-2032)
Table 22 Europe Non GMO Soy Protein Isolate Revenue (USD Million) By Product (2021-2032)
Table 23 Asia Pacific Non GMO Soy Protein Isolate Revenue (USD Million) By Type (2021-2032)
Table 24 Asia Pacific Non GMO Soy Protein Isolate Revenue (USD Million) By Application (2021-2032)
Table 25 Asia Pacific Non GMO Soy Protein Isolate Revenue (USD Million) By Product (2021-2032)
Table 26 South America Non GMO Soy Protein Isolate Revenue (USD Million) By Type (2021-2032)
Table 27 South America Non GMO Soy Protein Isolate Revenue (USD Million) By Application (2021-2032)
Table 28 South America Non GMO Soy Protein Isolate Revenue (USD Million) By Product (2021-2032)
Table 29 Middle East and Africa Non GMO Soy Protein Isolate Revenue (USD Million) By Type (2021-2032)
Table 30 Middle East and Africa Non GMO Soy Protein Isolate Revenue (USD Million) By Application (2021-2032)
Table 31 Middle East and Africa Non GMO Soy Protein Isolate Revenue (USD Million) By Product (2021-2032)
LIST OF FIGURES
Figure 1. Market Scope
Figure 2. Pricing Forecasts Per Unit, 2023- 2032
Figure 3. Porter’s Five Forces
Figure 4. Global Non GMO Soy Protein Isolate Market Revenue (USD Million) By Regions (2021-2032)
Figure 5. Global Non GMO Soy Protein Isolate Market Share (%) By Regions (2023)
Figure 6. North America Non GMO Soy Protein Isolate Revenue (USD Million) By Country (2021-2032)
Figure 7. United States Non GMO Soy Protein Isolate Revenue (USD Million) By Country (2021-2032)
Figure 8. Canada Non GMO Soy Protein Isolate Revenue (USD Million) By Country (2021-2032)
Figure 9. Mexico Non GMO Soy Protein Isolate Revenue (USD Million) By Country (2021-2032)
Figure 10. Europe Non GMO Soy Protein Isolate Revenue (USD Million) By Country (2021-2032)
Figure 11. Germany Non GMO Soy Protein Isolate Revenue (USD Million) By Country (2021-2032)
Figure 12. France Non GMO Soy Protein Isolate Revenue (USD Million) By Country (2021-2032)
Figure 13. United Kingdom Non GMO Soy Protein Isolate Revenue (USD Million) By Country (2021-2032)
Figure 14. Spain Non GMO Soy Protein Isolate Revenue (USD Million) By Country (2021-2032)
Figure 15. Italy Non GMO Soy Protein Isolate Revenue (USD Million) By Country (2021-2032)
Figure 16. Russia Non GMO Soy Protein Isolate Revenue (USD Million) By Country (2021-2032)
Figure 17. Rest of Europe Non GMO Soy Protein Isolate Revenue (USD Million) By Country (2021-2032)
Figure 11. Asia Pacific Non GMO Soy Protein Isolate Revenue (USD Million) By Country (2021-2032)
Figure 12. China Non GMO Soy Protein Isolate Revenue (USD Million) By Country (2021-2032)
Figure 13. Japan Non GMO Soy Protein Isolate Revenue (USD Million) By Country (2021-2032)
Figure 14. India Non GMO Soy Protein Isolate Revenue (USD Million) By Country (2021-2032)
Figure 15. South Korea Non GMO Soy Protein Isolate Revenue (USD Million) By Country (2021-2032)
Figure 16. Australia Non GMO Soy Protein Isolate Revenue (USD Million) By Country (2021-2032)
Figure 17. South East Asia Non GMO Soy Protein Isolate Revenue (USD Million) By Country (2021-2032)
Figure 18. South America Non GMO Soy Protein Isolate Revenue (USD Million) By Country (2021-2032)
Figure 19. Brazil Non GMO Soy Protein Isolate Revenue (USD Million) By Country (2021-2032)
Figure 20. Argentina Non GMO Soy Protein Isolate Revenue (USD Million) By Country (2021-2032)
Figure 21. Rest of Asia Pacific Non GMO Soy Protein Isolate Revenue (USD Million) By Country (2021-2032)
Figure 22. Middle East and Africa Non GMO Soy Protein Isolate Revenue (USD Million) By Region (2021-2032)
Figure 23. Saudi Arabia Non GMO Soy Protein Isolate Revenue (USD Million) By Region (2021-2032)
Figure 24. The UAE Non GMO Soy Protein Isolate Revenue (USD Million) By Region (2021-2032)
Figure 25. Rest of Middle East Non GMO Soy Protein Isolate Revenue (USD Million) By Region (2021-2032)
Figure 26. South Africa Non GMO Soy Protein Isolate Revenue (USD Million) By Region (2021-2032)
Figure 27. Africa Non GMO Soy Protein Isolate Revenue (USD Million) By Region (2021-2032)
Figure 28. North America Non GMO Soy Protein Isolate Revenue (USD Million) By Type (2021-2032)
Figure 29. North America Non GMO Soy Protein Isolate Revenue (USD Million) By Application (2021-2032)
Figure 30. North America Non GMO Soy Protein Isolate Revenue (USD Million) By Product (2021-2032)
Figure 31. Europe Non GMO Soy Protein Isolate Revenue (USD Million) By Type (2021-2032)
Figure 32. Europe Non GMO Soy Protein Isolate Revenue (USD Million) By Application (2021-2032)
Figure 33. Europe Non GMO Soy Protein Isolate Revenue (USD Million) By Product (2021-2032)
Figure 34. Asia Pacific Non GMO Soy Protein Isolate Revenue (USD Million) By Type (2021-2032)
Figure 35. Asia Pacific Non GMO Soy Protein Isolate Revenue (USD Million) By Application (2021-2032)
Figure 36. Asia Pacific Non GMO Soy Protein Isolate Revenue (USD Million) By Product (2021-2032)
Figure 37. South America Non GMO Soy Protein Isolate Revenue (USD Million) By Type (2021-2032)
Figure 38. South America Non GMO Soy Protein Isolate Revenue (USD Million) By Application (2021-2032)
Figure 39. South America Non GMO Soy Protein Isolate Revenue (USD Million) By Product (2021-2032)
Figure 40. Middle East and Africa Non GMO Soy Protein Isolate Revenue (USD Million) By Type (2021-2032)
Figure 41. Middle East and Africa Non GMO Soy Protein Isolate Revenue (USD Million) By Application (2021-2032)
Figure 42. Middle East and Africa Non GMO Soy Protein Isolate Revenue (USD Million) By Product (2021-2032)
By Type
Gelation Type
Injection Type
Dispersion Type
Others
By Application
Meat Products
Dairy Products
Flour Products
Beverage
Others
Countries Analyzed
North America (US, Canada, Mexico)
Europe (Germany, UK, France, Spain, Italy, Russia, Rest of Europe)
Asia Pacific (China, India, Japan, South Korea, Australia, South East Asia, Rest of Asia)
South America (Brazil, Argentina, Rest of South America)
Middle East and Africa (Saudi Arabia, UAE, Rest of Middle East, South Africa, Egypt, Rest of Africa)
