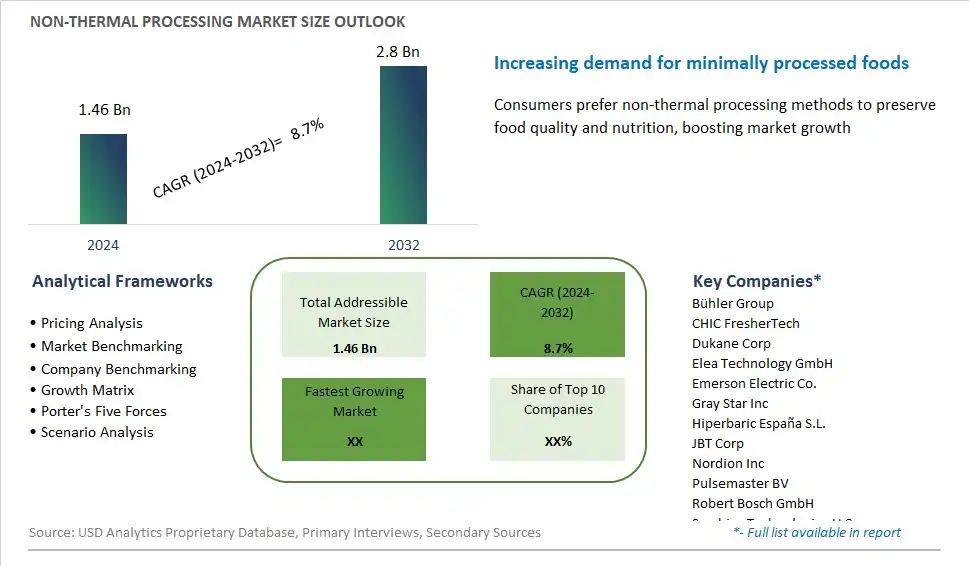
Global Non-Thermal Processing Market Size is valued at $1.46 Billion in 2024 and is forecast to register a growth rate (CAGR) of 8.7% to reach $2.8 Billion by 2032.
The global Non-Thermal Processing Market Comprehensive Study analyzes and forecasts the market size across 6 regions and 24 countries for diverse segments -By Food (Meat & seafood, Fruits & vegetables, Beverages, Others), By Technology (HPP, PEF, Ultrasonic, Irradiation, Cold plasma, Others), By Function (Quality assurance, Microbial inactivation, Cutting, Emulsification & homogenization, Cleaning, Others)
An Introduction to Non-Thermal Processing Market
Non-thermal processing refers to food preservation and treatment methods that do not involve heating to high temperatures, preserving the sensory, nutritional, and functional properties of food products in 2024. Non-thermal processing techniques include techniques such as high-pressure processing (HPP), pulsed electric fields (PEF), ultraviolet (UV) irradiation, and cold plasma treatment, which effectively inactivate microorganisms, enzymes, and pathogens while minimizing adverse effects on food quality. Non-thermal processing is used in a wide range of food products, including juices, dairy products, meats, and ready-to-eat meals, where it extends shelf life, preserves freshness, and enhances safety without the need for chemical preservatives or excessive heat. With advancements in processing technology and consumer demand for minimally processed foods, the market for non-thermal processing is expected to grow, driven by innovations in equipment design, process optimization, and regulatory approval that enable manufacturers to meet stringent food safety standards and consumer preferences for natural, nutritious, and convenient food options.
Non Thermal Processing Competitive Landscape
The market report analyses the leading companies in the industry including Bühler Group, CHIC FresherTech, Dukane Corp, Elea Technology GmbH, Emerson Electric Co., Gray Star Inc, Hiperbaric España S.L., JBT Corp, Nordion Inc, Pulsemaster BV, Robert Bosch GmbH, Symbios Technologies LLC, and Others.
Non Thermal Processing Market Dynamics
Market Trend: Growth of Non-Thermal Preservation Methods
The most prominent trend in the Non-Thermal Processing Market is the growth of non-thermal preservation methods. As consumers demand fresher and more natural food products, manufacturers are turning to non-thermal technologies, such as high-pressure processing (HPP), pulsed electric fields (PEF), and ultraviolet (UV) light, to preserve food without the use of heat. These methods retain the nutritional and sensory qualities of food, aligning with the clean label and health-conscious trends. The increasing adoption of non-thermal processing technologies is driving market growth and innovation
Market Driver: Demand for Minimally Processed Foods
The demand for minimally processed foods is a major driver of the Non-Thermal Processing Market. Consumers are seeking foods that are closer to their natural state, with minimal additives and processing. Non-thermal processing technologies meet this demand by offering preservation methods that do not rely on high temperatures or synthetic chemicals. The growing awareness of the health benefits of minimally processed foods is driving the adoption of non-thermal technologies in the food industry, as manufacturers aim to deliver high-quality and nutritious products
Market Opportunity: Expansion of Technological Applications
A significant opportunity in the Non-Thermal Processing Market lies in the expansion of technological applications. While non-thermal processing technologies are already used in various food and beverage categories, there is potential for their application in new areas, such as pharmaceuticals, cosmetics, and nutraceuticals. By exploring and developing non-thermal processing solutions for these industries, companies can diversify their market presence and capitalize on the growing demand for non-thermal preservation methods. This expansion can drive innovation and open new revenue streams
Non-Thermal Processing Market Share Analysis: Food (Meat & seafood, Fruits & vegetables, Beverages, Others)
The beverages segment is projected to be the fastest-growing in the Non-Thermal Processing Market by food to 2032. The demand for non-thermal processing technologies, such as high-pressure processing (HPP) and pulsed electric fields (PEF), in the beverages industry is driven by the increasing consumer preference for fresh-tasting, nutrient-rich, and minimally processed drinks. Non-thermal processing effectively preserves the flavor, color, and nutritional content of beverages while ensuring microbial safety. The growing trend of health and wellness, coupled with the rising popularity of cold-pressed juices, smoothies, and functional drinks, further boosts the demand for non-thermal processing in this segment. The expansion of the clean label and organic beverage markets supports the segment's rapid growth.
Non-Thermal Processing Market Share Analysis: Technology (HPP, PEF, Ultrasonic, Irradiation, Cold plasma, Others)
The high-pressure processing (HPP) segment is expected to be the fastest-growing in the Non-Thermal Processing Market by technology to 2032. HPP technology is widely adopted in the food and beverage industry for its ability to inactivate pathogens and extend shelf life without compromising the sensory and nutritional quality of products. The demand for HPP is driven by the increasing consumer preference for minimally processed, clean label, and preservative-free foods. Additionally, the versatility of HPP technology, which can be applied to a wide range of products, including juices, meats, seafood, and ready-to-eat meals, contributes to its rapid growth. The growing awareness of the benefits of HPP technology among food manufacturers and consumers further supports the segment's expansion.
Non-Thermal Processing Market Share Analysis: Function (Quality assurance, Microbial inactivation, Cutting, Emulsification & homogenization, Cleaning, Others)
The microbial inactivation segment is anticipated to be the fastest-growing in the Non-Thermal Processing Market by function to 2032. Non-thermal processing technologies, such as HPP, PEF, and cold plasma, are highly effective in inactivating pathogens and spoilage microorganisms while preserving the sensory and nutritional quality of foods. The demand for microbial inactivation is driven by the increasing focus on food safety and the rising incidence of foodborne illnesses. Additionally, the growing consumer preference for minimally processed and preservative-free foods boosts the demand for non-thermal processing technologies that ensure microbial safety. The adoption of non-thermal processing in various food applications, including juices, meats, seafood, and ready-to-eat meals, supports the segment's rapid growth.
Non Thermal Processing Market Segmentation
By Food
Meat & seafood
Fruits & vegetables
Beverages
Others
By Technology
HPP
PEF
Ultrasonic
Irradiation
Cold plasma
Others
By Function
Quality assurance
Microbial inactivation
Cutting
Emulsification & homogenization
Cleaning
Others
Countries Analyzed
North America (US, Canada, Mexico)
Europe (Germany, UK, France, Spain, Italy, Russia, Rest of Europe)
Asia Pacific (China, India, Japan, South Korea, Australia, South East Asia, Rest of Asia)
South America (Brazil, Argentina, Rest of South America)
Middle East and Africa (Saudi Arabia, UAE, Rest of Middle East, South Africa, Egypt, Rest of Africa)
Non Thermal Processing Companies Profiled in the Study
Bühler Group
CHIC FresherTech
Dukane Corp
Elea Technology GmbH
Emerson Electric Co.
Gray Star Inc
Hiperbaric España S.L.
JBT Corp
Nordion Inc
Pulsemaster BV
Robert Bosch GmbH
Symbios Technologies LLC
*- List Not Exhaustive
Chapter 1. TABLE OF CONTENTS
Chapter 2. Introduction to Non Thermal Processing Market
2.1. Market Overview
2.2. Key Statistics and Report Highlights
2.3. Scope of the Comprehensive Study
2.3.1. Market Definition
2.3.2 Countries and Regions Covered
2.3.3 Research Objective
2.3.4 Units, Currency, and Conversions
2.3.5 Industry Value Chain
2.4. Key Market Segments
2.5. Key Companies
2.6. Study Period
Chapter 3. Strategic Analysis Review
3.1. Non Thermal Processing Pricing Analysis and Forecast
3.2. Porter’s Five Forces
3.3. Market Ecosystem
3.4. SWOT Analysis
3.5. Regulatory Scenario
3.3. Effects of Inflation, Russia-Ukraine War, moderating economic growth, and other macroeconomic factors
Chapter 4. Competitive Landscape
4.1. Market Share Analysis
4.1.1. Global Non Thermal Processing Market Share by Company, 2023
4.1.2. Product Offerings of Leading Non Thermal Processing Companies
4.2. Market Entropy
4.2.1. New Product Launches in the Industry
4.2.2. Mergers, Acquisitions, Joint ventures, and Partnerships
4.3. Key Strategies and Best Practices
Chapter 5. Global Market Projections: Best, Reference, and Low Case Scenarios
5.1. Growth Analysis- Case Scenario Definitions
5.2. Low Growth Case Scenario Forecasts
5.3. Reference Growth Case Scenario Forecasts
5.4. High Growth Case Scenario Forecasts
Chapter 6. Market Dynamics
6.1. Non Thermal Processing Market Drivers
6.2. Non Thermal Processing Market Challenges
6.6. Non Thermal Processing Market Opportunities
6.4. Non Thermal Processing Market Trends
Chapter 7. Global Non Thermal Processing Market Outlook Trends
7.1. Global Non Thermal Processing Revenue (USD Million) and CAGR (%) by Type (2021-2032)
7.2. Global Non Thermal Processing Revenue (USD Million) and CAGR (%) by Application (2021-2032)
7.3. Global Non Thermal Processing Revenue (USD Million) and CAGR (%) by Product (2021-2032)
By Food
Meat & seafood
Fruits & vegetables
Beverages
Others
By Technology
HPP
PEF
Ultrasonic
Irradiation
Cold plasma
Others
By Function
Quality assurance
Microbial inactivation
Cutting
Emulsification & homogenization
Cleaning
Others
Chapter 8. Global Non Thermal Processing Regional Analysis and Outlook
8.1. Global Non Thermal Processing Revenue (USD Million) By Regions (2021- 2032)
8.2. North America Non Thermal Processing Revenue (USD Million) by Country (2021-2032)
8.2.1. United States Non Thermal Processing Regional Analysis and Outlook
8.2.2. Canada Non Thermal Processing Regional Analysis and Outlook
8.2.3. Mexico Non Thermal Processing Regional Analysis and Outlook
8.3. Europe Non Thermal Processing Revenue (USD Million), by Country (2021-2032)
8.3.1. Germany Non Thermal Processing Regional Analysis and Outlook
8.3.2. France Non Thermal Processing Regional Analysis and Outlook
8.3.3. United Kingdom Non Thermal Processing Regional Analysis and Outlook
8.3.4. Spain Non Thermal Processing Regional Analysis and Outlook
8.3.5. Italy Non Thermal Processing Regional Analysis and Outlook
8.3.6. Russia Non Thermal Processing Regional Analysis and Outlook
8.3.7. Rest of Europe Non Thermal Processing Regional Analysis and Outlook
8.4. Asia Pacific Non Thermal Processing Revenue (USD Million) by Country (2021-2032)
8.4.1. China Non Thermal Processing Regional Analysis and Outlook
8.4.2. Japan Non Thermal Processing Regional Analysis and Outlook
8.4.3. India Non Thermal Processing Regional Analysis and Outlook
8.4.4. South Korea Non Thermal Processing Regional Analysis and Outlook
8.4.5. Australia Non Thermal Processing Regional Analysis and Outlook
8.4.6. South East Asia Non Thermal Processing Regional Analysis and Outlook
8.4.7. Rest of Asia Pacific Non Thermal Processing Regional Analysis and Outlook
8.5. South America Non Thermal Processing Revenue (USD Million), by Country (2021-2032)
8.5.1. Brazil Non Thermal Processing Regional Analysis and Outlook
8.5.2. Argentina Non Thermal Processing Regional Analysis and Outlook
8.5.3. Rest of South America Non Thermal Processing Regional Analysis and Outlook
8.6. Middle East and Africa Non Thermal Processing Revenue (USD Million) by Country (2021-2032)
8.6.1. Middle East Non Thermal Processing Regional Analysis and Outlook
8.6.2. Africa Non Thermal Processing Regional Analysis and Outlook
Chapter 9. North America Non Thermal Processing Analysis and Outlook
9.1. North America Non Thermal Processing Revenue (USD Million) by Segments (2021-2032)
9.1.1. North America Non Thermal Processing Revenue (USD Million) by Type (2021-2032)
9.1.2. North America Non Thermal Processing Revenue (USD Million) by Application (2021-2032)
9.1.3. North America Non Thermal Processing Revenue (USD Million) by Product (2021-2032)
By Food
Meat & seafood
Fruits & vegetables
Beverages
Others
By Technology
HPP
PEF
Ultrasonic
Irradiation
Cold plasma
Others
By Function
Quality assurance
Microbial inactivation
Cutting
Emulsification & homogenization
Cleaning
Others
Chapter 10. Europe Non Thermal Processing Analysis and Outlook
10.1. Europe Non Thermal Processing Revenue (USD Million), by Segments (USD Million) (2021-2032)
10.1.1. Europe Non Thermal Processing Revenue (USD Million) by Type (2021-2032)
10.1.2. Europe Non Thermal Processing Revenue (USD Million) by Application (2021-2032)
10.1.3. Europe Non Thermal Processing Revenue (USD Million) by Product (2021-2032)
By Food
Meat & seafood
Fruits & vegetables
Beverages
Others
By Technology
HPP
PEF
Ultrasonic
Irradiation
Cold plasma
Others
By Function
Quality assurance
Microbial inactivation
Cutting
Emulsification & homogenization
Cleaning
Others
Chapter 11. Asia Pacific Non Thermal Processing Analysis and Outlook
11.1. Asia Pacific Non Thermal Processing Revenue (USD Million), and Revenue (USD Million) by Segments (2021-2032)
11.1.1. Asia Pacific Non Thermal Processing Revenue (USD Million) by Type (2021-2032)
11.1.2. Asia Pacific Non Thermal Processing Revenue (USD Million) by Application (2021-2032)
11.1.3. Asia Pacific Non Thermal Processing Revenue (USD Million) by Product (2021-2032)
By Food
Meat & seafood
Fruits & vegetables
Beverages
Others
By Technology
HPP
PEF
Ultrasonic
Irradiation
Cold plasma
Others
By Function
Quality assurance
Microbial inactivation
Cutting
Emulsification & homogenization
Cleaning
Others
Chapter 12. South America Non Thermal Processing Analysis and Outlook
12.1. South America Non Thermal Processing Revenue (USD Million), by Segments (2021-2032)
12.1.1. South America Non Thermal Processing Revenue (USD Million) by Type (2021-2032)
12.1.2. South America Non Thermal Processing Revenue (USD Million) by Application (2021-2032)
12.1.3. South America Non Thermal Processing Revenue (USD Million) by Product (2021-2032)
By Food
Meat & seafood
Fruits & vegetables
Beverages
Others
By Technology
HPP
PEF
Ultrasonic
Irradiation
Cold plasma
Others
By Function
Quality assurance
Microbial inactivation
Cutting
Emulsification & homogenization
Cleaning
Others
Chapter 13. Middle East and Africa Non Thermal Processing Analysis and Outlook
13.1. Middle East and Africa Non Thermal Processing Revenue (USD Million), by Segments (2021-2032)
13.1.1. Middle East and Africa Non Thermal Processing Revenue (USD Million) by Type (2021-2032)
13.1.2. Middle East and Africa Non Thermal Processing Revenue (USD Million) by Application (2021-2032)
13.1.3. Middle East and Africa Non Thermal Processing Revenue (USD Million) by Product (2021-2032)
By Food
Meat & seafood
Fruits & vegetables
Beverages
Others
By Technology
HPP
PEF
Ultrasonic
Irradiation
Cold plasma
Others
By Function
Quality assurance
Microbial inactivation
Cutting
Emulsification & homogenization
Cleaning
Others
Chapter 14. Non Thermal Processing Company Profiles
14.1 Business Overview
14.2 Product Profiles
14.3 SWOT Profiles
14.5 Recent Developments
14.6 Financial Profile
List of Companies
Bühler Group
CHIC FresherTech
Dukane Corp
Elea Technology GmbH
Emerson Electric Co.
Gray Star Inc
Hiperbaric España S.L.
JBT Corp
Nordion Inc
Pulsemaster BV
Robert Bosch GmbH
Symbios Technologies LLC
15. Methodology and Data Sources
15.1 Customization Offerings
15.2 Subscription Services
15.3 Related Reports
15.4 Publisher Expertise
LIST OF TABLES
Table 1 Market Segmentation Analysis
Table 2 Global Non Thermal Processing Market Share of Leading Companies, 2023
Table 3 Product Offerings of Leading Companies
Table 4 Low Growth Scenario Forecasts
Table 5 Reference Case Growth Scenario
Table 6 High Growth Case Scenario
Table 7 Global Non Thermal Processing Revenue (USD Million) And CAGR (%) By Type (2021-2032)
Table 8 Global Non Thermal Processing Revenue (USD Million) And CAGR (%) By Application (2021-2032)
Table 9 Global Non Thermal Processing Revenue (USD Million) And CAGR (%) By Product (2021-2032)
Table 10 Global Non Thermal Processing Market Revenue (USD Million) By Regions (2021-2032)
Table 11 Global Non Thermal Processing Market Share (%) By Regions (2021-2032)
Table 12 North America Non Thermal Processing Revenue (USD Million) By Country (2021-2032)
Table 13 Europe Non Thermal Processing Revenue (USD Million) By Country (2021-2032)
Table 14 Asia Pacific Non Thermal Processing Revenue (USD Million) By Country (2021-2032)
Table 15 South America Non Thermal Processing Revenue (USD Million) By Country (2021-2032)
Table 16 Middle East and Africa Non Thermal Processing Revenue (USD Million) By Region (2021-2032)
Table 17 North America Non Thermal Processing Revenue (USD Million) By Type (2021-2032)
Table 18 North America Non Thermal Processing Revenue (USD Million) By Application (2021-2032)
Table 19 North America Non Thermal Processing Revenue (USD Million) By Product (2021-2032)
Table 20 Europe Non Thermal Processing Revenue (USD Million) By Type (2021-2032)
Table 21 Europe Non Thermal Processing Revenue (USD Million) By Application (2021-2032)
Table 22 Europe Non Thermal Processing Revenue (USD Million) By Product (2021-2032)
Table 23 Asia Pacific Non Thermal Processing Revenue (USD Million) By Type (2021-2032)
Table 24 Asia Pacific Non Thermal Processing Revenue (USD Million) By Application (2021-2032)
Table 25 Asia Pacific Non Thermal Processing Revenue (USD Million) By Product (2021-2032)
Table 26 South America Non Thermal Processing Revenue (USD Million) By Type (2021-2032)
Table 27 South America Non Thermal Processing Revenue (USD Million) By Application (2021-2032)
Table 28 South America Non Thermal Processing Revenue (USD Million) By Product (2021-2032)
Table 29 Middle East and Africa Non Thermal Processing Revenue (USD Million) By Type (2021-2032)
Table 30 Middle East and Africa Non Thermal Processing Revenue (USD Million) By Application (2021-2032)
Table 31 Middle East and Africa Non Thermal Processing Revenue (USD Million) By Product (2021-2032)
LIST OF FIGURES
Figure 1. Market Scope
Figure 2. Pricing Forecasts Per Unit, 2023- 2032
Figure 3. Porter’s Five Forces
Figure 4. Global Non Thermal Processing Market Revenue (USD Million) By Regions (2021-2032)
Figure 5. Global Non Thermal Processing Market Share (%) By Regions (2023)
Figure 6. North America Non Thermal Processing Revenue (USD Million) By Country (2021-2032)
Figure 7. United States Non Thermal Processing Revenue (USD Million) By Country (2021-2032)
Figure 8. Canada Non Thermal Processing Revenue (USD Million) By Country (2021-2032)
Figure 9. Mexico Non Thermal Processing Revenue (USD Million) By Country (2021-2032)
Figure 10. Europe Non Thermal Processing Revenue (USD Million) By Country (2021-2032)
Figure 11. Germany Non Thermal Processing Revenue (USD Million) By Country (2021-2032)
Figure 12. France Non Thermal Processing Revenue (USD Million) By Country (2021-2032)
Figure 13. United Kingdom Non Thermal Processing Revenue (USD Million) By Country (2021-2032)
Figure 14. Spain Non Thermal Processing Revenue (USD Million) By Country (2021-2032)
Figure 15. Italy Non Thermal Processing Revenue (USD Million) By Country (2021-2032)
Figure 16. Russia Non Thermal Processing Revenue (USD Million) By Country (2021-2032)
Figure 17. Rest of Europe Non Thermal Processing Revenue (USD Million) By Country (2021-2032)
Figure 11. Asia Pacific Non Thermal Processing Revenue (USD Million) By Country (2021-2032)
Figure 12. China Non Thermal Processing Revenue (USD Million) By Country (2021-2032)
Figure 13. Japan Non Thermal Processing Revenue (USD Million) By Country (2021-2032)
Figure 14. India Non Thermal Processing Revenue (USD Million) By Country (2021-2032)
Figure 15. South Korea Non Thermal Processing Revenue (USD Million) By Country (2021-2032)
Figure 16. Australia Non Thermal Processing Revenue (USD Million) By Country (2021-2032)
Figure 17. South East Asia Non Thermal Processing Revenue (USD Million) By Country (2021-2032)
Figure 18. South America Non Thermal Processing Revenue (USD Million) By Country (2021-2032)
Figure 19. Brazil Non Thermal Processing Revenue (USD Million) By Country (2021-2032)
Figure 20. Argentina Non Thermal Processing Revenue (USD Million) By Country (2021-2032)
Figure 21. Rest of Asia Pacific Non Thermal Processing Revenue (USD Million) By Country (2021-2032)
Figure 22. Middle East and Africa Non Thermal Processing Revenue (USD Million) By Region (2021-2032)
Figure 23. Saudi Arabia Non Thermal Processing Revenue (USD Million) By Region (2021-2032)
Figure 24. The UAE Non Thermal Processing Revenue (USD Million) By Region (2021-2032)
Figure 25. Rest of Middle East Non Thermal Processing Revenue (USD Million) By Region (2021-2032)
Figure 26. South Africa Non Thermal Processing Revenue (USD Million) By Region (2021-2032)
Figure 27. Africa Non Thermal Processing Revenue (USD Million) By Region (2021-2032)
Figure 28. North America Non Thermal Processing Revenue (USD Million) By Type (2021-2032)
Figure 29. North America Non Thermal Processing Revenue (USD Million) By Application (2021-2032)
Figure 30. North America Non Thermal Processing Revenue (USD Million) By Product (2021-2032)
Figure 31. Europe Non Thermal Processing Revenue (USD Million) By Type (2021-2032)
Figure 32. Europe Non Thermal Processing Revenue (USD Million) By Application (2021-2032)
Figure 33. Europe Non Thermal Processing Revenue (USD Million) By Product (2021-2032)
Figure 34. Asia Pacific Non Thermal Processing Revenue (USD Million) By Type (2021-2032)
Figure 35. Asia Pacific Non Thermal Processing Revenue (USD Million) By Application (2021-2032)
Figure 36. Asia Pacific Non Thermal Processing Revenue (USD Million) By Product (2021-2032)
Figure 37. South America Non Thermal Processing Revenue (USD Million) By Type (2021-2032)
Figure 38. South America Non Thermal Processing Revenue (USD Million) By Application (2021-2032)
Figure 39. South America Non Thermal Processing Revenue (USD Million) By Product (2021-2032)
Figure 40. Middle East and Africa Non Thermal Processing Revenue (USD Million) By Type (2021-2032)
Figure 41. Middle East and Africa Non Thermal Processing Revenue (USD Million) By Application (2021-2032)
Figure 42. Middle East and Africa Non Thermal Processing Revenue (USD Million) By Product (2021-2032)
By Food
Meat & seafood
Fruits & vegetables
Beverages
Others
By Technology
HPP
PEF
Ultrasonic
Irradiation
Cold plasma
Others
By Function
Quality assurance
Microbial inactivation
Cutting
Emulsification & homogenization
Cleaning
Others
Countries Analyzed
North America (US, Canada, Mexico)
Europe (Germany, UK, France, Spain, Italy, Russia, Rest of Europe)
Asia Pacific (China, India, Japan, South Korea, Australia, South East Asia, Rest of Asia)
South America (Brazil, Argentina, Rest of South America)
Middle East and Africa (Saudi Arabia, UAE, Rest of Middle East, South Africa, Egypt, Rest of Africa)
