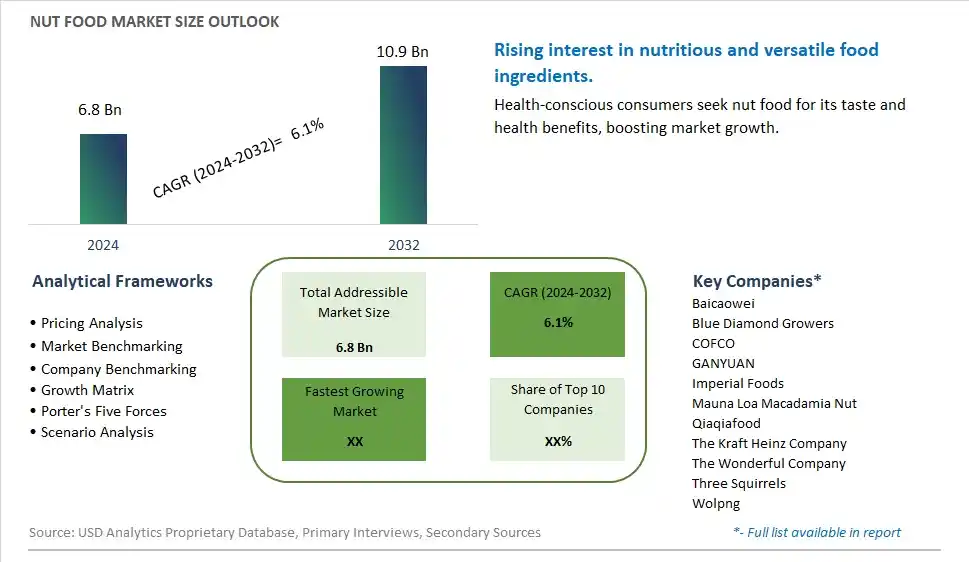
Global Nut Food Market Size is valued at $6.8 Billion in 2024 and is forecast to register a growth rate (CAGR) of 6.1% to reach $10.9 Billion by 2032.
The global Nut Food Market Comprehensive Study analyzes and forecasts the market size across 6 regions and 24 countries for diverse segments -By Type (Almonds, Cashews, Macadamia Nuts, Pecans, Walnuts, Mixed Nuts, Others), By Application (Below 25 Years, 25 to 40 Years, Above 40 Years)
An Introduction to Nut Food Market
The nut food market in 2024 is expanding rapidly, driven by the demand for nutritious and versatile nut-based products. Nuts, including almonds, walnuts, and cashews, are valued for their health benefits and are used in various applications, from snacks to dairy alternatives. The market benefits from innovations in processing and packaging technologies that enhance product quality and convenience. The trend towards clean label and natural ingredients is influencing product development. Increasing consumer interest in plant-based nutrition and the popularity of healthy snacking are further propelling market growth.
Nut Food Competitive Landscape
The market report analyses the leading companies in the industry including Baicaowei, Blue Diamond Growers, COFCO, GANYUAN, Imperial Foods, Mauna Loa Macadamia Nut, Qiaqiafood, The Kraft Heinz Company, The Wonderful Company, Three Squirrels, Wolpng, and Others.
Nut Food Market Dynamics
Nut Food Market Trend: Growing Popularity of Nut-Based Snacks and Foods
The most prominent trend in the Nut Food Market is the growing popularity of nut-based snacks and foods. Nuts are increasingly used in a variety of products, from snack bars and trail mixes to dairy alternatives and spreads, driven by their nutritional benefits and versatility. This trend is fueled by the rising demand for healthy and convenient snack options.
Nut Food Market Driver: Health Consciousness and Nutritional Benefits
A key driver in the Nut Food Market is health consciousness and the recognized nutritional benefits of nuts. As more individuals focus on improving their diet and incorporating nutrient-dense foods, there is a rising demand for nut-based products that provide healthy fats, protein, vitamins, and minerals. This demand supports the growth of the market as consumers seek nutritious and tasty food options.
Nut Food Market Opportunity: Innovation in Nut-Based Product Development
One significant opportunity in the Nut Food Market lies in innovation in nut-based product development. Companies can create new products that highlight the unique flavors and health benefits of different nuts, such as almond milk, cashew cheese, and hazelnut spreads. By offering diverse and innovative nut-based foods, manufacturers can attract a broader consumer base and drive market growth.
Nut Food Market Share Analysis- Largest Segment by Type
In the Nut Food Market, Almonds is the largest segment. Almonds hold a leading position due to their widespread popularity and versatility in various food products. They are commonly used as snacks, in baking, and as an ingredient in a variety of products, including dairy alternatives and protein bars. The high nutritional value of almonds, which includes a rich profile of healthy fats, proteins, and vitamins, contributes to their widespread consumption. Additionally, the extensive cultivation of almonds in major producing regions like California and the Mediterranean further supports their status as the largest segment in the nut food market.
Nut Food Market Share Analysis- Fastest Growing Segment by Application
In the Nut Food Market, the 25 to 40 Years age group is poised to grow the fastest over the next five years. This demographic is increasingly focused on health and wellness, with a growing preference for nutrient-dense foods such as nuts. As individuals in this age group are more health-conscious and often seek convenient, healthy snack options, the demand for nuts is rising. Additionally, this age group is more to incorporate nuts into their diets as part of a balanced and health-oriented lifestyle, driving growth in this segment.
Nut Food Market Segmentation
By Type
Almonds
Cashews
Macadamia Nuts
Pecans
Walnuts
Mixed Nuts
Others
By Application
Below 25 Years
25 to 40 Years
Above 40 Years
Countries Analyzed
North America (US, Canada, Mexico)
Europe (Germany, UK, France, Spain, Italy, Russia, Rest of Europe)
Asia Pacific (China, India, Japan, South Korea, Australia, South East Asia, Rest of Asia)
South America (Brazil, Argentina, Rest of South America)
Middle East and Africa (Saudi Arabia, UAE, Rest of Middle East, South Africa, Egypt, Rest of Africa)
Nut Food Companies Profiled in the Study
Baicaowei
Blue Diamond Growers
COFCO
GANYUAN
Imperial Foods
Mauna Loa Macadamia Nut
Qiaqiafood
The Kraft Heinz Company
The Wonderful Company
Three Squirrels
Wolpng
*- List Not Exhaustive
Chapter 1. TABLE OF CONTENTS
Chapter 2. Introduction to Nut Food Market
2.1. Market Overview
2.2. Key Statistics and Report Highlights
2.3. Scope of the Comprehensive Study
2.3.1. Market Definition
2.3.2 Countries and Regions Covered
2.3.3 Research Objective
2.3.4 Units, Currency, and Conversions
2.3.5 Industry Value Chain
2.4. Key Market Segments
2.5. Key Companies
2.6. Study Period
Chapter 3. Strategic Analysis Review
3.1. Nut Food Pricing Analysis and Forecast
3.2. Porter’s Five Forces
3.3. Market Ecosystem
3.4. SWOT Analysis
3.5. Regulatory Scenario
3.3. Effects of Inflation, Russia-Ukraine War, moderating economic growth, and other macroeconomic factors
Chapter 4. Competitive Landscape
4.1. Market Share Analysis
4.1.1. Global Nut Food Market Share by Company, 2023
4.1.2. Product Offerings of Leading Nut Food Companies
4.2. Market Entropy
4.2.1. New Product Launches in the Industry
4.2.2. Mergers, Acquisitions, Joint ventures, and Partnerships
4.3. Key Strategies and Best Practices
Chapter 5. Global Market Projections: Best, Reference, and Low Case Scenarios
5.1. Growth Analysis- Case Scenario Definitions
5.2. Low Growth Case Scenario Forecasts
5.3. Reference Growth Case Scenario Forecasts
5.4. High Growth Case Scenario Forecasts
Chapter 6. Market Dynamics
6.1. Nut Food Market Drivers
6.2. Nut Food Market Challenges
6.6. Nut Food Market Opportunities
6.4. Nut Food Market Trends
Chapter 7. Global Nut Food Market Outlook Trends
7.1. Global Nut Food Revenue (USD Million) and CAGR (%) by Type (2021-2032)
7.2. Global Nut Food Revenue (USD Million) and CAGR (%) by Application (2021-2032)
7.3. Global Nut Food Revenue (USD Million) and CAGR (%) by Product (2021-2032)
By Type
Almonds
Cashews
Macadamia Nuts
Pecans
Walnuts
Mixed Nuts
Others
By Application
Below 25 Years
25 to 40 Years
Above 40 Years
Chapter 8. Global Nut Food Regional Analysis and Outlook
8.1. Global Nut Food Revenue (USD Million) By Regions (2021- 2032)
8.2. North America Nut Food Revenue (USD Million) by Country (2021-2032)
8.2.1. United States Nut Food Regional Analysis and Outlook
8.2.2. Canada Nut Food Regional Analysis and Outlook
8.2.3. Mexico Nut Food Regional Analysis and Outlook
8.3. Europe Nut Food Revenue (USD Million), by Country (2021-2032)
8.3.1. Germany Nut Food Regional Analysis and Outlook
8.3.2. France Nut Food Regional Analysis and Outlook
8.3.3. United Kingdom Nut Food Regional Analysis and Outlook
8.3.4. Spain Nut Food Regional Analysis and Outlook
8.3.5. Italy Nut Food Regional Analysis and Outlook
8.3.6. Russia Nut Food Regional Analysis and Outlook
8.3.7. Rest of Europe Nut Food Regional Analysis and Outlook
8.4. Asia Pacific Nut Food Revenue (USD Million) by Country (2021-2032)
8.4.1. China Nut Food Regional Analysis and Outlook
8.4.2. Japan Nut Food Regional Analysis and Outlook
8.4.3. India Nut Food Regional Analysis and Outlook
8.4.4. South Korea Nut Food Regional Analysis and Outlook
8.4.5. Australia Nut Food Regional Analysis and Outlook
8.4.6. South East Asia Nut Food Regional Analysis and Outlook
8.4.7. Rest of Asia Pacific Nut Food Regional Analysis and Outlook
8.5. South America Nut Food Revenue (USD Million), by Country (2021-2032)
8.5.1. Brazil Nut Food Regional Analysis and Outlook
8.5.2. Argentina Nut Food Regional Analysis and Outlook
8.5.3. Rest of South America Nut Food Regional Analysis and Outlook
8.6. Middle East and Africa Nut Food Revenue (USD Million) by Country (2021-2032)
8.6.1. Middle East Nut Food Regional Analysis and Outlook
8.6.2. Africa Nut Food Regional Analysis and Outlook
Chapter 9. North America Nut Food Analysis and Outlook
9.1. North America Nut Food Revenue (USD Million) by Segments (2021-2032)
9.1.1. North America Nut Food Revenue (USD Million) by Type (2021-2032)
9.1.2. North America Nut Food Revenue (USD Million) by Application (2021-2032)
9.1.3. North America Nut Food Revenue (USD Million) by Product (2021-2032)
By Type
Almonds
Cashews
Macadamia Nuts
Pecans
Walnuts
Mixed Nuts
Others
By Application
Below 25 Years
25 to 40 Years
Above 40 Years
Chapter 10. Europe Nut Food Analysis and Outlook
10.1. Europe Nut Food Revenue (USD Million), by Segments (USD Million) (2021-2032)
10.1.1. Europe Nut Food Revenue (USD Million) by Type (2021-2032)
10.1.2. Europe Nut Food Revenue (USD Million) by Application (2021-2032)
10.1.3. Europe Nut Food Revenue (USD Million) by Product (2021-2032)
By Type
Almonds
Cashews
Macadamia Nuts
Pecans
Walnuts
Mixed Nuts
Others
By Application
Below 25 Years
25 to 40 Years
Above 40 Years
Chapter 11. Asia Pacific Nut Food Analysis and Outlook
11.1. Asia Pacific Nut Food Revenue (USD Million), and Revenue (USD Million) by Segments (2021-2032)
11.1.1. Asia Pacific Nut Food Revenue (USD Million) by Type (2021-2032)
11.1.2. Asia Pacific Nut Food Revenue (USD Million) by Application (2021-2032)
11.1.3. Asia Pacific Nut Food Revenue (USD Million) by Product (2021-2032)
By Type
Almonds
Cashews
Macadamia Nuts
Pecans
Walnuts
Mixed Nuts
Others
By Application
Below 25 Years
25 to 40 Years
Above 40 Years
Chapter 12. South America Nut Food Analysis and Outlook
12.1. South America Nut Food Revenue (USD Million), by Segments (2021-2032)
12.1.1. South America Nut Food Revenue (USD Million) by Type (2021-2032)
12.1.2. South America Nut Food Revenue (USD Million) by Application (2021-2032)
12.1.3. South America Nut Food Revenue (USD Million) by Product (2021-2032)
By Type
Almonds
Cashews
Macadamia Nuts
Pecans
Walnuts
Mixed Nuts
Others
By Application
Below 25 Years
25 to 40 Years
Above 40 Years
Chapter 13. Middle East and Africa Nut Food Analysis and Outlook
13.1. Middle East and Africa Nut Food Revenue (USD Million), by Segments (2021-2032)
13.1.1. Middle East and Africa Nut Food Revenue (USD Million) by Type (2021-2032)
13.1.2. Middle East and Africa Nut Food Revenue (USD Million) by Application (2021-2032)
13.1.3. Middle East and Africa Nut Food Revenue (USD Million) by Product (2021-2032)
By Type
Almonds
Cashews
Macadamia Nuts
Pecans
Walnuts
Mixed Nuts
Others
By Application
Below 25 Years
25 to 40 Years
Above 40 Years
Chapter 14. Nut Food Company Profiles
14.1 Business Overview
14.2 Product Profiles
14.3 SWOT Profiles
14.5 Recent Developments
14.6 Financial Profile
List of Companies
Baicaowei
Blue Diamond Growers
COFCO
GANYUAN
Imperial Foods
Mauna Loa Macadamia Nut
Qiaqiafood
The Kraft Heinz Company
The Wonderful Company
Three Squirrels
Wolpng
15. Methodology and Data Sources
15.1 Customization Offerings
15.2 Subscription Services
15.3 Related Reports
15.4 Publisher Expertise
LIST OF TABLES
Table 1 Market Segmentation Analysis
Table 2 Global Nut Food Market Share of Leading Companies, 2023
Table 3 Product Offerings of Leading Companies
Table 4 Low Growth Scenario Forecasts
Table 5 Reference Case Growth Scenario
Table 6 High Growth Case Scenario
Table 7 Global Nut Food Revenue (USD Million) And CAGR (%) By Type (2021-2032)
Table 8 Global Nut Food Revenue (USD Million) And CAGR (%) By Application (2021-2032)
Table 9 Global Nut Food Revenue (USD Million) And CAGR (%) By Product (2021-2032)
Table 10 Global Nut Food Market Revenue (USD Million) By Regions (2021-2032)
Table 11 Global Nut Food Market Share (%) By Regions (2021-2032)
Table 12 North America Nut Food Revenue (USD Million) By Country (2021-2032)
Table 13 Europe Nut Food Revenue (USD Million) By Country (2021-2032)
Table 14 Asia Pacific Nut Food Revenue (USD Million) By Country (2021-2032)
Table 15 South America Nut Food Revenue (USD Million) By Country (2021-2032)
Table 16 Middle East and Africa Nut Food Revenue (USD Million) By Region (2021-2032)
Table 17 North America Nut Food Revenue (USD Million) By Type (2021-2032)
Table 18 North America Nut Food Revenue (USD Million) By Application (2021-2032)
Table 19 North America Nut Food Revenue (USD Million) By Product (2021-2032)
Table 20 Europe Nut Food Revenue (USD Million) By Type (2021-2032)
Table 21 Europe Nut Food Revenue (USD Million) By Application (2021-2032)
Table 22 Europe Nut Food Revenue (USD Million) By Product (2021-2032)
Table 23 Asia Pacific Nut Food Revenue (USD Million) By Type (2021-2032)
Table 24 Asia Pacific Nut Food Revenue (USD Million) By Application (2021-2032)
Table 25 Asia Pacific Nut Food Revenue (USD Million) By Product (2021-2032)
Table 26 South America Nut Food Revenue (USD Million) By Type (2021-2032)
Table 27 South America Nut Food Revenue (USD Million) By Application (2021-2032)
Table 28 South America Nut Food Revenue (USD Million) By Product (2021-2032)
Table 29 Middle East and Africa Nut Food Revenue (USD Million) By Type (2021-2032)
Table 30 Middle East and Africa Nut Food Revenue (USD Million) By Application (2021-2032)
Table 31 Middle East and Africa Nut Food Revenue (USD Million) By Product (2021-2032)
LIST OF FIGURES
Figure 1. Market Scope
Figure 2. Pricing Forecasts Per Unit, 2023- 2032
Figure 3. Porter’s Five Forces
Figure 4. Global Nut Food Market Revenue (USD Million) By Regions (2021-2032)
Figure 5. Global Nut Food Market Share (%) By Regions (2023)
Figure 6. North America Nut Food Revenue (USD Million) By Country (2021-2032)
Figure 7. United States Nut Food Revenue (USD Million) By Country (2021-2032)
Figure 8. Canada Nut Food Revenue (USD Million) By Country (2021-2032)
Figure 9. Mexico Nut Food Revenue (USD Million) By Country (2021-2032)
Figure 10. Europe Nut Food Revenue (USD Million) By Country (2021-2032)
Figure 11. Germany Nut Food Revenue (USD Million) By Country (2021-2032)
Figure 12. France Nut Food Revenue (USD Million) By Country (2021-2032)
Figure 13. United Kingdom Nut Food Revenue (USD Million) By Country (2021-2032)
Figure 14. Spain Nut Food Revenue (USD Million) By Country (2021-2032)
Figure 15. Italy Nut Food Revenue (USD Million) By Country (2021-2032)
Figure 16. Russia Nut Food Revenue (USD Million) By Country (2021-2032)
Figure 17. Rest of Europe Nut Food Revenue (USD Million) By Country (2021-2032)
Figure 11. Asia Pacific Nut Food Revenue (USD Million) By Country (2021-2032)
Figure 12. China Nut Food Revenue (USD Million) By Country (2021-2032)
Figure 13. Japan Nut Food Revenue (USD Million) By Country (2021-2032)
Figure 14. India Nut Food Revenue (USD Million) By Country (2021-2032)
Figure 15. South Korea Nut Food Revenue (USD Million) By Country (2021-2032)
Figure 16. Australia Nut Food Revenue (USD Million) By Country (2021-2032)
Figure 17. South East Asia Nut Food Revenue (USD Million) By Country (2021-2032)
Figure 18. South America Nut Food Revenue (USD Million) By Country (2021-2032)
Figure 19. Brazil Nut Food Revenue (USD Million) By Country (2021-2032)
Figure 20. Argentina Nut Food Revenue (USD Million) By Country (2021-2032)
Figure 21. Rest of Asia Pacific Nut Food Revenue (USD Million) By Country (2021-2032)
Figure 22. Middle East and Africa Nut Food Revenue (USD Million) By Region (2021-2032)
Figure 23. Saudi Arabia Nut Food Revenue (USD Million) By Region (2021-2032)
Figure 24. The UAE Nut Food Revenue (USD Million) By Region (2021-2032)
Figure 25. Rest of Middle East Nut Food Revenue (USD Million) By Region (2021-2032)
Figure 26. South Africa Nut Food Revenue (USD Million) By Region (2021-2032)
Figure 27. Africa Nut Food Revenue (USD Million) By Region (2021-2032)
Figure 28. North America Nut Food Revenue (USD Million) By Type (2021-2032)
Figure 29. North America Nut Food Revenue (USD Million) By Application (2021-2032)
Figure 30. North America Nut Food Revenue (USD Million) By Product (2021-2032)
Figure 31. Europe Nut Food Revenue (USD Million) By Type (2021-2032)
Figure 32. Europe Nut Food Revenue (USD Million) By Application (2021-2032)
Figure 33. Europe Nut Food Revenue (USD Million) By Product (2021-2032)
Figure 34. Asia Pacific Nut Food Revenue (USD Million) By Type (2021-2032)
Figure 35. Asia Pacific Nut Food Revenue (USD Million) By Application (2021-2032)
Figure 36. Asia Pacific Nut Food Revenue (USD Million) By Product (2021-2032)
Figure 37. South America Nut Food Revenue (USD Million) By Type (2021-2032)
Figure 38. South America Nut Food Revenue (USD Million) By Application (2021-2032)
Figure 39. South America Nut Food Revenue (USD Million) By Product (2021-2032)
Figure 40. Middle East and Africa Nut Food Revenue (USD Million) By Type (2021-2032)
Figure 41. Middle East and Africa Nut Food Revenue (USD Million) By Application (2021-2032)
Figure 42. Middle East and Africa Nut Food Revenue (USD Million) By Product (2021-2032)
By Type
Almonds
Cashews
Macadamia Nuts
Pecans
Walnuts
Mixed Nuts
Others
By Application
Below 25 Years
25 to 40 Years
Above 40 Years
Countries Analyzed
North America (US, Canada, Mexico)
Europe (Germany, UK, France, Spain, Italy, Russia, Rest of Europe)
Asia Pacific (China, India, Japan, South Korea, Australia, South East Asia, Rest of Asia)
South America (Brazil, Argentina, Rest of South America)
Middle East and Africa (Saudi Arabia, UAE, Rest of Middle East, South Africa, Egypt, Rest of Africa)
