<h3><Strong><i>Global Nut-free Cookies Market Size is valued at $1.16 Billion in 2024 and is forecast to register a growth rate (CAGR) of 6.4% to reach $1.9 Billion by 2032.</h3></Strong></i>The global Nut-free Cookies Market Comprehensive Study analyzes and forecasts the market size across 6 regions and 24 countries for diverse segments -By Product (Chocolate, Vanilla, Gingerbread, Others), By Distribution Channel (Offline, Online)
<h2>An Introduction to Nut-free Cookies Market</h2>In 2024, the nut-free cookies market is expanding, driven by increasing awareness of food allergies and the growing demand for allergy-friendly products. Nut-free cookies provide a safe and delicious option for individuals with nut allergies, ensuring that they can enjoy a variety of flavors and textures without the risk of allergic reactions. The market includes a wide range of products, from traditional chocolate chip and oatmeal cookies to innovative and gourmet options, catering to diverse taste preferences. The trend towards clean labeling and natural ingredients is particularly strong in this market, with consumers seeking cookies that are free from artificial additives, preservatives, and GMOs. Additionally, the rise of specialty diets and the focus on inclusive eating have further propelled demand for nut-free cookies. As awareness of food allergies continues to grow, the nut-free cookies market is set for sustained growth, supported by innovations in product development and expanding availability in both retail and foodservice channels.
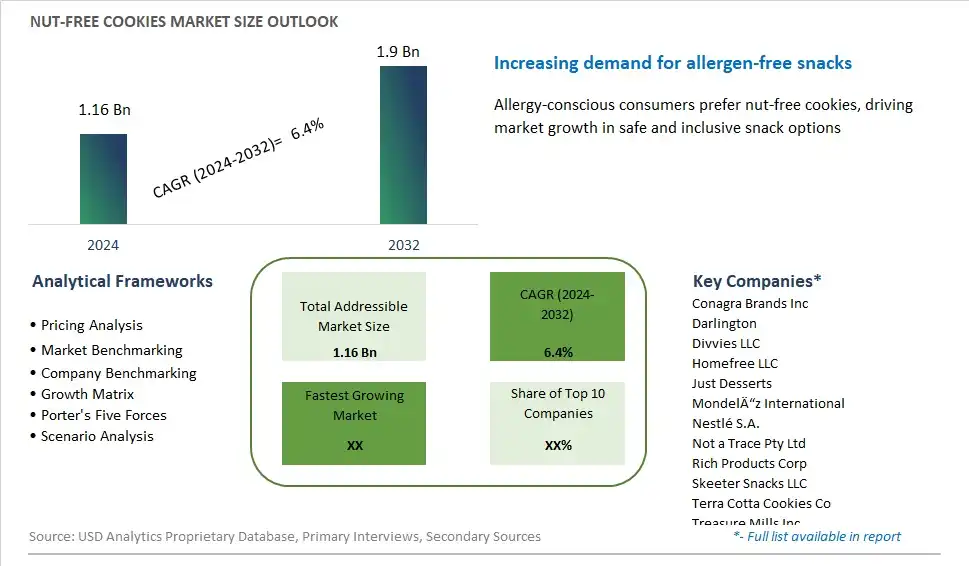
<h2>Nut free Cookies Competitive Landscape</h2>The market report analyses the leading companies in the industry including Conagra Brands Inc, Darlington, Divvies LLC, Homefree LLC, Just Desserts, MondelÄ“z International, Nestlé S.A., Not a Trace Pty Ltd, Rich Products Corp, Skeeter Snacks LLC, Terra Cotta Cookies Co, Treasure Mills Inc, and Others.<h2>Nut free Cookies Market Dynamics</h2><h3>Market Trend: Rising Demand for Allergen-Free Foods</h3> The most prominent trend in the Nut-Free Cookies Market is the rising demand for allergen-free foods. With increasing awareness of food allergies, particularly among children, parents and consumers are seeking out safe and allergen-free snack options. Nut-free cookies provide a convenient and tasty solution for those with nut allergies, as well as for schools and public spaces where allergen restrictions are enforced. This trend is driving the development of a wide variety of nut-free cookie options to cater to this growing <h3>Market Driver: Stringent Food Safety Regulations</h3> Stringent food safety regulations are a major driver of the Nut-Free Cookies Market. Governments and regulatory bodies are imposing strict guidelines on food labeling and allergen management to protect consumers with food allergies. These regulations require manufacturers to clearly label and ensure the safety of their products, driving the demand for certified nut-free cookies. Compliance with these regulations not only ensures consumer safety but also builds trust and confidence in nut-free cookie brands<h3>Market Opportunity: Introduction of Healthier Ingredients</h3> A significant opportunity in the Nut-Free Cookies Market lies in the introduction of healthier ingredients. As consumers become more health-conscious, there is a growing demand for nut-free cookies made with wholesome and nutritious ingredients. Companies can capitalize on this by developing products that use whole grains, natural sweeteners, and added functional ingredients such as protein and fiber. This not only caters to the demand for allergen-free products but also aligns with the broader health and wellness trend<h3>Nut-Free Cookies Market Share Analysis: Product (Chocolate, Vanilla, Gingerbread, Others)</h3>The chocolate segment is projected to be the fastest-growing in the Nut-Free Cookies Market by product to 2032. Chocolate nut-free cookies are highly popular due to their rich and indulgent flavor, appealing to a broad consumer base, including those with nut allergies and dietary restrictions. The demand for chocolate nut-free cookies is driven by the increasing awareness of food allergies and the growing preference for safe and delicious snack options. Additionally, the rise of premium and gourmet cookie brands offering high-quality chocolate nut-free cookies further boosts this segment's growth. The availability of innovative and healthier formulations, such as gluten-free and organic options, also supports the expansion of the chocolate nut-free cookie segment.<h3>Nut-Free Cookies Market Share Analysis: Distribution Channel (Offline, Online)</h3>The online distribution channel is expected to be the fastest-growing segment in the Nut-Free Cookies Market by distribution channel to 2032. The convenience and accessibility of online shopping, combined with the growing consumer preference for e-commerce, drive the rapid growth of this segment. Online platforms offer a wide variety of nut-free cookies, detailed product descriptions, and customer reviews, making it easier for consumers to make informed purchasing decisions. The COVID-19 pandemic has further accelerated the shift towards online shopping, as consumers seek contactless and convenient ways to purchase their favorite snacks. Subscription services and direct-to-consumer models also contribute to the segment's expansion, providing consumers with regular deliveries of their preferred nut-free cookies.<h2>Nut free Cookies Market Segmentation</h2><Strong>By Product</Strong>
Chocolate
Vanilla
Gingerbread
Others
<Strong>By Distribution Channel</Strong>
Offline
Online
<Strong>Countries Analyzed</Strong>
North America (US, Canada, Mexico)
Europe (Germany, UK, France, Spain, Italy, Russia, Rest of Europe)
Asia Pacific (China, India, Japan, South Korea, Australia, South East Asia, Rest of Asia)
South America (Brazil, Argentina, Rest of South America)
Middle East and Africa (Saudi Arabia, UAE, Rest of Middle East, South Africa, Egypt, Rest of Africa)<h2>Nut free Cookies Companies Profiled in the Study</h2>Conagra Brands Inc
Darlington
Divvies LLC
Homefree LLC
Just Desserts
Mondelēz International
Nestlé S.A.
Not a Trace Pty Ltd
Rich Products Corp
Skeeter Snacks LLC
Terra Cotta Cookies Co
Treasure Mills Inc
*- List Not Exhaustive
<Strong>Chapter 1. TABLE OF CONTENTS</Strong>
<Strong>Chapter 2. Introduction to Nut free Cookies Market </Strong>
2.1. Market Overview
2.2. Key Statistics and Report Highlights
2.3. Scope of the Comprehensive Study
2.3.1. Market Definition
2.3.2 Countries and Regions Covered
2.3.3 Research Objective
2.3.4 Units, Currency, and Conversions
2.3.5 Industry Value Chain
2.4. Key Market Segments
2.5. Key Companies
2.6. Study Period
<Strong>Chapter 3. Strategic Analysis Review</Strong>
3.1. Nut free Cookies Pricing Analysis and Forecast
3.2. Porter’s Five Forces
3.3. Market Ecosystem
3.4. SWOT Analysis
3.5. Regulatory Scenario
3.3. Effects of Inflation, Russia-Ukraine War, moderating economic growth, and other macroeconomic factors
<Strong>Chapter 4. Competitive Landscape</Strong>
4.1. Market Share Analysis
4.1.1. Global Nut free Cookies Market Share by Company, 2023
4.1.2. Product Offerings of Leading Nut free Cookies Companies
4.2. Market Entropy
4.2.1. New Product Launches in the Industry
4.2.2. Mergers, Acquisitions, Joint ventures, and Partnerships
4.3. Key Strategies and Best Practices
<Strong>Chapter 5. Global Market Projections: Best, Reference, and Low Case Scenarios</Strong>
5.1. Growth Analysis- Case Scenario Definitions
5.2. Low Growth Case Scenario Forecasts
5.3. Reference Growth Case Scenario Forecasts
5.4. High Growth Case Scenario Forecasts
<Strong>Chapter 6. Market Dynamics</Strong>
6.1. Nut free Cookies Market Drivers
6.2. Nut free Cookies Market Challenges
6.6. Nut free Cookies Market Opportunities
6.4. Nut free Cookies Market Trends
<Strong>Chapter 7. Global Nut free Cookies Market Outlook Trends</Strong>
7.1. Global Nut free Cookies Revenue (USD Million) and CAGR (%) by Type (2021-2032)
7.2. Global Nut free Cookies Revenue (USD Million) and CAGR (%) by Application (2021-2032)
7.3. Global Nut free Cookies Revenue (USD Million) and CAGR (%) by Product (2021-2032)
<Strong>By Product</Strong>
Chocolate
Vanilla
Gingerbread
Others
<Strong>By Distribution Channel</Strong>
Offline
Online
<Strong>Chapter 8. Global Nut free Cookies Regional Analysis and Outlook</Strong>
8.1. Global Nut free Cookies Revenue (USD Million) By Regions (2021- 2032)
8.2. North America Nut free Cookies Revenue (USD Million) by Country (2021-2032)
8.2.1. United States Nut free Cookies Regional Analysis and Outlook
8.2.2. Canada Nut free Cookies Regional Analysis and Outlook
8.2.3. Mexico Nut free Cookies Regional Analysis and Outlook
8.3. Europe Nut free Cookies Revenue (USD Million), by Country (2021-2032)
8.3.1. Germany Nut free Cookies Regional Analysis and Outlook
8.3.2. France Nut free Cookies Regional Analysis and Outlook
8.3.3. United Kingdom Nut free Cookies Regional Analysis and Outlook
8.3.4. Spain Nut free Cookies Regional Analysis and Outlook
8.3.5. Italy Nut free Cookies Regional Analysis and Outlook
8.3.6. Russia Nut free Cookies Regional Analysis and Outlook
8.3.7. Rest of Europe Nut free Cookies Regional Analysis and Outlook
8.4. Asia Pacific Nut free Cookies Revenue (USD Million) by Country (2021-2032)
8.4.1. China Nut free Cookies Regional Analysis and Outlook
8.4.2. Japan Nut free Cookies Regional Analysis and Outlook
8.4.3. India Nut free Cookies Regional Analysis and Outlook
8.4.4. South Korea Nut free Cookies Regional Analysis and Outlook
8.4.5. Australia Nut free Cookies Regional Analysis and Outlook
8.4.6. South East Asia Nut free Cookies Regional Analysis and Outlook
8.4.7. Rest of Asia Pacific Nut free Cookies Regional Analysis and Outlook
8.5. South America Nut free Cookies Revenue (USD Million), by Country (2021-2032)
8.5.1. Brazil Nut free Cookies Regional Analysis and Outlook
8.5.2. Argentina Nut free Cookies Regional Analysis and Outlook
8.5.3. Rest of South America Nut free Cookies Regional Analysis and Outlook
8.6. Middle East and Africa Nut free Cookies Revenue (USD Million) by Country (2021-2032)
8.6.1. Middle East Nut free Cookies Regional Analysis and Outlook
8.6.2. Africa Nut free Cookies Regional Analysis and Outlook
<Strong>Chapter 9. North America Nut free Cookies Analysis and Outlook</Strong>
9.1. North America Nut free Cookies Revenue (USD Million) by Segments (2021-2032)
9.1.1. North America Nut free Cookies Revenue (USD Million) by Type (2021-2032)
9.1.2. North America Nut free Cookies Revenue (USD Million) by Application (2021-2032)
9.1.3. North America Nut free Cookies Revenue (USD Million) by Product (2021-2032)
<Strong>By Product</Strong>
Chocolate
Vanilla
Gingerbread
Others
<Strong>By Distribution Channel</Strong>
Offline
Online
<Strong>Chapter 10. Europe Nut free Cookies Analysis and Outlook</Strong>
10.1. Europe Nut free Cookies Revenue (USD Million), by Segments (USD Million) (2021-2032)
10.1.1. Europe Nut free Cookies Revenue (USD Million) by Type (2021-2032)
10.1.2. Europe Nut free Cookies Revenue (USD Million) by Application (2021-2032)
10.1.3. Europe Nut free Cookies Revenue (USD Million) by Product (2021-2032)
<Strong>By Product</Strong>
Chocolate
Vanilla
Gingerbread
Others
<Strong>By Distribution Channel</Strong>
Offline
Online
<Strong>Chapter 11. Asia Pacific Nut free Cookies Analysis and Outlook</Strong>
11.1. Asia Pacific Nut free Cookies Revenue (USD Million), and Revenue (USD Million) by Segments (2021-2032)
11.1.1. Asia Pacific Nut free Cookies Revenue (USD Million) by Type (2021-2032)
11.1.2. Asia Pacific Nut free Cookies Revenue (USD Million) by Application (2021-2032)
11.1.3. Asia Pacific Nut free Cookies Revenue (USD Million) by Product (2021-2032)
<Strong>By Product</Strong>
Chocolate
Vanilla
Gingerbread
Others
<Strong>By Distribution Channel</Strong>
Offline
Online
<Strong>Chapter 12. South America Nut free Cookies Analysis and Outlook</Strong>
12.1. South America Nut free Cookies Revenue (USD Million), by Segments (2021-2032)
12.1.1. South America Nut free Cookies Revenue (USD Million) by Type (2021-2032)
12.1.2. South America Nut free Cookies Revenue (USD Million) by Application (2021-2032)
12.1.3. South America Nut free Cookies Revenue (USD Million) by Product (2021-2032)
<Strong>By Product</Strong>
Chocolate
Vanilla
Gingerbread
Others
<Strong>By Distribution Channel</Strong>
Offline
Online
<Strong>Chapter 13. Middle East and Africa Nut free Cookies Analysis and Outlook</Strong>
13.1. Middle East and Africa Nut free Cookies Revenue (USD Million), by Segments (2021-2032)
13.1.1. Middle East and Africa Nut free Cookies Revenue (USD Million) by Type (2021-2032)
13.1.2. Middle East and Africa Nut free Cookies Revenue (USD Million) by Application (2021-2032)
13.1.3. Middle East and Africa Nut free Cookies Revenue (USD Million) by Product (2021-2032)
<Strong>By Product</Strong>
Chocolate
Vanilla
Gingerbread
Others
<Strong>By Distribution Channel</Strong>
Offline
Online
<Strong>Chapter 14. Nut free Cookies Company Profiles</Strong>
14.1 Business Overview
14.2 Product Profiles
14.3 SWOT Profiles
14.5 Recent Developments
14.6 Financial Profile
List of Companies
Conagra Brands Inc
Darlington
Divvies LLC
Homefree LLC
Just Desserts
Mondelēz International
Nestlé S.A.
Not a Trace Pty Ltd
Rich Products Corp
Skeeter Snacks LLC
Terra Cotta Cookies Co
Treasure Mills Inc
<Strong>15. Methodology and Data Sources</Strong>
15.1 Customization Offerings
15.2 Subscription Services
15.3 Related Reports
15.4 Publisher Expertise
<Strong>LIST OF TABLES</Strong>
Table 1 Market Segmentation Analysis
Table 2 Global Nut free Cookies Market Share of Leading Companies, 2023
Table 3 Product Offerings of Leading Companies
Table 4 Low Growth Scenario Forecasts
Table 5 Reference Case Growth Scenario
Table 6 High Growth Case Scenario
Table 7 Global Nut free Cookies Revenue (USD Million) And CAGR (%) By Type (2021-2032)
Table 8 Global Nut free Cookies Revenue (USD Million) And CAGR (%) By Application (2021-2032)
Table 9 Global Nut free Cookies Revenue (USD Million) And CAGR (%) By Product (2021-2032)
Table 10 Global Nut free Cookies Market Revenue (USD Million) By Regions (2021-2032)
Table 11 Global Nut free Cookies Market Share (%) By Regions (2021-2032)
Table 12 North America Nut free Cookies Revenue (USD Million) By Country (2021-2032)
Table 13 Europe Nut free Cookies Revenue (USD Million) By Country (2021-2032)
Table 14 Asia Pacific Nut free Cookies Revenue (USD Million) By Country (2021-2032)
Table 15 South America Nut free Cookies Revenue (USD Million) By Country (2021-2032)
Table 16 Middle East and Africa Nut free Cookies Revenue (USD Million) By Region (2021-2032)
Table 17 North America Nut free Cookies Revenue (USD Million) By Type (2021-2032)
Table 18 North America Nut free Cookies Revenue (USD Million) By Application (2021-2032)
Table 19 North America Nut free Cookies Revenue (USD Million) By Product (2021-2032)
Table 20 Europe Nut free Cookies Revenue (USD Million) By Type (2021-2032)
Table 21 Europe Nut free Cookies Revenue (USD Million) By Application (2021-2032)
Table 22 Europe Nut free Cookies Revenue (USD Million) By Product (2021-2032)
Table 23 Asia Pacific Nut free Cookies Revenue (USD Million) By Type (2021-2032)
Table 24 Asia Pacific Nut free Cookies Revenue (USD Million) By Application (2021-2032)
Table 25 Asia Pacific Nut free Cookies Revenue (USD Million) By Product (2021-2032)
Table 26 South America Nut free Cookies Revenue (USD Million) By Type (2021-2032)
Table 27 South America Nut free Cookies Revenue (USD Million) By Application (2021-2032)
Table 28 South America Nut free Cookies Revenue (USD Million) By Product (2021-2032)
Table 29 Middle East and Africa Nut free Cookies Revenue (USD Million) By Type (2021-2032)
Table 30 Middle East and Africa Nut free Cookies Revenue (USD Million) By Application (2021-2032)
Table 31 Middle East and Africa Nut free Cookies Revenue (USD Million) By Product (2021-2032)
<Strong>LIST OF FIGURES</Strong>
Figure 1. Market Scope
Figure 2. Pricing Forecasts Per Unit, 2023- 2032
Figure 3. Porter’s Five Forces
Figure 4. Global Nut free Cookies Market Revenue (USD Million) By Regions (2021-2032)
Figure 5. Global Nut free Cookies Market Share (%) By Regions (2023)
Figure 6. North America Nut free Cookies Revenue (USD Million) By Country (2021-2032)
Figure 7. United States Nut free Cookies Revenue (USD Million) By Country (2021-2032)
Figure 8. Canada Nut free Cookies Revenue (USD Million) By Country (2021-2032)
Figure 9. Mexico Nut free Cookies Revenue (USD Million) By Country (2021-2032)
Figure 10. Europe Nut free Cookies Revenue (USD Million) By Country (2021-2032)
Figure 11. Germany Nut free Cookies Revenue (USD Million) By Country (2021-2032)
Figure 12. France Nut free Cookies Revenue (USD Million) By Country (2021-2032)
Figure 13. United Kingdom Nut free Cookies Revenue (USD Million) By Country (2021-2032)
Figure 14. Spain Nut free Cookies Revenue (USD Million) By Country (2021-2032)
Figure 15. Italy Nut free Cookies Revenue (USD Million) By Country (2021-2032)
Figure 16. Russia Nut free Cookies Revenue (USD Million) By Country (2021-2032)
Figure 17. Rest of Europe Nut free Cookies Revenue (USD Million) By Country (2021-2032)
Figure 11. Asia Pacific Nut free Cookies Revenue (USD Million) By Country (2021-2032)
Figure 12. China Nut free Cookies Revenue (USD Million) By Country (2021-2032)
Figure 13. Japan Nut free Cookies Revenue (USD Million) By Country (2021-2032)
Figure 14. India Nut free Cookies Revenue (USD Million) By Country (2021-2032)
Figure 15. South Korea Nut free Cookies Revenue (USD Million) By Country (2021-2032)
Figure 16. Australia Nut free Cookies Revenue (USD Million) By Country (2021-2032)
Figure 17. South East Asia Nut free Cookies Revenue (USD Million) By Country (2021-2032)
Figure 18. South America Nut free Cookies Revenue (USD Million) By Country (2021-2032)
Figure 19. Brazil Nut free Cookies Revenue (USD Million) By Country (2021-2032)
Figure 20. Argentina Nut free Cookies Revenue (USD Million) By Country (2021-2032)
Figure 21. Rest of Asia Pacific Nut free Cookies Revenue (USD Million) By Country (2021-2032)
Figure 22. Middle East and Africa Nut free Cookies Revenue (USD Million) By Region (2021-2032)
Figure 23. Saudi Arabia Nut free Cookies Revenue (USD Million) By Region (2021-2032)
Figure 24. The UAE Nut free Cookies Revenue (USD Million) By Region (2021-2032)
Figure 25. Rest of Middle East Nut free Cookies Revenue (USD Million) By Region (2021-2032)
Figure 26. South Africa Nut free Cookies Revenue (USD Million) By Region (2021-2032)
Figure 27. Africa Nut free Cookies Revenue (USD Million) By Region (2021-2032)
Figure 28. North America Nut free Cookies Revenue (USD Million) By Type (2021-2032)
Figure 29. North America Nut free Cookies Revenue (USD Million) By Application (2021-2032)
Figure 30. North America Nut free Cookies Revenue (USD Million) By Product (2021-2032)
Figure 31. Europe Nut free Cookies Revenue (USD Million) By Type (2021-2032)
Figure 32. Europe Nut free Cookies Revenue (USD Million) By Application (2021-2032)
Figure 33. Europe Nut free Cookies Revenue (USD Million) By Product (2021-2032)
Figure 34. Asia Pacific Nut free Cookies Revenue (USD Million) By Type (2021-2032)
Figure 35. Asia Pacific Nut free Cookies Revenue (USD Million) By Application (2021-2032)
Figure 36. Asia Pacific Nut free Cookies Revenue (USD Million) By Product (2021-2032)
Figure 37. South America Nut free Cookies Revenue (USD Million) By Type (2021-2032)
Figure 38. South America Nut free Cookies Revenue (USD Million) By Application (2021-2032)
Figure 39. South America Nut free Cookies Revenue (USD Million) By Product (2021-2032)
Figure 40. Middle East and Africa Nut free Cookies Revenue (USD Million) By Type (2021-2032)
Figure 41. Middle East and Africa Nut free Cookies Revenue (USD Million) By Application (2021-2032)
Figure 42. Middle East and Africa Nut free Cookies Revenue (USD Million) By Product (2021-2032)
