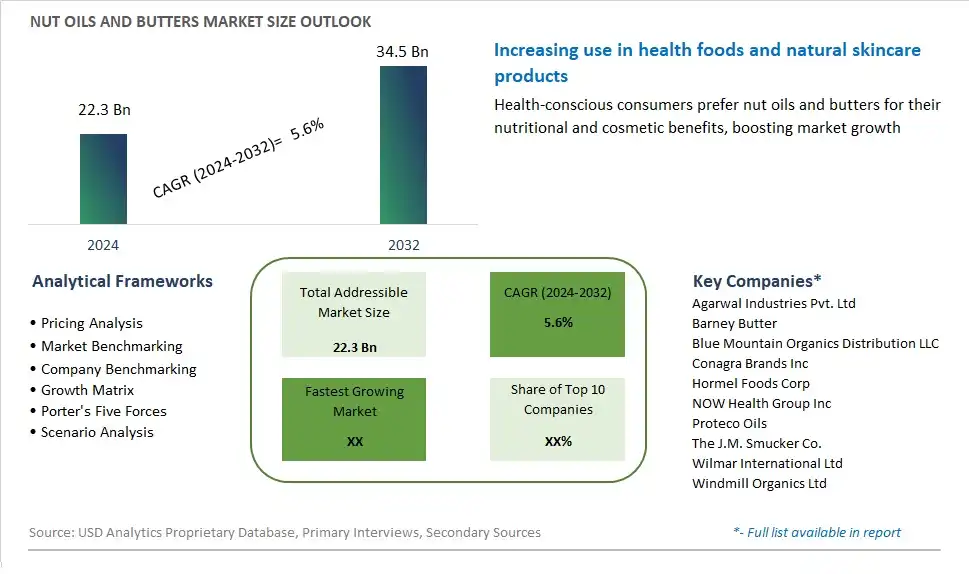
Global Nut Oils and Butters Market Size is valued at $22.3 Billion in 2024 and is forecast to register a growth rate (CAGR) of 5.6% to reach $34.5 Billion by 2032.
The global Nut Oils and Butters Market Comprehensive Study analyzes and forecasts the market size across 6 regions and 24 countries for diverse segments -By Type (Nut Oils, Butter), By Application (Baking, Spread, Drinks, Others)
An Introduction to Nut Oils and Butters Market
In 2024, the market for nut oils and butters is thriving as consumers embrace the rich flavor, nutritional benefits, and culinary versatility of these natural ingredients. Nut oils and butters are derived from various nuts such as almonds, walnuts, peanuts, and cashews, offering a rich source of healthy fats, protein, vitamins, and minerals. Used in cooking, baking, and food preparation, nut oils and butters add depth and complexity to a wide range of dishes, including salads, sauces, dips, and desserts. Moreover, nut oils are valued for their high smoke points and distinct flavor profiles, making them ideal for sautéing, frying, and roasting without imparting a greasy or heavy texture to foods. With growing interest in plant-based diets, clean eating, and gourmet cooking, nut oils and butters are becoming pantry staples for health-conscious consumers and culinary enthusiasts alike. As the market for nut oils and butters continues to expand, expect to see further innovation in product varieties, packaging formats, and flavor infusions that cater to diverse tastes, dietary preferences, and culinary trends, reflecting the enduring popularity and versatility of these nutritious and flavorful ingredients.
Nut Oils and Butters Competitive Landscape
The market report analyses the leading companies in the industry including Agarwal Industries Pvt. Ltd, Barney Butter, Blue Mountain Organics Distribution LLC, Conagra Brands Inc, Hormel Foods Corp, NOW Health Group Inc, Proteco Oils, The J.M. Smucker Co., Wilmar International Ltd , Windmill Organics Ltd, and Others.
Nut Oils and Butters Market Dynamics
Nut Oils and Butters Market Trend: Growing Interest in Health and Wellness
A significant trend in the nut oils and butters market is the growing interest in health and wellness among consumers. With increasing awareness of the health benefits associated with nuts, including their high levels of healthy fats, vitamins, and minerals, there's a rising demand for nut-based oils and butters as nutritious alternatives to traditional cooking fats and spreads. Consumers are seeking out products that offer functional benefits and contribute to a balanced diet, leading to a shift towards incorporating nut oils and butters into everyday cooking and meal preparation. This trend is driven by a desire for healthier eating habits, dietary diversification, and the popularity of plant-based diets, reflecting evolving consumer preferences towards natural, minimally processed foods with added nutritional value.
Market Driver: Growth in Plant-Based and Vegan Diets
A key driver for the nut oils and butters market is the growth in plant-based and vegan diets, which have fueled demand for alternative sources of protein, fat, and flavor in food products. As consumers increasingly adopt plant-based lifestyles for health, ethical, and environmental reasons, there's a growing need for plant-derived ingredients that can replicate the taste and texture of animal-derived products. Nut oils and butters, derived from almonds, peanuts, cashews, and other nuts, serve as versatile and nutritious substitutes for dairy butter, margarine, and animal fats in cooking, baking, and food manufacturing applications. This driver is reinforced by the mainstreaming of plant-based eating, the availability of vegan-friendly products in supermarkets and restaurants, and the influence of social media influencers and celebrity endorsements promoting plant-based diets as trendy and aspirational.
Market Opportunity: Innovation in Product Formulations and Applications
An opportunity for the nut oils and butters market lies in innovation in product formulations and applications to meet the diverse needs and preferences of consumers seeking healthier, plant-based alternatives. Companies can capitalize on this opportunity by expanding their product lines to include a wider variety of nut oils and butters, offering different flavor profiles, textures, and nutritional profiles to cater to various culinary preferences and dietary restrictions. Additionally, there's potential to innovate with value-added nut oil and butter products enriched with vitamins, antioxidants, and functional ingredients to enhance their nutritional value and health benefits. Moreover, there's an opportunity to explore new applications for nut oils and butters in the food industry, such as in plant-based dairy alternatives, snack foods, confectionery, and functional food and beverage products. By leveraging consumer demand for natural, nutritious, and versatile ingredients, companies can drive growth and differentiation in the nut oils and butters segment.
Nut Oils and Butters Market Share Analysis: Nut Oils held the dominant market share in 2024
In the Nut Oils and Butters market segmented by type, the Nut Oils category is the largest segment, driven by its versatile culinary applications, nutritional benefits, and increasing consumer preference for healthy cooking oils. Nut oils, extracted from various nuts such as almonds, walnuts, and peanuts, are prized for their rich flavor profiles and high levels of unsaturated fats, antioxidants, and vitamins. These oils are widely used in cooking, baking, salad dressings, and marinades, adding depth of flavor and nutritional value to dishes. Further, the growing awareness of the health benefits associated with nut oils, including their potential to improve heart health and lower cholesterol levels, further contributes to their popularity among health-conscious consumers. As a result of their versatility and nutritional value, the Nut Oils segment commands the largest share of the Nut Oils and Butters market, reflecting their central role in modern cuisine and healthy cooking practices.
Nut Oils and Butters Market Share Analysis: Almond Butter market is poised to register the fastest growth rae over the forecast period to 2032
Among the various applications within the nut oils and butters market, almond butter stands out as a segment experiencing significant growth. The surge in demand for almond butter can be attributed to several factors. Firstly, the increasing consumer preference for healthier alternatives to traditional spreads has propelled the popularity of almond butter, given its perceived health benefits such as being rich in monounsaturated fats, vitamin E, and fiber. Further, the rising prevalence of lactose intolerance and dairy allergies has driven consumers towards plant-based alternatives, further boosting the demand for almond butter as a substitute for dairy-based spreads. Additionally, the versatility of almond butter in various applications, including baking, spreading, and incorporating into beverages, contributes to its widespread appeal among health-conscious consumers seeking nutritious options across different consumption occasions. Furthermore, the growing availability of almond butter in convenient packaging formats and the expanding distribution channels, including online platforms, have facilitated its accessibility, thereby fueling its rapid growth within the nut oils and butters market. As dietary trends continue to emphasize the importance of wholesome and natural ingredients, the trajectory of almond butter's expansion is expected to remain upward, making it a key player in the evolving landscape of alternative spreads and culinary ingredients.
Nut Oils and Butters Market Segmentation
By Type
Nut Oils
Butters
By Application
Baking
Spread
Drinks
Others
Countries Analyzed
North America (US, Canada, Mexico)
Europe (Germany, UK, France, Spain, Italy, Russia, Rest of Europe)
Asia Pacific (China, India, Japan, South Korea, Australia, South East Asia, Rest of Asia)
South America (Brazil, Argentina, Rest of South America)
Middle East and Africa (Saudi Arabia, UAE, Rest of Middle East, South Africa, Egypt, Rest of Africa)
Nut Oils and Butters Companies Profiled in the Study
Agarwal Industries Pvt. Ltd
Barney Butter
Blue Mountain Organics Distribution LLC
Conagra Brands Inc
Hormel Foods Corp
NOW Health Group Inc
Proteco Oils
The J.M. Smucker Co.
Wilmar International Ltd
Windmill Organics Ltd
*- List Not Exhaustive
Chapter 1. TABLE OF CONTENTS
Chapter 2. Introduction to Nut Oils and Butters Market
2.1. Market Overview
2.2. Key Statistics and Report Highlights
2.3. Scope of the Comprehensive Study
2.3.1. Market Definition
2.3.2 Countries and Regions Covered
2.3.3 Research Objective
2.3.4 Units, Currency, and Conversions
2.3.5 Industry Value Chain
2.4. Key Market Segments
2.5. Key Companies
2.6. Study Period
Chapter 3. Strategic Analysis Review
3.1. Nut Oils and Butters Pricing Analysis and Forecast
3.2. Porter’s Five Forces
3.3. Market Ecosystem
3.4. SWOT Analysis
3.5. Regulatory Scenario
3.3. Effects of Inflation, Russia-Ukraine War, moderating economic growth, and other macroeconomic factors
Chapter 4. Competitive Landscape
4.1. Market Share Analysis
4.1.1. Global Nut Oils and Butters Market Share by Company, 2023
4.1.2. Product Offerings of Leading Nut Oils and Butters Companies
4.2. Market Entropy
4.2.1. New Product Launches in the Industry
4.2.2. Mergers, Acquisitions, Joint ventures, and Partnerships
4.3. Key Strategies and Best Practices
Chapter 5. Global Market Projections: Best, Reference, and Low Case Scenarios
5.1. Growth Analysis- Case Scenario Definitions
5.2. Low Growth Case Scenario Forecasts
5.3. Reference Growth Case Scenario Forecasts
5.4. High Growth Case Scenario Forecasts
Chapter 6. Market Dynamics
6.1. Nut Oils and Butters Market Drivers
6.2. Nut Oils and Butters Market Challenges
6.6. Nut Oils and Butters Market Opportunities
6.4. Nut Oils and Butters Market Trends
Chapter 7. Global Nut Oils and Butters Market Outlook Trends
7.1. Global Nut Oils and Butters Revenue (USD Million) and CAGR (%) by Type (2021-2032)
7.2. Global Nut Oils and Butters Revenue (USD Million) and CAGR (%) by Application (2021-2032)
7.3. Global Nut Oils and Butters Revenue (USD Million) and CAGR (%) by Product (2021-2032)
By Type
Nut Oils
Butters
By Application
Baking
Spread
Drinks
Others
Chapter 8. Global Nut Oils and Butters Regional Analysis and Outlook
8.1. Global Nut Oils and Butters Revenue (USD Million) By Regions (2021- 2032)
8.2. North America Nut Oils and Butters Revenue (USD Million) by Country (2021-2032)
8.2.1. United States Nut Oils and Butters Regional Analysis and Outlook
8.2.2. Canada Nut Oils and Butters Regional Analysis and Outlook
8.2.3. Mexico Nut Oils and Butters Regional Analysis and Outlook
8.3. Europe Nut Oils and Butters Revenue (USD Million), by Country (2021-2032)
8.3.1. Germany Nut Oils and Butters Regional Analysis and Outlook
8.3.2. France Nut Oils and Butters Regional Analysis and Outlook
8.3.3. United Kingdom Nut Oils and Butters Regional Analysis and Outlook
8.3.4. Spain Nut Oils and Butters Regional Analysis and Outlook
8.3.5. Italy Nut Oils and Butters Regional Analysis and Outlook
8.3.6. Russia Nut Oils and Butters Regional Analysis and Outlook
8.3.7. Rest of Europe Nut Oils and Butters Regional Analysis and Outlook
8.4. Asia Pacific Nut Oils and Butters Revenue (USD Million) by Country (2021-2032)
8.4.1. China Nut Oils and Butters Regional Analysis and Outlook
8.4.2. Japan Nut Oils and Butters Regional Analysis and Outlook
8.4.3. India Nut Oils and Butters Regional Analysis and Outlook
8.4.4. South Korea Nut Oils and Butters Regional Analysis and Outlook
8.4.5. Australia Nut Oils and Butters Regional Analysis and Outlook
8.4.6. South East Asia Nut Oils and Butters Regional Analysis and Outlook
8.4.7. Rest of Asia Pacific Nut Oils and Butters Regional Analysis and Outlook
8.5. South America Nut Oils and Butters Revenue (USD Million), by Country (2021-2032)
8.5.1. Brazil Nut Oils and Butters Regional Analysis and Outlook
8.5.2. Argentina Nut Oils and Butters Regional Analysis and Outlook
8.5.3. Rest of South America Nut Oils and Butters Regional Analysis and Outlook
8.6. Middle East and Africa Nut Oils and Butters Revenue (USD Million) by Country (2021-2032)
8.6.1. Middle East Nut Oils and Butters Regional Analysis and Outlook
8.6.2. Africa Nut Oils and Butters Regional Analysis and Outlook
Chapter 9. North America Nut Oils and Butters Analysis and Outlook
9.1. North America Nut Oils and Butters Revenue (USD Million) by Segments (2021-2032)
9.1.1. North America Nut Oils and Butters Revenue (USD Million) by Type (2021-2032)
9.1.2. North America Nut Oils and Butters Revenue (USD Million) by Application (2021-2032)
9.1.3. North America Nut Oils and Butters Revenue (USD Million) by Product (2021-2032)
By Type
Nut Oils
Butters
By Application
Baking
Spread
Drinks
Others
Chapter 10. Europe Nut Oils and Butters Analysis and Outlook
10.1. Europe Nut Oils and Butters Revenue (USD Million), by Segments (USD Million) (2021-2032)
10.1.1. Europe Nut Oils and Butters Revenue (USD Million) by Type (2021-2032)
10.1.2. Europe Nut Oils and Butters Revenue (USD Million) by Application (2021-2032)
10.1.3. Europe Nut Oils and Butters Revenue (USD Million) by Product (2021-2032)
By Type
Nut Oils
Butters
By Application
Baking
Spread
Drinks
Others
Chapter 11. Asia Pacific Nut Oils and Butters Analysis and Outlook
11.1. Asia Pacific Nut Oils and Butters Revenue (USD Million), and Revenue (USD Million) by Segments (2021-2032)
11.1.1. Asia Pacific Nut Oils and Butters Revenue (USD Million) by Type (2021-2032)
11.1.2. Asia Pacific Nut Oils and Butters Revenue (USD Million) by Application (2021-2032)
11.1.3. Asia Pacific Nut Oils and Butters Revenue (USD Million) by Product (2021-2032)
By Type
Nut Oils
Butters
By Application
Baking
Spread
Drinks
Others
Chapter 12. South America Nut Oils and Butters Analysis and Outlook
12.1. South America Nut Oils and Butters Revenue (USD Million), by Segments (2021-2032)
12.1.1. South America Nut Oils and Butters Revenue (USD Million) by Type (2021-2032)
12.1.2. South America Nut Oils and Butters Revenue (USD Million) by Application (2021-2032)
12.1.3. South America Nut Oils and Butters Revenue (USD Million) by Product (2021-2032)
By Type
Nut Oils
Butters
By Application
Baking
Spread
Drinks
Others
Chapter 13. Middle East and Africa Nut Oils and Butters Analysis and Outlook
13.1. Middle East and Africa Nut Oils and Butters Revenue (USD Million), by Segments (2021-2032)
13.1.1. Middle East and Africa Nut Oils and Butters Revenue (USD Million) by Type (2021-2032)
13.1.2. Middle East and Africa Nut Oils and Butters Revenue (USD Million) by Application (2021-2032)
13.1.3. Middle East and Africa Nut Oils and Butters Revenue (USD Million) by Product (2021-2032)
By Type
Nut Oils
Butters
By Application
Baking
Spread
Drinks
Others
Chapter 14. Nut Oils and Butters Company Profiles
14.1 Business Overview
14.2 Product Profiles
14.3 SWOT Profiles
14.5 Recent Developments
14.6 Financial Profile
List of Companies
Agarwal Industries Pvt. Ltd
Barney Butter
Blue Mountain Organics Distribution LLC
Conagra Brands Inc
Hormel Foods Corp
NOW Health Group Inc
Proteco Oils
The J.M. Smucker Co.
Wilmar International Ltd
Windmill Organics Ltd
15. Methodology and Data Sources
15.1 Customization Offerings
15.2 Subscription Services
15.3 Related Reports
15.4 Publisher Expertise
LIST OF TABLES
Table 1 Market Segmentation Analysis
Table 2 Global Nut Oils and Butters Market Share of Leading Companies, 2023
Table 3 Product Offerings of Leading Companies
Table 4 Low Growth Scenario Forecasts
Table 5 Reference Case Growth Scenario
Table 6 High Growth Case Scenario
Table 7 Global Nut Oils and Butters Revenue (USD Million) And CAGR (%) By Type (2021-2032)
Table 8 Global Nut Oils and Butters Revenue (USD Million) And CAGR (%) By Application (2021-2032)
Table 9 Global Nut Oils and Butters Revenue (USD Million) And CAGR (%) By Product (2021-2032)
Table 10 Global Nut Oils and Butters Market Revenue (USD Million) By Regions (2021-2032)
Table 11 Global Nut Oils and Butters Market Share (%) By Regions (2021-2032)
Table 12 North America Nut Oils and Butters Revenue (USD Million) By Country (2021-2032)
Table 13 Europe Nut Oils and Butters Revenue (USD Million) By Country (2021-2032)
Table 14 Asia Pacific Nut Oils and Butters Revenue (USD Million) By Country (2021-2032)
Table 15 South America Nut Oils and Butters Revenue (USD Million) By Country (2021-2032)
Table 16 Middle East and Africa Nut Oils and Butters Revenue (USD Million) By Region (2021-2032)
Table 17 North America Nut Oils and Butters Revenue (USD Million) By Type (2021-2032)
Table 18 North America Nut Oils and Butters Revenue (USD Million) By Application (2021-2032)
Table 19 North America Nut Oils and Butters Revenue (USD Million) By Product (2021-2032)
Table 20 Europe Nut Oils and Butters Revenue (USD Million) By Type (2021-2032)
Table 21 Europe Nut Oils and Butters Revenue (USD Million) By Application (2021-2032)
Table 22 Europe Nut Oils and Butters Revenue (USD Million) By Product (2021-2032)
Table 23 Asia Pacific Nut Oils and Butters Revenue (USD Million) By Type (2021-2032)
Table 24 Asia Pacific Nut Oils and Butters Revenue (USD Million) By Application (2021-2032)
Table 25 Asia Pacific Nut Oils and Butters Revenue (USD Million) By Product (2021-2032)
Table 26 South America Nut Oils and Butters Revenue (USD Million) By Type (2021-2032)
Table 27 South America Nut Oils and Butters Revenue (USD Million) By Application (2021-2032)
Table 28 South America Nut Oils and Butters Revenue (USD Million) By Product (2021-2032)
Table 29 Middle East and Africa Nut Oils and Butters Revenue (USD Million) By Type (2021-2032)
Table 30 Middle East and Africa Nut Oils and Butters Revenue (USD Million) By Application (2021-2032)
Table 31 Middle East and Africa Nut Oils and Butters Revenue (USD Million) By Product (2021-2032)
LIST OF FIGURES
Figure 1. Market Scope
Figure 2. Pricing Forecasts Per Unit, 2023- 2032
Figure 3. Porter’s Five Forces
Figure 4. Global Nut Oils and Butters Market Revenue (USD Million) By Regions (2021-2032)
Figure 5. Global Nut Oils and Butters Market Share (%) By Regions (2023)
Figure 6. North America Nut Oils and Butters Revenue (USD Million) By Country (2021-2032)
Figure 7. United States Nut Oils and Butters Revenue (USD Million) By Country (2021-2032)
Figure 8. Canada Nut Oils and Butters Revenue (USD Million) By Country (2021-2032)
Figure 9. Mexico Nut Oils and Butters Revenue (USD Million) By Country (2021-2032)
Figure 10. Europe Nut Oils and Butters Revenue (USD Million) By Country (2021-2032)
Figure 11. Germany Nut Oils and Butters Revenue (USD Million) By Country (2021-2032)
Figure 12. France Nut Oils and Butters Revenue (USD Million) By Country (2021-2032)
Figure 13. United Kingdom Nut Oils and Butters Revenue (USD Million) By Country (2021-2032)
Figure 14. Spain Nut Oils and Butters Revenue (USD Million) By Country (2021-2032)
Figure 15. Italy Nut Oils and Butters Revenue (USD Million) By Country (2021-2032)
Figure 16. Russia Nut Oils and Butters Revenue (USD Million) By Country (2021-2032)
Figure 17. Rest of Europe Nut Oils and Butters Revenue (USD Million) By Country (2021-2032)
Figure 11. Asia Pacific Nut Oils and Butters Revenue (USD Million) By Country (2021-2032)
Figure 12. China Nut Oils and Butters Revenue (USD Million) By Country (2021-2032)
Figure 13. Japan Nut Oils and Butters Revenue (USD Million) By Country (2021-2032)
Figure 14. India Nut Oils and Butters Revenue (USD Million) By Country (2021-2032)
Figure 15. South Korea Nut Oils and Butters Revenue (USD Million) By Country (2021-2032)
Figure 16. Australia Nut Oils and Butters Revenue (USD Million) By Country (2021-2032)
Figure 17. South East Asia Nut Oils and Butters Revenue (USD Million) By Country (2021-2032)
Figure 18. South America Nut Oils and Butters Revenue (USD Million) By Country (2021-2032)
Figure 19. Brazil Nut Oils and Butters Revenue (USD Million) By Country (2021-2032)
Figure 20. Argentina Nut Oils and Butters Revenue (USD Million) By Country (2021-2032)
Figure 21. Rest of Asia Pacific Nut Oils and Butters Revenue (USD Million) By Country (2021-2032)
Figure 22. Middle East and Africa Nut Oils and Butters Revenue (USD Million) By Region (2021-2032)
Figure 23. Saudi Arabia Nut Oils and Butters Revenue (USD Million) By Region (2021-2032)
Figure 24. The UAE Nut Oils and Butters Revenue (USD Million) By Region (2021-2032)
Figure 25. Rest of Middle East Nut Oils and Butters Revenue (USD Million) By Region (2021-2032)
Figure 26. South Africa Nut Oils and Butters Revenue (USD Million) By Region (2021-2032)
Figure 27. Africa Nut Oils and Butters Revenue (USD Million) By Region (2021-2032)
Figure 28. North America Nut Oils and Butters Revenue (USD Million) By Type (2021-2032)
Figure 29. North America Nut Oils and Butters Revenue (USD Million) By Application (2021-2032)
Figure 30. North America Nut Oils and Butters Revenue (USD Million) By Product (2021-2032)
Figure 31. Europe Nut Oils and Butters Revenue (USD Million) By Type (2021-2032)
Figure 32. Europe Nut Oils and Butters Revenue (USD Million) By Application (2021-2032)
Figure 33. Europe Nut Oils and Butters Revenue (USD Million) By Product (2021-2032)
Figure 34. Asia Pacific Nut Oils and Butters Revenue (USD Million) By Type (2021-2032)
Figure 35. Asia Pacific Nut Oils and Butters Revenue (USD Million) By Application (2021-2032)
Figure 36. Asia Pacific Nut Oils and Butters Revenue (USD Million) By Product (2021-2032)
Figure 37. South America Nut Oils and Butters Revenue (USD Million) By Type (2021-2032)
Figure 38. South America Nut Oils and Butters Revenue (USD Million) By Application (2021-2032)
Figure 39. South America Nut Oils and Butters Revenue (USD Million) By Product (2021-2032)
Figure 40. Middle East and Africa Nut Oils and Butters Revenue (USD Million) By Type (2021-2032)
Figure 41. Middle East and Africa Nut Oils and Butters Revenue (USD Million) By Application (2021-2032)
Figure 42. Middle East and Africa Nut Oils and Butters Revenue (USD Million) By Product (2021-2032)
By Type
Nut Oils
Butters
By Application
Baking
Spread
Drinks
Others
Countries Analyzed
North America (US, Canada, Mexico)
Europe (Germany, UK, France, Spain, Italy, Russia, Rest of Europe)
Asia Pacific (China, India, Japan, South Korea, Australia, South East Asia, Rest of Asia)
South America (Brazil, Argentina, Rest of South America)
Middle East and Africa (Saudi Arabia, UAE, Rest of Middle East, South Africa, Egypt, Rest of Africa)
