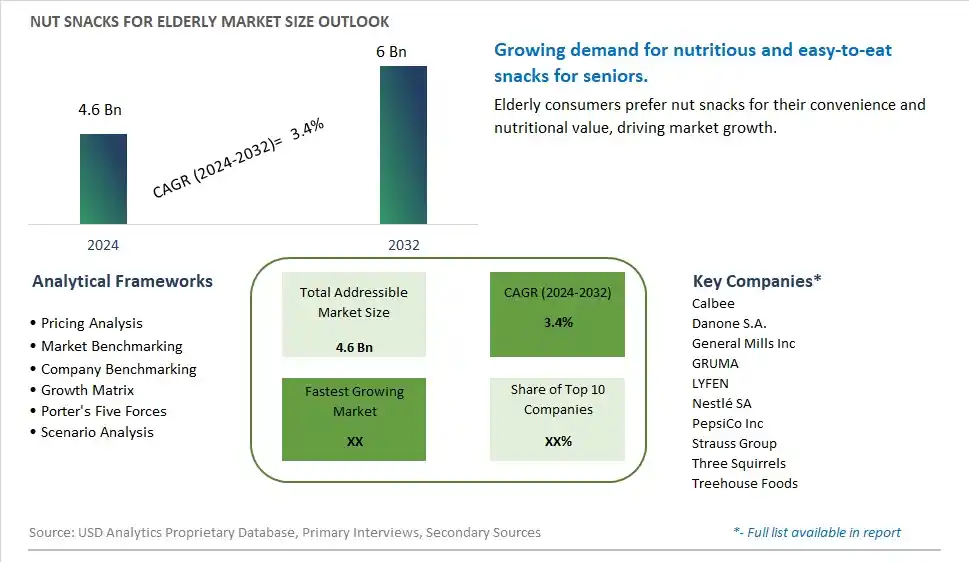
Global Nut Snacks for Elderly Market Size is valued at $4.6 Billion in 2024 and is forecast to register a growth rate (CAGR) of 3.4% to reach $6 Billion by 2032.
The global Nut Snacks for Elderly Market Comprehensive Study analyzes and forecasts the market size across 6 regions and 24 countries for diverse segments -By Type (Cashew, Walnut, Peanut, Others), By Application (60 to 65 Years Old, 65 to 70 Years Old, Above 70 Years Old)
An Introduction to Nut Snacks for Elderly Market
In 2024, the nut snacks for elderly market is thriving, fueled by the demand for nutritious and easy-to-consume snacks that cater to the dietary needs of older adults. Nut snacks, rich in healthy fats, protein, and fiber, offer health benefits such as improved heart health and cognitive function. The market benefits from innovations in snack formulation and packaging that enhance ease of consumption and nutritional value. The trend towards clean label and natural ingredients is influencing product development. Increasing awareness of age-specific nutrition and the popularity of functional foods are further supporting market growth.
Nut Snacks for Elderly Competitive Landscape
The market report analyses the leading companies in the industry including Calbee, Danone S.A., General Mills Inc, GRUMA, LYFEN, Nestlé SA, PepsiCo Inc, Strauss Group, Three Squirrels, Treehouse Foods, and Others.
Nut Snacks for Elderly Market Dynamics
Nut Snacks for Elderly Market Trend: Increasing Demand for Health-Promoting Snacks
The most prominent trend in the Nut Snacks for Elderly Market is the increasing demand for health-promoting snacks. As the elderly population grows, there is a rising interest in snacks that offer both convenience and nutritional benefits, such as improved cognitive function and bone health. Nut snacks are becoming popular for their rich nutrient profile and ease of consumption.
Nut Snacks for Elderly Market Driver: Growing Elderly Population and Health Awareness
A key driver in the Nut Snacks for Elderly Market is the growing elderly population and heightened health awareness. As more individuals age, there is a greater focus on maintaining health and well-being through diet. Nut snacks provide essential nutrients like omega-3 fatty acids, fiber, and antioxidants, which are particularly beneficial for elderly individuals.
Nut Snacks for Elderly Market Opportunity: Development of Senior-Friendly Snack Formats
One significant opportunity in the Nut Snacks for Elderly Market lies in the development of senior-friendly snack formats. Companies can innovate by creating nut snacks that are easy to chew, digest, and package in single-serve portions. By offering products tailored to the specific needs of elderly consumers, manufacturers can attract this growing demographic and drive market growth.
Nut Snacks for Elderly Market Share Analysis- Largest Segment by Type
In the Nut Snacks for Elderly Market, Walnut is the largest segment. Walnuts are particularly favored among the elderly due to their significant health benefits, including high levels of omega-3 fatty acids, antioxidants, and other nutrients that support cognitive function and heart health. As the aging population increasingly seeks out foods that promote better health and wellness, walnuts have emerged as a preferred choice. Their nutritional profile and associated health benefits make them a dominant player in the nut snacks market for the elderly.
Nut Snacks for Elderly Market Share Analysis- Fastest Growing Segment by Application
In the Nut Snacks for Elderly Market, the Above 70 Years Old age group is poised to grow the fastest over the next five years. This segment's accelerated growth is largely due to the expanding elderly population and increased awareness about the health benefits of nut snacks for older adults. As people age, there is a heightened focus on maintaining health and managing age-related issues such as cardiovascular health and bone density. Nuts, rich in essential nutrients like healthy fats, vitamins, and minerals, are increasingly recognized for their potential to support heart health, cognitive function, and overall well-being. Additionally, the rise in customized health products tailored to the nutritional needs of the elderly population, coupled with a growing preference for convenient and health-conscious snack options, is driving the demand for nut snacks in this age bracket.
Nut Snacks for Elderly Market Segmentation
By Type
Cashew
Walnut
Peanut
Others
By Application
60 to 65 Years Old
65 to 70 Years Old
Above 70 Years Old
Countries Analyzed
North America (US, Canada, Mexico)
Europe (Germany, UK, France, Spain, Italy, Russia, Rest of Europe)
Asia Pacific (China, India, Japan, South Korea, Australia, South East Asia, Rest of Asia)
South America (Brazil, Argentina, Rest of South America)
Middle East and Africa (Saudi Arabia, UAE, Rest of Middle East, South Africa, Egypt, Rest of Africa)
Nut Snacks for Elderly Companies Profiled in the Study
Calbee
Danone S.A.
General Mills Inc
GRUMA
LYFEN
Nestlé SA
PepsiCo Inc
Strauss Group
Three Squirrels
Treehouse Foods
*- List Not Exhaustive
Chapter 1. TABLE OF CONTENTS
Chapter 2. Introduction to Nut Snacks for Elderly Market
2.1. Market Overview
2.2. Key Statistics and Report Highlights
2.3. Scope of the Comprehensive Study
2.3.1. Market Definition
2.3.2 Countries and Regions Covered
2.3.3 Research Objective
2.3.4 Units, Currency, and Conversions
2.3.5 Industry Value Chain
2.4. Key Market Segments
2.5. Key Companies
2.6. Study Period
Chapter 3. Strategic Analysis Review
3.1. Nut Snacks for Elderly Pricing Analysis and Forecast
3.2. Porter’s Five Forces
3.3. Market Ecosystem
3.4. SWOT Analysis
3.5. Regulatory Scenario
3.3. Effects of Inflation, Russia-Ukraine War, moderating economic growth, and other macroeconomic factors
Chapter 4. Competitive Landscape
4.1. Market Share Analysis
4.1.1. Global Nut Snacks for Elderly Market Share by Company, 2023
4.1.2. Product Offerings of Leading Nut Snacks for Elderly Companies
4.2. Market Entropy
4.2.1. New Product Launches in the Industry
4.2.2. Mergers, Acquisitions, Joint ventures, and Partnerships
4.3. Key Strategies and Best Practices
Chapter 5. Global Market Projections: Best, Reference, and Low Case Scenarios
5.1. Growth Analysis- Case Scenario Definitions
5.2. Low Growth Case Scenario Forecasts
5.3. Reference Growth Case Scenario Forecasts
5.4. High Growth Case Scenario Forecasts
Chapter 6. Market Dynamics
6.1. Nut Snacks for Elderly Market Drivers
6.2. Nut Snacks for Elderly Market Challenges
6.6. Nut Snacks for Elderly Market Opportunities
6.4. Nut Snacks for Elderly Market Trends
Chapter 7. Global Nut Snacks for Elderly Market Outlook Trends
7.1. Global Nut Snacks for Elderly Revenue (USD Million) and CAGR (%) by Type (2021-2032)
7.2. Global Nut Snacks for Elderly Revenue (USD Million) and CAGR (%) by Application (2021-2032)
7.3. Global Nut Snacks for Elderly Revenue (USD Million) and CAGR (%) by Product (2021-2032)
By Type
Cashew
Walnut
Peanut
Others
By Application
60 to 65 Years Old
65 to 70 Years Old
Above 70 Years Old
Chapter 8. Global Nut Snacks for Elderly Regional Analysis and Outlook
8.1. Global Nut Snacks for Elderly Revenue (USD Million) By Regions (2021- 2032)
8.2. North America Nut Snacks for Elderly Revenue (USD Million) by Country (2021-2032)
8.2.1. United States Nut Snacks for Elderly Regional Analysis and Outlook
8.2.2. Canada Nut Snacks for Elderly Regional Analysis and Outlook
8.2.3. Mexico Nut Snacks for Elderly Regional Analysis and Outlook
8.3. Europe Nut Snacks for Elderly Revenue (USD Million), by Country (2021-2032)
8.3.1. Germany Nut Snacks for Elderly Regional Analysis and Outlook
8.3.2. France Nut Snacks for Elderly Regional Analysis and Outlook
8.3.3. United Kingdom Nut Snacks for Elderly Regional Analysis and Outlook
8.3.4. Spain Nut Snacks for Elderly Regional Analysis and Outlook
8.3.5. Italy Nut Snacks for Elderly Regional Analysis and Outlook
8.3.6. Russia Nut Snacks for Elderly Regional Analysis and Outlook
8.3.7. Rest of Europe Nut Snacks for Elderly Regional Analysis and Outlook
8.4. Asia Pacific Nut Snacks for Elderly Revenue (USD Million) by Country (2021-2032)
8.4.1. China Nut Snacks for Elderly Regional Analysis and Outlook
8.4.2. Japan Nut Snacks for Elderly Regional Analysis and Outlook
8.4.3. India Nut Snacks for Elderly Regional Analysis and Outlook
8.4.4. South Korea Nut Snacks for Elderly Regional Analysis and Outlook
8.4.5. Australia Nut Snacks for Elderly Regional Analysis and Outlook
8.4.6. South East Asia Nut Snacks for Elderly Regional Analysis and Outlook
8.4.7. Rest of Asia Pacific Nut Snacks for Elderly Regional Analysis and Outlook
8.5. South America Nut Snacks for Elderly Revenue (USD Million), by Country (2021-2032)
8.5.1. Brazil Nut Snacks for Elderly Regional Analysis and Outlook
8.5.2. Argentina Nut Snacks for Elderly Regional Analysis and Outlook
8.5.3. Rest of South America Nut Snacks for Elderly Regional Analysis and Outlook
8.6. Middle East and Africa Nut Snacks for Elderly Revenue (USD Million) by Country (2021-2032)
8.6.1. Middle East Nut Snacks for Elderly Regional Analysis and Outlook
8.6.2. Africa Nut Snacks for Elderly Regional Analysis and Outlook
Chapter 9. North America Nut Snacks for Elderly Analysis and Outlook
9.1. North America Nut Snacks for Elderly Revenue (USD Million) by Segments (2021-2032)
9.1.1. North America Nut Snacks for Elderly Revenue (USD Million) by Type (2021-2032)
9.1.2. North America Nut Snacks for Elderly Revenue (USD Million) by Application (2021-2032)
9.1.3. North America Nut Snacks for Elderly Revenue (USD Million) by Product (2021-2032)
By Type
Cashew
Walnut
Peanut
Others
By Application
60 to 65 Years Old
65 to 70 Years Old
Above 70 Years Old
Chapter 10. Europe Nut Snacks for Elderly Analysis and Outlook
10.1. Europe Nut Snacks for Elderly Revenue (USD Million), by Segments (USD Million) (2021-2032)
10.1.1. Europe Nut Snacks for Elderly Revenue (USD Million) by Type (2021-2032)
10.1.2. Europe Nut Snacks for Elderly Revenue (USD Million) by Application (2021-2032)
10.1.3. Europe Nut Snacks for Elderly Revenue (USD Million) by Product (2021-2032)
By Type
Cashew
Walnut
Peanut
Others
By Application
60 to 65 Years Old
65 to 70 Years Old
Above 70 Years Old
Chapter 11. Asia Pacific Nut Snacks for Elderly Analysis and Outlook
11.1. Asia Pacific Nut Snacks for Elderly Revenue (USD Million), and Revenue (USD Million) by Segments (2021-2032)
11.1.1. Asia Pacific Nut Snacks for Elderly Revenue (USD Million) by Type (2021-2032)
11.1.2. Asia Pacific Nut Snacks for Elderly Revenue (USD Million) by Application (2021-2032)
11.1.3. Asia Pacific Nut Snacks for Elderly Revenue (USD Million) by Product (2021-2032)
By Type
Cashew
Walnut
Peanut
Others
By Application
60 to 65 Years Old
65 to 70 Years Old
Above 70 Years Old
Chapter 12. South America Nut Snacks for Elderly Analysis and Outlook
12.1. South America Nut Snacks for Elderly Revenue (USD Million), by Segments (2021-2032)
12.1.1. South America Nut Snacks for Elderly Revenue (USD Million) by Type (2021-2032)
12.1.2. South America Nut Snacks for Elderly Revenue (USD Million) by Application (2021-2032)
12.1.3. South America Nut Snacks for Elderly Revenue (USD Million) by Product (2021-2032)
By Type
Cashew
Walnut
Peanut
Others
By Application
60 to 65 Years Old
65 to 70 Years Old
Above 70 Years Old
Chapter 13. Middle East and Africa Nut Snacks for Elderly Analysis and Outlook
13.1. Middle East and Africa Nut Snacks for Elderly Revenue (USD Million), by Segments (2021-2032)
13.1.1. Middle East and Africa Nut Snacks for Elderly Revenue (USD Million) by Type (2021-2032)
13.1.2. Middle East and Africa Nut Snacks for Elderly Revenue (USD Million) by Application (2021-2032)
13.1.3. Middle East and Africa Nut Snacks for Elderly Revenue (USD Million) by Product (2021-2032)
By Type
Cashew
Walnut
Peanut
Others
By Application
60 to 65 Years Old
65 to 70 Years Old
Above 70 Years Old
Chapter 14. Nut Snacks for Elderly Company Profiles
14.1 Business Overview
14.2 Product Profiles
14.3 SWOT Profiles
14.5 Recent Developments
14.6 Financial Profile
List of Companies
Calbee
Danone S.A.
General Mills Inc
GRUMA
LYFEN
Nestlé SA
PepsiCo Inc
Strauss Group
Three Squirrels
Treehouse Foods
15. Methodology and Data Sources
15.1 Customization Offerings
15.2 Subscription Services
15.3 Related Reports
15.4 Publisher Expertise
LIST OF TABLES
Table 1 Market Segmentation Analysis
Table 2 Global Nut Snacks for Elderly Market Share of Leading Companies, 2023
Table 3 Product Offerings of Leading Companies
Table 4 Low Growth Scenario Forecasts
Table 5 Reference Case Growth Scenario
Table 6 High Growth Case Scenario
Table 7 Global Nut Snacks for Elderly Revenue (USD Million) And CAGR (%) By Type (2021-2032)
Table 8 Global Nut Snacks for Elderly Revenue (USD Million) And CAGR (%) By Application (2021-2032)
Table 9 Global Nut Snacks for Elderly Revenue (USD Million) And CAGR (%) By Product (2021-2032)
Table 10 Global Nut Snacks for Elderly Market Revenue (USD Million) By Regions (2021-2032)
Table 11 Global Nut Snacks for Elderly Market Share (%) By Regions (2021-2032)
Table 12 North America Nut Snacks for Elderly Revenue (USD Million) By Country (2021-2032)
Table 13 Europe Nut Snacks for Elderly Revenue (USD Million) By Country (2021-2032)
Table 14 Asia Pacific Nut Snacks for Elderly Revenue (USD Million) By Country (2021-2032)
Table 15 South America Nut Snacks for Elderly Revenue (USD Million) By Country (2021-2032)
Table 16 Middle East and Africa Nut Snacks for Elderly Revenue (USD Million) By Region (2021-2032)
Table 17 North America Nut Snacks for Elderly Revenue (USD Million) By Type (2021-2032)
Table 18 North America Nut Snacks for Elderly Revenue (USD Million) By Application (2021-2032)
Table 19 North America Nut Snacks for Elderly Revenue (USD Million) By Product (2021-2032)
Table 20 Europe Nut Snacks for Elderly Revenue (USD Million) By Type (2021-2032)
Table 21 Europe Nut Snacks for Elderly Revenue (USD Million) By Application (2021-2032)
Table 22 Europe Nut Snacks for Elderly Revenue (USD Million) By Product (2021-2032)
Table 23 Asia Pacific Nut Snacks for Elderly Revenue (USD Million) By Type (2021-2032)
Table 24 Asia Pacific Nut Snacks for Elderly Revenue (USD Million) By Application (2021-2032)
Table 25 Asia Pacific Nut Snacks for Elderly Revenue (USD Million) By Product (2021-2032)
Table 26 South America Nut Snacks for Elderly Revenue (USD Million) By Type (2021-2032)
Table 27 South America Nut Snacks for Elderly Revenue (USD Million) By Application (2021-2032)
Table 28 South America Nut Snacks for Elderly Revenue (USD Million) By Product (2021-2032)
Table 29 Middle East and Africa Nut Snacks for Elderly Revenue (USD Million) By Type (2021-2032)
Table 30 Middle East and Africa Nut Snacks for Elderly Revenue (USD Million) By Application (2021-2032)
Table 31 Middle East and Africa Nut Snacks for Elderly Revenue (USD Million) By Product (2021-2032)
LIST OF FIGURES
Figure 1. Market Scope
Figure 2. Pricing Forecasts Per Unit, 2023- 2032
Figure 3. Porter’s Five Forces
Figure 4. Global Nut Snacks for Elderly Market Revenue (USD Million) By Regions (2021-2032)
Figure 5. Global Nut Snacks for Elderly Market Share (%) By Regions (2023)
Figure 6. North America Nut Snacks for Elderly Revenue (USD Million) By Country (2021-2032)
Figure 7. United States Nut Snacks for Elderly Revenue (USD Million) By Country (2021-2032)
Figure 8. Canada Nut Snacks for Elderly Revenue (USD Million) By Country (2021-2032)
Figure 9. Mexico Nut Snacks for Elderly Revenue (USD Million) By Country (2021-2032)
Figure 10. Europe Nut Snacks for Elderly Revenue (USD Million) By Country (2021-2032)
Figure 11. Germany Nut Snacks for Elderly Revenue (USD Million) By Country (2021-2032)
Figure 12. France Nut Snacks for Elderly Revenue (USD Million) By Country (2021-2032)
Figure 13. United Kingdom Nut Snacks for Elderly Revenue (USD Million) By Country (2021-2032)
Figure 14. Spain Nut Snacks for Elderly Revenue (USD Million) By Country (2021-2032)
Figure 15. Italy Nut Snacks for Elderly Revenue (USD Million) By Country (2021-2032)
Figure 16. Russia Nut Snacks for Elderly Revenue (USD Million) By Country (2021-2032)
Figure 17. Rest of Europe Nut Snacks for Elderly Revenue (USD Million) By Country (2021-2032)
Figure 11. Asia Pacific Nut Snacks for Elderly Revenue (USD Million) By Country (2021-2032)
Figure 12. China Nut Snacks for Elderly Revenue (USD Million) By Country (2021-2032)
Figure 13. Japan Nut Snacks for Elderly Revenue (USD Million) By Country (2021-2032)
Figure 14. India Nut Snacks for Elderly Revenue (USD Million) By Country (2021-2032)
Figure 15. South Korea Nut Snacks for Elderly Revenue (USD Million) By Country (2021-2032)
Figure 16. Australia Nut Snacks for Elderly Revenue (USD Million) By Country (2021-2032)
Figure 17. South East Asia Nut Snacks for Elderly Revenue (USD Million) By Country (2021-2032)
Figure 18. South America Nut Snacks for Elderly Revenue (USD Million) By Country (2021-2032)
Figure 19. Brazil Nut Snacks for Elderly Revenue (USD Million) By Country (2021-2032)
Figure 20. Argentina Nut Snacks for Elderly Revenue (USD Million) By Country (2021-2032)
Figure 21. Rest of Asia Pacific Nut Snacks for Elderly Revenue (USD Million) By Country (2021-2032)
Figure 22. Middle East and Africa Nut Snacks for Elderly Revenue (USD Million) By Region (2021-2032)
Figure 23. Saudi Arabia Nut Snacks for Elderly Revenue (USD Million) By Region (2021-2032)
Figure 24. The UAE Nut Snacks for Elderly Revenue (USD Million) By Region (2021-2032)
Figure 25. Rest of Middle East Nut Snacks for Elderly Revenue (USD Million) By Region (2021-2032)
Figure 26. South Africa Nut Snacks for Elderly Revenue (USD Million) By Region (2021-2032)
Figure 27. Africa Nut Snacks for Elderly Revenue (USD Million) By Region (2021-2032)
Figure 28. North America Nut Snacks for Elderly Revenue (USD Million) By Type (2021-2032)
Figure 29. North America Nut Snacks for Elderly Revenue (USD Million) By Application (2021-2032)
Figure 30. North America Nut Snacks for Elderly Revenue (USD Million) By Product (2021-2032)
Figure 31. Europe Nut Snacks for Elderly Revenue (USD Million) By Type (2021-2032)
Figure 32. Europe Nut Snacks for Elderly Revenue (USD Million) By Application (2021-2032)
Figure 33. Europe Nut Snacks for Elderly Revenue (USD Million) By Product (2021-2032)
Figure 34. Asia Pacific Nut Snacks for Elderly Revenue (USD Million) By Type (2021-2032)
Figure 35. Asia Pacific Nut Snacks for Elderly Revenue (USD Million) By Application (2021-2032)
Figure 36. Asia Pacific Nut Snacks for Elderly Revenue (USD Million) By Product (2021-2032)
Figure 37. South America Nut Snacks for Elderly Revenue (USD Million) By Type (2021-2032)
Figure 38. South America Nut Snacks for Elderly Revenue (USD Million) By Application (2021-2032)
Figure 39. South America Nut Snacks for Elderly Revenue (USD Million) By Product (2021-2032)
Figure 40. Middle East and Africa Nut Snacks for Elderly Revenue (USD Million) By Type (2021-2032)
Figure 41. Middle East and Africa Nut Snacks for Elderly Revenue (USD Million) By Application (2021-2032)
Figure 42. Middle East and Africa Nut Snacks for Elderly Revenue (USD Million) By Product (2021-2032)
By Type
Cashew
Walnut
Peanut
Others
By Application
60 to 65 Years Old
65 to 70 Years Old
Above 70 Years Old
Countries Analyzed
North America (US, Canada, Mexico)
Europe (Germany, UK, France, Spain, Italy, Russia, Rest of Europe)
Asia Pacific (China, India, Japan, South Korea, Australia, South East Asia, Rest of Asia)
South America (Brazil, Argentina, Rest of South America)
Middle East and Africa (Saudi Arabia, UAE, Rest of Middle East, South Africa, Egypt, Rest of Africa)
