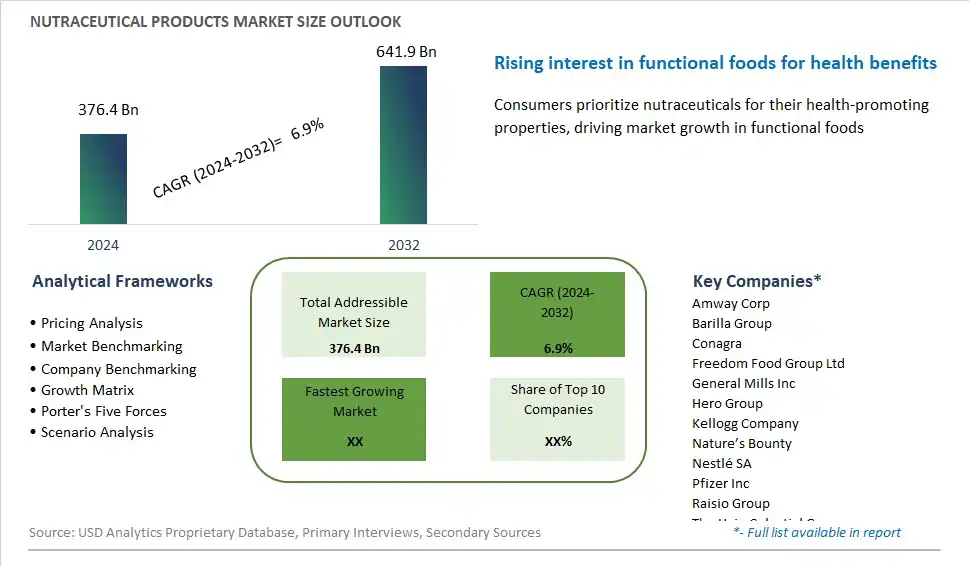
Global Nutraceutical Products Market Size is valued at $376.4 Billion in 2024 and is forecast to register a growth rate (CAGR) of 6.9% to reach $641.9 Billion by 2032.
The global Nutraceutical Products Market Comprehensive Study analyzes and forecasts the market size across 6 regions and 24 countries for diverse segments -By Type (Food, Beverages, Dietary Supplements), By Distribution Channel (Conventional Stores, Specialty Stores), By Source (Probiotics, Proteins & Amino Acids, Phytochemicals & Plant Extracts, Fibers & Specialty Carbohydrates, Omega-3 Fatty Acids, Vitamins, Prebiotics, Carotenoids, Minerals, Others)
An Introduction to Nutraceutical Products Market
Nutraceutical products are dietary supplements or fortified foods containing bioactive compounds derived from natural sources, offering health benefits beyond basic nutrition in 2024. These products include vitamins, minerals, herbal extracts, amino acids, probiotics, and omega-3 fatty acids, formulated to support overall health, wellness, and disease prevention. Nutraceuticals are available in various forms such as capsules, tablets, powders, and functional foods, catering to diverse consumer needs and preferences. With increasing interest in preventive health, personalized nutrition, and holistic wellness, the nutraceutical market is witnessing growth, driven by innovations in ingredient science, formulation technology, and regulatory compliance that deliver safe, effective, and evidence-based products to meet consumer demands and lifestyle goals.
Nutraceutical Products Competitive Landscape
The market report analyses the leading companies in the industry including Amway Corp, Barilla Group, Conagra, Freedom Food Group Ltd, General Mills Inc, Hero Group, Kellogg Company, Nature’s Bounty, Nestlé SA, Pfizer Inc, Raisio Group, The Hain Celestial Group, The Kraft Heinz Company, and Others.
Nutraceutical Products Market Dynamics
Nutraceutical Products Market Trend: Growing Consumer Focus on Health and Wellness
One prominent market trend in nutraceutical products is the growing consumer focus on health and wellness, driven by increasing awareness of preventive healthcare, aging populations, and lifestyle-related diseases. Nutraceutical products, which encompass dietary supplements, functional foods, and beverages fortified with bioactive compounds, vitamins, minerals, and botanical extracts, are gaining popularity as consumers seek natural and science-backed solutions to address their health concerns and optimize their well-being. This trend is further fueled by the desire for personalized nutrition, holistic approaches to health, and the integration of traditional medicine with modern science. As consumers become more proactive in managing their health through diet and supplementation, the demand for nutraceutical products continues to rise, driving market growth and innovation in the global nutraceutical industry.
Market Driver: Increasing Healthcare Costs and Burden of Chronic Diseases
A key driver propelling the market for nutraceutical products is the increasing healthcare costs and burden of chronic diseases worldwide, prompting individuals to seek preventative measures and complementary therapies to maintain their health and reduce the risk of disease. Chronic diseases such as cardiovascular disorders, diabetes, obesity, and cognitive decline are significant contributors to morbidity, mortality, and healthcare expenditures globally. Nutraceutical products offer a proactive approach to health management by providing nutritional support, immune modulation, and disease prevention through targeted supplementation and functional ingredients. This driver is supported by clinical research and evidence demonstrating the efficacy of nutraceuticals in supporting various aspects of health, from cardiovascular health and cognitive function to immune support and gut health. Moreover, the growing emphasis on value-based healthcare and preventive medicine is driving healthcare providers, insurers, and policymakers to promote lifestyle interventions and nutritional strategies, creating opportunities for the integration of nutraceuticals into healthcare systems.
Market Opportunity: Innovation in Personalized Nutrition and Functional Ingredients
An opportunity within the nutraceutical products market lies in innovation in personalized nutrition and functional ingredients to meet the individualized health needs and preferences of consumers. With advancements in technology such as genetic testing, biomarker analysis, and digital health platforms, there's potential to develop personalized nutraceutical solutions tailored to specific genetic predispositions, nutritional deficiencies, and lifestyle factors. Personalized nutrition encompasses customized dietary recommendations, supplementation regimens, and lifestyle interventions designed to optimize health outcomes and prevent disease progression. Additionally, there's an opportunity to innovate in functional ingredients such as probiotics, prebiotics, omega-3 fatty acids, and plant-based extracts that offer targeted health benefits and address emerging health concerns. By leveraging these opportunities for innovation in personalized nutrition and functional ingredients, nutraceutical companies can create differentiated products, enhance consumer engagement, and capture market share in the dynamic and rapidly evolving nutraceutical industry landscape.
Nutraceutical Products Market Share Analysis: Dietary Supplements - Tablets held the dominant market share in 2024
In the nutraceutical products market, the Dietary Supplements - Tablets segment is the largest, propelled by several critical factors. Tablets are a popular and convenient dosage form for dietary supplements, offering precise dosing, ease of consumption, and extended shelf life. Consumers favor tablets for their portability, allowing for on-the-go supplementation to support various health needs and goals. Additionally, the tablets' compact size and stability make them suitable for incorporating a wide range of vitamins, minerals, botanical extracts, and other bioactive compounds. Furthermore, the tablets' versatility caters to diverse consumer preferences, including those seeking specific health benefits, such as immune support, joint health, or cognitive function. Further, regulatory requirements and quality standards ensure the safety and efficacy of tablet formulations, bolstering consumer confidence and market adoption. As consumers increasingly prioritize preventive healthcare and wellness, the Dietary Supplements - Tablets segment continues to dominate the nutraceutical products market, driving growth and innovation in the industry.
Nutraceutical Products Market Share Analysis: Online Retailers market is poised to register the fastest growth rae over the forecast period to 2032
In the nutraceutical products market, the Online Retailers segment is the fastest-growing, propelled by several pivotal factors. With the increasing prevalence of e-commerce and the convenience of online shopping, consumers are turning to digital platforms to purchase a wide range of health and wellness products, including nutraceuticals. Online retailers offer a convenient and accessible shopping experience, allowing consumers to browse, compare, and purchase nutraceutical products from the comfort of their homes. Further, online platforms provide a vast array of product options, enabling consumers to explore niche and specialty products tailored to their specific health needs and preferences. Additionally, the COVID-19 pandemic has accelerated the shift towards online shopping, as consumers seek contactless shopping options and prioritize health and safety measures. Furthermore, online retailers often offer competitive pricing, discounts, and promotional offers, attracting budget-conscious consumers and driving sales growth in the segment. As the digital landscape continues to evolve and consumers increasingly embrace online shopping for nutraceutical products, the Online Retailers segment is poised to maintain its rapid growth trajectory, driving innovation and reshaping the distribution landscape of the nutraceutical industry.
Nutraceutical Products Market Share Analysis: Vitamins held the dominant market share in 2024
In the nutraceutical products market, the Vitamins segment is the largest, driven by several pivotal factors. Vitamins are essential micronutrients that play crucial roles in supporting overall health and well-being, including immune function, energy metabolism, and cellular repair. They are widely recognized for their therapeutic properties and are commonly used as dietary supplements to address nutritional deficiencies and promote optimal health. Additionally, the growing prevalence of lifestyle-related health conditions and the aging population drive the demand for vitamin supplements as preventive healthcare measures. Further, advancements in formulation technology and the introduction of novel delivery systems enhance the efficacy and bioavailability of vitamin supplements, further fueling market growth. Furthermore, regulatory approvals and quality standards ensure the safety and efficacy of vitamin formulations, bolstering consumer confidence and market adoption. As consumers increasingly prioritize preventive healthcare and seek convenient and effective ways to support their health, the Vitamins segment remains at the forefront, driving growth and innovation in the nutraceutical products market.
Nutraceutical Products Market Segmentation
By Type
Food
-Snacks
-Confectionery products
-Bakery products
-Dairy products
-Infant products
Beverages
-Health drinks
-Energy drinks
-Juices
Dietary Supplements
-Tablets
-Liquid
-Powder
-Others
By Distribution Channel
Conventional Stores
-Grocery Stores
-Mass Merchandisers
-Warehouse Clubs
-Online Retailers
Specialty Stores
-Bakery Stores
-Confectionery Stores
-Gourmet Stores
-Health Centers
-Cosmetics Stores
By Source
Probiotics
Proteins & Amino Acids
Phytochemicals & Plant Extracts
Fibers & Specialty Carbohydrates
Omega-3 Fatty Acids
Vitamins
Prebiotics
Carotenoids
Minerals
Others
Countries Analyzed
North America (US, Canada, Mexico)
Europe (Germany, UK, France, Spain, Italy, Russia, Rest of Europe)
Asia Pacific (China, India, Japan, South Korea, Australia, South East Asia, Rest of Asia)
South America (Brazil, Argentina, Rest of South America)
Middle East and Africa (Saudi Arabia, UAE, Rest of Middle East, South Africa, Egypt, Rest of Africa)
Nutraceutical Products Companies Profiled in the Study
Amway Corp
Barilla Group
Conagra
Freedom Food Group Ltd
General Mills Inc
Hero Group
Kellogg Company
Nature’s Bounty
Nestlé SA
Pfizer Inc
Raisio Group
The Hain Celestial Group
The Kraft Heinz Company
*- List Not Exhaustive
Chapter 1. TABLE OF CONTENTS
Chapter 2. Introduction to Nutraceutical Products Market
2.1. Market Overview
2.2. Key Statistics and Report Highlights
2.3. Scope of the Comprehensive Study
2.3.1. Market Definition
2.3.2 Countries and Regions Covered
2.3.3 Research Objective
2.3.4 Units, Currency, and Conversions
2.3.5 Industry Value Chain
2.4. Key Market Segments
2.5. Key Companies
2.6. Study Period
Chapter 3. Strategic Analysis Review
3.1. Nutraceutical Products Pricing Analysis and Forecast
3.2. Porter’s Five Forces
3.3. Market Ecosystem
3.4. SWOT Analysis
3.5. Regulatory Scenario
3.3. Effects of Inflation, Russia-Ukraine War, moderating economic growth, and other macroeconomic factors
Chapter 4. Competitive Landscape
4.1. Market Share Analysis
4.1.1. Global Nutraceutical Products Market Share by Company, 2023
4.1.2. Product Offerings of Leading Nutraceutical Products Companies
4.2. Market Entropy
4.2.1. New Product Launches in the Industry
4.2.2. Mergers, Acquisitions, Joint ventures, and Partnerships
4.3. Key Strategies and Best Practices
Chapter 5. Global Market Projections: Best, Reference, and Low Case Scenarios
5.1. Growth Analysis- Case Scenario Definitions
5.2. Low Growth Case Scenario Forecasts
5.3. Reference Growth Case Scenario Forecasts
5.4. High Growth Case Scenario Forecasts
Chapter 6. Market Dynamics
6.1. Nutraceutical Products Market Drivers
6.2. Nutraceutical Products Market Challenges
6.6. Nutraceutical Products Market Opportunities
6.4. Nutraceutical Products Market Trends
Chapter 7. Global Nutraceutical Products Market Outlook Trends
7.1. Global Nutraceutical Products Revenue (USD Million) and CAGR (%) by Type (2021-2032)
7.2. Global Nutraceutical Products Revenue (USD Million) and CAGR (%) by Application (2021-2032)
7.3. Global Nutraceutical Products Revenue (USD Million) and CAGR (%) by Product (2021-2032)
By Type
Food
-Snacks
-Confectionery products
-Bakery products
-Dairy products
-Infant products
Beverages
-Health drinks
-Energy drinks
-Juices
Dietary Supplements
-Tablets
-Liquid
-Powder
-Others
By Distribution Channel
Conventional Stores
-Grocery Stores
-Mass Merchandisers
-Warehouse Clubs
-Online Retailers
Specialty Stores
-Bakery Stores
-Confectionery Stores
-Gourmet Stores
-Health Centers
-Cosmetics Stores
By Source
Probiotics
Proteins & Amino Acids
Phytochemicals & Plant Extracts
Fibers & Specialty Carbohydrates
Omega-3 Fatty Acids
Vitamins
Prebiotics
Carotenoids
Minerals
Others
Chapter 8. Global Nutraceutical Products Regional Analysis and Outlook
8.1. Global Nutraceutical Products Revenue (USD Million) By Regions (2021- 2032)
8.2. North America Nutraceutical Products Revenue (USD Million) by Country (2021-2032)
8.2.1. United States Nutraceutical Products Regional Analysis and Outlook
8.2.2. Canada Nutraceutical Products Regional Analysis and Outlook
8.2.3. Mexico Nutraceutical Products Regional Analysis and Outlook
8.3. Europe Nutraceutical Products Revenue (USD Million), by Country (2021-2032)
8.3.1. Germany Nutraceutical Products Regional Analysis and Outlook
8.3.2. France Nutraceutical Products Regional Analysis and Outlook
8.3.3. United Kingdom Nutraceutical Products Regional Analysis and Outlook
8.3.4. Spain Nutraceutical Products Regional Analysis and Outlook
8.3.5. Italy Nutraceutical Products Regional Analysis and Outlook
8.3.6. Russia Nutraceutical Products Regional Analysis and Outlook
8.3.7. Rest of Europe Nutraceutical Products Regional Analysis and Outlook
8.4. Asia Pacific Nutraceutical Products Revenue (USD Million) by Country (2021-2032)
8.4.1. China Nutraceutical Products Regional Analysis and Outlook
8.4.2. Japan Nutraceutical Products Regional Analysis and Outlook
8.4.3. India Nutraceutical Products Regional Analysis and Outlook
8.4.4. South Korea Nutraceutical Products Regional Analysis and Outlook
8.4.5. Australia Nutraceutical Products Regional Analysis and Outlook
8.4.6. South East Asia Nutraceutical Products Regional Analysis and Outlook
8.4.7. Rest of Asia Pacific Nutraceutical Products Regional Analysis and Outlook
8.5. South America Nutraceutical Products Revenue (USD Million), by Country (2021-2032)
8.5.1. Brazil Nutraceutical Products Regional Analysis and Outlook
8.5.2. Argentina Nutraceutical Products Regional Analysis and Outlook
8.5.3. Rest of South America Nutraceutical Products Regional Analysis and Outlook
8.6. Middle East and Africa Nutraceutical Products Revenue (USD Million) by Country (2021-2032)
8.6.1. Middle East Nutraceutical Products Regional Analysis and Outlook
8.6.2. Africa Nutraceutical Products Regional Analysis and Outlook
Chapter 9. North America Nutraceutical Products Analysis and Outlook
9.1. North America Nutraceutical Products Revenue (USD Million) by Segments (2021-2032)
9.1.1. North America Nutraceutical Products Revenue (USD Million) by Type (2021-2032)
9.1.2. North America Nutraceutical Products Revenue (USD Million) by Application (2021-2032)
9.1.3. North America Nutraceutical Products Revenue (USD Million) by Product (2021-2032)
By Type
Food
-Snacks
-Confectionery products
-Bakery products
-Dairy products
-Infant products
Beverages
-Health drinks
-Energy drinks
-Juices
Dietary Supplements
-Tablets
-Liquid
-Powder
-Others
By Distribution Channel
Conventional Stores
-Grocery Stores
-Mass Merchandisers
-Warehouse Clubs
-Online Retailers
Specialty Stores
-Bakery Stores
-Confectionery Stores
-Gourmet Stores
-Health Centers
-Cosmetics Stores
By Source
Probiotics
Proteins & Amino Acids
Phytochemicals & Plant Extracts
Fibers & Specialty Carbohydrates
Omega-3 Fatty Acids
Vitamins
Prebiotics
Carotenoids
Minerals
Others
Chapter 10. Europe Nutraceutical Products Analysis and Outlook
10.1. Europe Nutraceutical Products Revenue (USD Million), by Segments (USD Million) (2021-2032)
10.1.1. Europe Nutraceutical Products Revenue (USD Million) by Type (2021-2032)
10.1.2. Europe Nutraceutical Products Revenue (USD Million) by Application (2021-2032)
10.1.3. Europe Nutraceutical Products Revenue (USD Million) by Product (2021-2032)
By Type
Food
-Snacks
-Confectionery products
-Bakery products
-Dairy products
-Infant products
Beverages
-Health drinks
-Energy drinks
-Juices
Dietary Supplements
-Tablets
-Liquid
-Powder
-Others
By Distribution Channel
Conventional Stores
-Grocery Stores
-Mass Merchandisers
-Warehouse Clubs
-Online Retailers
Specialty Stores
-Bakery Stores
-Confectionery Stores
-Gourmet Stores
-Health Centers
-Cosmetics Stores
By Source
Probiotics
Proteins & Amino Acids
Phytochemicals & Plant Extracts
Fibers & Specialty Carbohydrates
Omega-3 Fatty Acids
Vitamins
Prebiotics
Carotenoids
Minerals
Others
Chapter 11. Asia Pacific Nutraceutical Products Analysis and Outlook
11.1. Asia Pacific Nutraceutical Products Revenue (USD Million), and Revenue (USD Million) by Segments (2021-2032)
11.1.1. Asia Pacific Nutraceutical Products Revenue (USD Million) by Type (2021-2032)
11.1.2. Asia Pacific Nutraceutical Products Revenue (USD Million) by Application (2021-2032)
11.1.3. Asia Pacific Nutraceutical Products Revenue (USD Million) by Product (2021-2032)
By Type
Food
-Snacks
-Confectionery products
-Bakery products
-Dairy products
-Infant products
Beverages
-Health drinks
-Energy drinks
-Juices
Dietary Supplements
-Tablets
-Liquid
-Powder
-Others
By Distribution Channel
Conventional Stores
-Grocery Stores
-Mass Merchandisers
-Warehouse Clubs
-Online Retailers
Specialty Stores
-Bakery Stores
-Confectionery Stores
-Gourmet Stores
-Health Centers
-Cosmetics Stores
By Source
Probiotics
Proteins & Amino Acids
Phytochemicals & Plant Extracts
Fibers & Specialty Carbohydrates
Omega-3 Fatty Acids
Vitamins
Prebiotics
Carotenoids
Minerals
Others
Chapter 12. South America Nutraceutical Products Analysis and Outlook
12.1. South America Nutraceutical Products Revenue (USD Million), by Segments (2021-2032)
12.1.1. South America Nutraceutical Products Revenue (USD Million) by Type (2021-2032)
12.1.2. South America Nutraceutical Products Revenue (USD Million) by Application (2021-2032)
12.1.3. South America Nutraceutical Products Revenue (USD Million) by Product (2021-2032)
By Type
Food
-Snacks
-Confectionery products
-Bakery products
-Dairy products
-Infant products
Beverages
-Health drinks
-Energy drinks
-Juices
Dietary Supplements
-Tablets
-Liquid
-Powder
-Others
By Distribution Channel
Conventional Stores
-Grocery Stores
-Mass Merchandisers
-Warehouse Clubs
-Online Retailers
Specialty Stores
-Bakery Stores
-Confectionery Stores
-Gourmet Stores
-Health Centers
-Cosmetics Stores
By Source
Probiotics
Proteins & Amino Acids
Phytochemicals & Plant Extracts
Fibers & Specialty Carbohydrates
Omega-3 Fatty Acids
Vitamins
Prebiotics
Carotenoids
Minerals
Others
Chapter 13. Middle East and Africa Nutraceutical Products Analysis and Outlook
13.1. Middle East and Africa Nutraceutical Products Revenue (USD Million), by Segments (2021-2032)
13.1.1. Middle East and Africa Nutraceutical Products Revenue (USD Million) by Type (2021-2032)
13.1.2. Middle East and Africa Nutraceutical Products Revenue (USD Million) by Application (2021-2032)
13.1.3. Middle East and Africa Nutraceutical Products Revenue (USD Million) by Product (2021-2032)
By Type
Food
-Snacks
-Confectionery products
-Bakery products
-Dairy products
-Infant products
Beverages
-Health drinks
-Energy drinks
-Juices
Dietary Supplements
-Tablets
-Liquid
-Powder
-Others
By Distribution Channel
Conventional Stores
-Grocery Stores
-Mass Merchandisers
-Warehouse Clubs
-Online Retailers
Specialty Stores
-Bakery Stores
-Confectionery Stores
-Gourmet Stores
-Health Centers
-Cosmetics Stores
By Source
Probiotics
Proteins & Amino Acids
Phytochemicals & Plant Extracts
Fibers & Specialty Carbohydrates
Omega-3 Fatty Acids
Vitamins
Prebiotics
Carotenoids
Minerals
Others
Chapter 14. Nutraceutical Products Company Profiles
14.1 Business Overview
14.2 Product Profiles
14.3 SWOT Profiles
14.5 Recent Developments
14.6 Financial Profile
List of Companies
Amway Corp
Barilla Group
Conagra
Freedom Food Group Ltd
General Mills Inc
Hero Group
Kellogg Company
Nature’s Bounty
Nestlé SA
Pfizer Inc
Raisio Group
The Hain Celestial Group
The Kraft Heinz Company
15. Methodology and Data Sources
15.1 Customization Offerings
15.2 Subscription Services
15.3 Related Reports
15.4 Publisher Expertise
LIST OF TABLES
Table 1 Market Segmentation Analysis
Table 2 Global Nutraceutical Products Market Share of Leading Companies, 2023
Table 3 Product Offerings of Leading Companies
Table 4 Low Growth Scenario Forecasts
Table 5 Reference Case Growth Scenario
Table 6 High Growth Case Scenario
Table 7 Global Nutraceutical Products Revenue (USD Million) And CAGR (%) By Type (2021-2032)
Table 8 Global Nutraceutical Products Revenue (USD Million) And CAGR (%) By Application (2021-2032)
Table 9 Global Nutraceutical Products Revenue (USD Million) And CAGR (%) By Product (2021-2032)
Table 10 Global Nutraceutical Products Market Revenue (USD Million) By Regions (2021-2032)
Table 11 Global Nutraceutical Products Market Share (%) By Regions (2021-2032)
Table 12 North America Nutraceutical Products Revenue (USD Million) By Country (2021-2032)
Table 13 Europe Nutraceutical Products Revenue (USD Million) By Country (2021-2032)
Table 14 Asia Pacific Nutraceutical Products Revenue (USD Million) By Country (2021-2032)
Table 15 South America Nutraceutical Products Revenue (USD Million) By Country (2021-2032)
Table 16 Middle East and Africa Nutraceutical Products Revenue (USD Million) By Region (2021-2032)
Table 17 North America Nutraceutical Products Revenue (USD Million) By Type (2021-2032)
Table 18 North America Nutraceutical Products Revenue (USD Million) By Application (2021-2032)
Table 19 North America Nutraceutical Products Revenue (USD Million) By Product (2021-2032)
Table 20 Europe Nutraceutical Products Revenue (USD Million) By Type (2021-2032)
Table 21 Europe Nutraceutical Products Revenue (USD Million) By Application (2021-2032)
Table 22 Europe Nutraceutical Products Revenue (USD Million) By Product (2021-2032)
Table 23 Asia Pacific Nutraceutical Products Revenue (USD Million) By Type (2021-2032)
Table 24 Asia Pacific Nutraceutical Products Revenue (USD Million) By Application (2021-2032)
Table 25 Asia Pacific Nutraceutical Products Revenue (USD Million) By Product (2021-2032)
Table 26 South America Nutraceutical Products Revenue (USD Million) By Type (2021-2032)
Table 27 South America Nutraceutical Products Revenue (USD Million) By Application (2021-2032)
Table 28 South America Nutraceutical Products Revenue (USD Million) By Product (2021-2032)
Table 29 Middle East and Africa Nutraceutical Products Revenue (USD Million) By Type (2021-2032)
Table 30 Middle East and Africa Nutraceutical Products Revenue (USD Million) By Application (2021-2032)
Table 31 Middle East and Africa Nutraceutical Products Revenue (USD Million) By Product (2021-2032)
LIST OF FIGURES
Figure 1. Market Scope
Figure 2. Pricing Forecasts Per Unit, 2023- 2032
Figure 3. Porter’s Five Forces
Figure 4. Global Nutraceutical Products Market Revenue (USD Million) By Regions (2021-2032)
Figure 5. Global Nutraceutical Products Market Share (%) By Regions (2023)
Figure 6. North America Nutraceutical Products Revenue (USD Million) By Country (2021-2032)
Figure 7. United States Nutraceutical Products Revenue (USD Million) By Country (2021-2032)
Figure 8. Canada Nutraceutical Products Revenue (USD Million) By Country (2021-2032)
Figure 9. Mexico Nutraceutical Products Revenue (USD Million) By Country (2021-2032)
Figure 10. Europe Nutraceutical Products Revenue (USD Million) By Country (2021-2032)
Figure 11. Germany Nutraceutical Products Revenue (USD Million) By Country (2021-2032)
Figure 12. France Nutraceutical Products Revenue (USD Million) By Country (2021-2032)
Figure 13. United Kingdom Nutraceutical Products Revenue (USD Million) By Country (2021-2032)
Figure 14. Spain Nutraceutical Products Revenue (USD Million) By Country (2021-2032)
Figure 15. Italy Nutraceutical Products Revenue (USD Million) By Country (2021-2032)
Figure 16. Russia Nutraceutical Products Revenue (USD Million) By Country (2021-2032)
Figure 17. Rest of Europe Nutraceutical Products Revenue (USD Million) By Country (2021-2032)
Figure 11. Asia Pacific Nutraceutical Products Revenue (USD Million) By Country (2021-2032)
Figure 12. China Nutraceutical Products Revenue (USD Million) By Country (2021-2032)
Figure 13. Japan Nutraceutical Products Revenue (USD Million) By Country (2021-2032)
Figure 14. India Nutraceutical Products Revenue (USD Million) By Country (2021-2032)
Figure 15. South Korea Nutraceutical Products Revenue (USD Million) By Country (2021-2032)
Figure 16. Australia Nutraceutical Products Revenue (USD Million) By Country (2021-2032)
Figure 17. South East Asia Nutraceutical Products Revenue (USD Million) By Country (2021-2032)
Figure 18. South America Nutraceutical Products Revenue (USD Million) By Country (2021-2032)
Figure 19. Brazil Nutraceutical Products Revenue (USD Million) By Country (2021-2032)
Figure 20. Argentina Nutraceutical Products Revenue (USD Million) By Country (2021-2032)
Figure 21. Rest of Asia Pacific Nutraceutical Products Revenue (USD Million) By Country (2021-2032)
Figure 22. Middle East and Africa Nutraceutical Products Revenue (USD Million) By Region (2021-2032)
Figure 23. Saudi Arabia Nutraceutical Products Revenue (USD Million) By Region (2021-2032)
Figure 24. The UAE Nutraceutical Products Revenue (USD Million) By Region (2021-2032)
Figure 25. Rest of Middle East Nutraceutical Products Revenue (USD Million) By Region (2021-2032)
Figure 26. South Africa Nutraceutical Products Revenue (USD Million) By Region (2021-2032)
Figure 27. Africa Nutraceutical Products Revenue (USD Million) By Region (2021-2032)
Figure 28. North America Nutraceutical Products Revenue (USD Million) By Type (2021-2032)
Figure 29. North America Nutraceutical Products Revenue (USD Million) By Application (2021-2032)
Figure 30. North America Nutraceutical Products Revenue (USD Million) By Product (2021-2032)
Figure 31. Europe Nutraceutical Products Revenue (USD Million) By Type (2021-2032)
Figure 32. Europe Nutraceutical Products Revenue (USD Million) By Application (2021-2032)
Figure 33. Europe Nutraceutical Products Revenue (USD Million) By Product (2021-2032)
Figure 34. Asia Pacific Nutraceutical Products Revenue (USD Million) By Type (2021-2032)
Figure 35. Asia Pacific Nutraceutical Products Revenue (USD Million) By Application (2021-2032)
Figure 36. Asia Pacific Nutraceutical Products Revenue (USD Million) By Product (2021-2032)
Figure 37. South America Nutraceutical Products Revenue (USD Million) By Type (2021-2032)
Figure 38. South America Nutraceutical Products Revenue (USD Million) By Application (2021-2032)
Figure 39. South America Nutraceutical Products Revenue (USD Million) By Product (2021-2032)
Figure 40. Middle East and Africa Nutraceutical Products Revenue (USD Million) By Type (2021-2032)
Figure 41. Middle East and Africa Nutraceutical Products Revenue (USD Million) By Application (2021-2032)
Figure 42. Middle East and Africa Nutraceutical Products Revenue (USD Million) By Product (2021-2032)
By Type
Food
-Snacks
-Confectionery products
-Bakery products
-Dairy products
-Infant products
Beverages
-Health drinks
-Energy drinks
-Juices
Dietary Supplements
-Tablets
-Liquid
-Powder
-Others
By Distribution Channel
Conventional Stores
-Grocery Stores
-Mass Merchandisers
-Warehouse Clubs
-Online Retailers
Specialty Stores
-Bakery Stores
-Confectionery Stores
-Gourmet Stores
-Health Centers
-Cosmetics Stores
By Source
Probiotics
Proteins & Amino Acids
Phytochemicals & Plant Extracts
Fibers & Specialty Carbohydrates
Omega-3 Fatty Acids
Vitamins
Prebiotics
Carotenoids
Minerals
Others
Countries Analyzed
North America (US, Canada, Mexico)
Europe (Germany, UK, France, Spain, Italy, Russia, Rest of Europe)
Asia Pacific (China, India, Japan, South Korea, Australia, South East Asia, Rest of Asia)
South America (Brazil, Argentina, Rest of South America)
Middle East and Africa (Saudi Arabia, UAE, Rest of Middle East, South Africa, Egypt, Rest of Africa)
