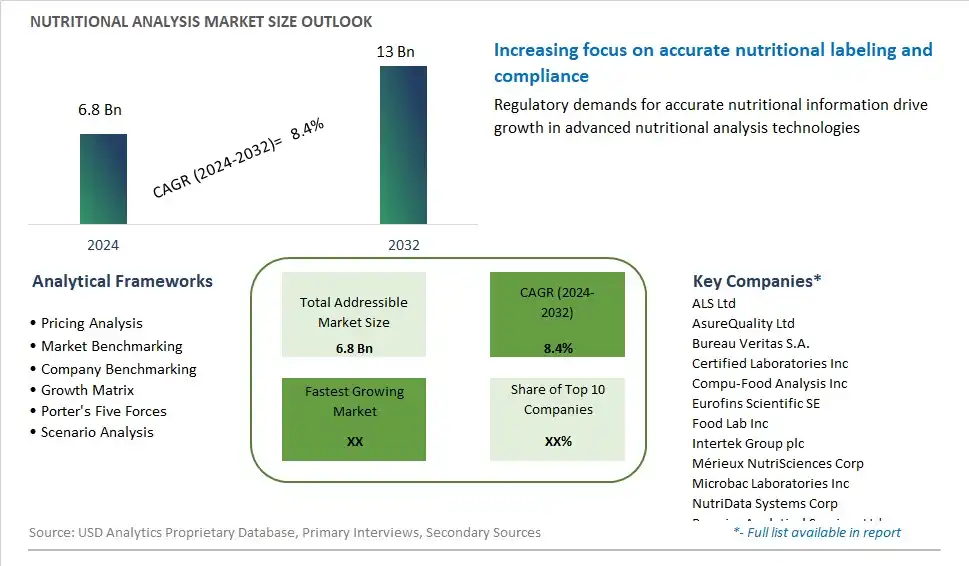
Global Nutritional Analysis Market Size is valued at $6.8 Billion in 2024 and is forecast to register a growth rate (CAGR) of 8.4% to reach $13 Billion by 2032.
The global Nutritional Analysis Market Comprehensive Study analyzes and forecasts the market size across 6 regions and 24 countries for diverse segments -By Parameter (Vitamin Profile, Proteins, Fat Profile, Sugar Profile, Total Dietary Profile, Mineral Profile, Cholesterol, Calories, Moisture, Others), By Product (Beverages, Snacks, Bakery and Confectionery, Meat and Poultry, Sauces, Dressings, Condiments, Dairy and Desserts, Fruits and Vegetables, Edible Fats and Oils, Baby Foods, Others), By Objective (New Product Development, Product Labeling, Regulatory Compliance)
An Introduction to Nutritional Analysis Market
Nutritional analysis involves the evaluation of food composition and nutrient content to assess its nutritional value, quality, and compliance with regulatory standards in 2024. This process includes measuring macronutrients (carbohydrates, proteins, fats), micronutrients (vitamins, minerals), fiber, sugars, and other bioactive compounds present in food products. Nutritional analysis is performed using various analytical techniques such as proximate analysis, chromatography, spectroscopy, and immunoassays, which provide accurate and comprehensive data on food composition and nutritional labeling. With increasing consumer demand for transparency, accuracy, and personalized nutrition, the market for nutritional analysis services and technologies is growing, driven by investments in laboratory infrastructure, method development, and data analytics that enable manufacturers, retailers, and regulators to ensure product quality, safety, and compliance with labeling regulations.
Nutritional Analysis Competitive Landscape
The market report analyses the leading companies in the industry including ALS Ltd, AsureQuality Ltd, Bureau Veritas S.A., Certified Laboratories Inc, Compu-Food Analysis Inc, Eurofins Scientific SE, Food Lab Inc, Intertek Group plc, Mérieux NutriSciences Corp, Microbac Laboratories Inc, NutriData Systems Corp, Premier Analytical Services Ltd, SGS SA, Thermo Fisher Scientific Inc, TÜV Nord Group, and Others.
Nutritional Analysis Market Dynamics
Nutritional Analysis Market Trend: Increasing Emphasis on Health and Nutrition
One prominent market trend in nutritional analysis is the increasing emphasis on health and nutrition, driven by growing consumer awareness of the impact of diet on overall well-being and disease prevention. As people become more health-conscious and seek to make informed dietary choices, there's a rising demand for accurate and comprehensive nutritional information about food products. This trend is further fueled by regulatory requirements for nutrition labeling, food safety standards, and health claims, prompting food manufacturers, retailers, and restaurants to invest in nutritional analysis services and technologies to meet compliance requirements and consumer expectations. Additionally, the proliferation of wellness trends, dietary lifestyles (such as veganism and keto), and personalized nutrition approaches is driving the need for tailored nutritional analysis solutions that cater to diverse dietary preferences and health goals.
Market Driver: Regulatory Compliance and Consumer Transparency
A key driver propelling the market for nutritional analysis is regulatory compliance and consumer transparency requirements in the food and beverage industry. Regulatory agencies worldwide impose strict guidelines and labeling regulations for nutritional content, allergen declarations, and ingredient transparency to protect public health and ensure consumer safety. Food manufacturers and retailers must comply with these regulations to avoid legal repercussions, product recalls, and damage to brand reputation. Moreover, consumer demand for transparency and accountability in food labeling is driving companies to provide detailed nutritional information, including calorie counts, macronutrient profiles, and ingredient lists, to help consumers make informed choices about their food purchases. As a result, the demand for reliable and accurate nutritional analysis services, laboratory testing, and software solutions to verify and validate nutritional claims is increasing, creating opportunities for growth and innovation in the nutritional analysis market.
Market Opportunity: Integration of Technology for Data Analysis and Insights
An opportunity within the nutritional analysis market lies in the integration of technology for data analysis and insights to enhance the accuracy, efficiency, and value of nutritional information for consumers and businesses. With advancements in analytical technologies, data analytics, and artificial intelligence (AI), there's potential to automate and streamline the process of nutritional analysis, from data collection and sample preparation to interpretation and reporting. Innovative solutions such as mobile apps, digital platforms, and cloud-based software enable users to access real-time nutritional data, track dietary intake, and receive personalized recommendations based on their nutritional needs and goals. Additionally, AI-driven algorithms can analyze vast datasets to identify nutritional trends, dietary patterns, and emerging health risks, providing valuable insights for food manufacturers, retailers, and policymakers to develop targeted interventions and product innovations. By leveraging technology for data-driven nutritional analysis and insights, companies can differentiate their offerings, improve consumer engagement, and capitalize on opportunities in the evolving nutrition and wellness market.
Nutritional Analysis Market Share Analysis: Total Dietary Profile held the dominant market share in 2024
In the nutritional analysis market, the Total Dietary Profile segment is the largest, driven by several pivotal factors. Total dietary profile analysis provides comprehensive insights into the nutritional composition of food and beverage products, encompassing key parameters such as vitamins, proteins, fats, sugars, minerals, cholesterol, calories, and moisture content. This holistic approach allows food manufacturers, regulatory authorities, and healthcare professionals to assess the overall nutritional quality and compliance of products with dietary guidelines and regulatory standards. Additionally, amid growing consumer demand for transparent labeling and health-conscious food choices, total dietary profile analysis plays a crucial role in product development, labeling accuracy, and quality assurance. Further, advancements in analytical techniques and instrumentation have enhanced the accuracy, speed, and efficiency of total dietary profile analysis, further driving market adoption. Furthermore, regulatory mandates and labeling requirements reinforce the importance of total dietary profile analysis in ensuring food safety, nutritional adequacy, and consumer trust. As stakeholders across the food industry prioritize nutritional transparency and compliance with regulatory standards, the Total Dietary Profile segment remains at the forefront, driving growth and innovation in the nutritional analysis market.
Nutritional Analysis Market Share Analysis: Beverages market is poised to register the fastest growth rae over the forecast period to 2032
In the nutritional analysis market, the Beverages segment is the fastest-growing, propelled by several pivotal factors. Beverages, including juices, energy drinks, functional beverages, and herbal teas, represent a diverse and rapidly expanding category of products catering to evolving consumer preferences for health and wellness. As consumers increasingly seek functional and nutritious beverage options, the demand for accurate nutritional analysis becomes paramount for manufacturers to meet labeling requirements and consumer expectations. Additionally, the rise of niche beverage segments such as plant-based milks, probiotic drinks, and low-sugar beverages further drives the need for comprehensive nutritional analysis to ensure product differentiation and market competitiveness. Further, regulatory scrutiny and consumer awareness regarding nutritional labeling and health claims propel the adoption of nutritional analysis services to validate product claims and ensure compliance with labeling regulations. Furthermore, advancements in analytical technologies and automation streamline the process of nutritional analysis, making it more accessible and cost-effective for beverage manufacturers. As the beverage market continues to innovate and diversify to meet evolving consumer demands, the Beverages segment is poised to maintain its rapid growth trajectory, driving innovation and shaping the future of the nutritional analysis market.
Nutritional Analysis Market Share Analysis: Regulatory Compliance held the dominant market share in 2024
In the nutritional analysis market, the Regulatory Compliance segment is the largest, driven by several critical factors. Regulatory compliance with nutritional labeling requirements is a fundamental aspect of food and beverage manufacturing, mandated by government agencies to ensure consumer safety and transparency. Nutritional analysis plays a pivotal role in helping companies meet these regulatory standards by accurately assessing the nutritional content of their products and ensuring that the information provided on labels is truthful and compliant with regulations. Additionally, as consumers increasingly prioritize health-conscious purchasing decisions, regulatory compliance has become a key differentiator for brands seeking to build trust and credibility with their target audience. Further, the complexity of labeling regulations, coupled with the need for accurate and reliable analysis, further underscores the significance of the Regulatory Compliance segment in the nutritional analysis market. Furthermore, advancements in analytical technologies and software solutions streamline the process of regulatory compliance, enabling manufacturers to efficiently navigate the intricate landscape of labeling requirements. As regulatory scrutiny continues to intensify and consumer demand for transparent labeling grows, the Regulatory Compliance segment remains at the forefront, driving growth and shaping the future of the nutritional analysis market.
Nutritional Analysis Market Segmentation
By Parameter
Vitamin Profile
Proteins
Fat Profile
Sugar Profile
Total Dietary Profile
Mineral Profile
Cholesterol
Calories
Moisture
Others
By Product
Beverages
Snacks
Bakery and Confectionery
Meat and Poultry
Sauces
Dressings
Condiments
Dairy and Desserts
Fruits and Vegetables
Edible Fats and Oils
Baby Foods
Others
By Objective
New Product Development
Product Labeling
Regulatory Compliance
Countries Analyzed
North America (US, Canada, Mexico)
Europe (Germany, UK, France, Spain, Italy, Russia, Rest of Europe)
Asia Pacific (China, India, Japan, South Korea, Australia, South East Asia, Rest of Asia)
South America (Brazil, Argentina, Rest of South America)
Middle East and Africa (Saudi Arabia, UAE, Rest of Middle East, South Africa, Egypt, Rest of Africa)
Nutritional Analysis Companies Profiled in the Study
ALS Ltd
AsureQuality Ltd
Bureau Veritas S.A.
Certified Laboratories Inc
Compu-Food Analysis Inc
Eurofins Scientific SE
Food Lab Inc
Intertek Group plc
Mérieux NutriSciences Corp
Microbac Laboratories Inc
NutriData Systems Corp
Premier Analytical Services Ltd
SGS SA
Thermo Fisher Scientific Inc
TÜV Nord Group
*- List Not Exhaustive
Chapter 1. TABLE OF CONTENTS
Chapter 2. Introduction to Nutritional Analysis Market
2.1. Market Overview
2.2. Key Statistics and Report Highlights
2.3. Scope of the Comprehensive Study
2.3.1. Market Definition
2.3.2 Countries and Regions Covered
2.3.3 Research Objective
2.3.4 Units, Currency, and Conversions
2.3.5 Industry Value Chain
2.4. Key Market Segments
2.5. Key Companies
2.6. Study Period
Chapter 3. Strategic Analysis Review
3.1. Nutritional Analysis Pricing Analysis and Forecast
3.2. Porter’s Five Forces
3.3. Market Ecosystem
3.4. SWOT Analysis
3.5. Regulatory Scenario
3.3. Effects of Inflation, Russia-Ukraine War, moderating economic growth, and other macroeconomic factors
Chapter 4. Competitive Landscape
4.1. Market Share Analysis
4.1.1. Global Nutritional Analysis Market Share by Company, 2023
4.1.2. Product Offerings of Leading Nutritional Analysis Companies
4.2. Market Entropy
4.2.1. New Product Launches in the Industry
4.2.2. Mergers, Acquisitions, Joint ventures, and Partnerships
4.3. Key Strategies and Best Practices
Chapter 5. Global Market Projections: Best, Reference, and Low Case Scenarios
5.1. Growth Analysis- Case Scenario Definitions
5.2. Low Growth Case Scenario Forecasts
5.3. Reference Growth Case Scenario Forecasts
5.4. High Growth Case Scenario Forecasts
Chapter 6. Market Dynamics
6.1. Nutritional Analysis Market Drivers
6.2. Nutritional Analysis Market Challenges
6.6. Nutritional Analysis Market Opportunities
6.4. Nutritional Analysis Market Trends
Chapter 7. Global Nutritional Analysis Market Outlook Trends
7.1. Global Nutritional Analysis Revenue (USD Million) and CAGR (%) by Type (2021-2032)
7.2. Global Nutritional Analysis Revenue (USD Million) and CAGR (%) by Application (2021-2032)
7.3. Global Nutritional Analysis Revenue (USD Million) and CAGR (%) by Product (2021-2032)
By Parameter
Vitamin Profile
Proteins
Fat Profile
Sugar Profile
Total Dietary Profile
Mineral Profile
Cholesterol
Calories
Moisture
Others
By Product
Beverages
Snacks
Bakery and Confectionery
Meat and Poultry
Sauces
Dressings
Condiments
Dairy and Desserts
Fruits and Vegetables
Edible Fats and Oils
Baby Foods
Others
By Objective
New Product Development
Product Labeling
Regulatory Compliance
Chapter 8. Global Nutritional Analysis Regional Analysis and Outlook
8.1. Global Nutritional Analysis Revenue (USD Million) By Regions (2021- 2032)
8.2. North America Nutritional Analysis Revenue (USD Million) by Country (2021-2032)
8.2.1. United States Nutritional Analysis Regional Analysis and Outlook
8.2.2. Canada Nutritional Analysis Regional Analysis and Outlook
8.2.3. Mexico Nutritional Analysis Regional Analysis and Outlook
8.3. Europe Nutritional Analysis Revenue (USD Million), by Country (2021-2032)
8.3.1. Germany Nutritional Analysis Regional Analysis and Outlook
8.3.2. France Nutritional Analysis Regional Analysis and Outlook
8.3.3. United Kingdom Nutritional Analysis Regional Analysis and Outlook
8.3.4. Spain Nutritional Analysis Regional Analysis and Outlook
8.3.5. Italy Nutritional Analysis Regional Analysis and Outlook
8.3.6. Russia Nutritional Analysis Regional Analysis and Outlook
8.3.7. Rest of Europe Nutritional Analysis Regional Analysis and Outlook
8.4. Asia Pacific Nutritional Analysis Revenue (USD Million) by Country (2021-2032)
8.4.1. China Nutritional Analysis Regional Analysis and Outlook
8.4.2. Japan Nutritional Analysis Regional Analysis and Outlook
8.4.3. India Nutritional Analysis Regional Analysis and Outlook
8.4.4. South Korea Nutritional Analysis Regional Analysis and Outlook
8.4.5. Australia Nutritional Analysis Regional Analysis and Outlook
8.4.6. South East Asia Nutritional Analysis Regional Analysis and Outlook
8.4.7. Rest of Asia Pacific Nutritional Analysis Regional Analysis and Outlook
8.5. South America Nutritional Analysis Revenue (USD Million), by Country (2021-2032)
8.5.1. Brazil Nutritional Analysis Regional Analysis and Outlook
8.5.2. Argentina Nutritional Analysis Regional Analysis and Outlook
8.5.3. Rest of South America Nutritional Analysis Regional Analysis and Outlook
8.6. Middle East and Africa Nutritional Analysis Revenue (USD Million) by Country (2021-2032)
8.6.1. Middle East Nutritional Analysis Regional Analysis and Outlook
8.6.2. Africa Nutritional Analysis Regional Analysis and Outlook
Chapter 9. North America Nutritional Analysis Analysis and Outlook
9.1. North America Nutritional Analysis Revenue (USD Million) by Segments (2021-2032)
9.1.1. North America Nutritional Analysis Revenue (USD Million) by Type (2021-2032)
9.1.2. North America Nutritional Analysis Revenue (USD Million) by Application (2021-2032)
9.1.3. North America Nutritional Analysis Revenue (USD Million) by Product (2021-2032)
By Parameter
Vitamin Profile
Proteins
Fat Profile
Sugar Profile
Total Dietary Profile
Mineral Profile
Cholesterol
Calories
Moisture
Others
By Product
Beverages
Snacks
Bakery and Confectionery
Meat and Poultry
Sauces
Dressings
Condiments
Dairy and Desserts
Fruits and Vegetables
Edible Fats and Oils
Baby Foods
Others
By Objective
New Product Development
Product Labeling
Regulatory Compliance
Chapter 10. Europe Nutritional Analysis Analysis and Outlook
10.1. Europe Nutritional Analysis Revenue (USD Million), by Segments (USD Million) (2021-2032)
10.1.1. Europe Nutritional Analysis Revenue (USD Million) by Type (2021-2032)
10.1.2. Europe Nutritional Analysis Revenue (USD Million) by Application (2021-2032)
10.1.3. Europe Nutritional Analysis Revenue (USD Million) by Product (2021-2032)
By Parameter
Vitamin Profile
Proteins
Fat Profile
Sugar Profile
Total Dietary Profile
Mineral Profile
Cholesterol
Calories
Moisture
Others
By Product
Beverages
Snacks
Bakery and Confectionery
Meat and Poultry
Sauces
Dressings
Condiments
Dairy and Desserts
Fruits and Vegetables
Edible Fats and Oils
Baby Foods
Others
By Objective
New Product Development
Product Labeling
Regulatory Compliance
Chapter 11. Asia Pacific Nutritional Analysis Analysis and Outlook
11.1. Asia Pacific Nutritional Analysis Revenue (USD Million), and Revenue (USD Million) by Segments (2021-2032)
11.1.1. Asia Pacific Nutritional Analysis Revenue (USD Million) by Type (2021-2032)
11.1.2. Asia Pacific Nutritional Analysis Revenue (USD Million) by Application (2021-2032)
11.1.3. Asia Pacific Nutritional Analysis Revenue (USD Million) by Product (2021-2032)
By Parameter
Vitamin Profile
Proteins
Fat Profile
Sugar Profile
Total Dietary Profile
Mineral Profile
Cholesterol
Calories
Moisture
Others
By Product
Beverages
Snacks
Bakery and Confectionery
Meat and Poultry
Sauces
Dressings
Condiments
Dairy and Desserts
Fruits and Vegetables
Edible Fats and Oils
Baby Foods
Others
By Objective
New Product Development
Product Labeling
Regulatory Compliance
Chapter 12. South America Nutritional Analysis Analysis and Outlook
12.1. South America Nutritional Analysis Revenue (USD Million), by Segments (2021-2032)
12.1.1. South America Nutritional Analysis Revenue (USD Million) by Type (2021-2032)
12.1.2. South America Nutritional Analysis Revenue (USD Million) by Application (2021-2032)
12.1.3. South America Nutritional Analysis Revenue (USD Million) by Product (2021-2032)
By Parameter
Vitamin Profile
Proteins
Fat Profile
Sugar Profile
Total Dietary Profile
Mineral Profile
Cholesterol
Calories
Moisture
Others
By Product
Beverages
Snacks
Bakery and Confectionery
Meat and Poultry
Sauces
Dressings
Condiments
Dairy and Desserts
Fruits and Vegetables
Edible Fats and Oils
Baby Foods
Others
By Objective
New Product Development
Product Labeling
Regulatory Compliance
Chapter 13. Middle East and Africa Nutritional Analysis Analysis and Outlook
13.1. Middle East and Africa Nutritional Analysis Revenue (USD Million), by Segments (2021-2032)
13.1.1. Middle East and Africa Nutritional Analysis Revenue (USD Million) by Type (2021-2032)
13.1.2. Middle East and Africa Nutritional Analysis Revenue (USD Million) by Application (2021-2032)
13.1.3. Middle East and Africa Nutritional Analysis Revenue (USD Million) by Product (2021-2032)
By Parameter
Vitamin Profile
Proteins
Fat Profile
Sugar Profile
Total Dietary Profile
Mineral Profile
Cholesterol
Calories
Moisture
Others
By Product
Beverages
Snacks
Bakery and Confectionery
Meat and Poultry
Sauces
Dressings
Condiments
Dairy and Desserts
Fruits and Vegetables
Edible Fats and Oils
Baby Foods
Others
By Objective
New Product Development
Product Labeling
Regulatory Compliance
Chapter 14. Nutritional Analysis Company Profiles
14.1 Business Overview
14.2 Product Profiles
14.3 SWOT Profiles
14.5 Recent Developments
14.6 Financial Profile
List of Companies
ALS Ltd
AsureQuality Ltd
Bureau Veritas S.A.
Certified Laboratories Inc
Compu-Food Analysis Inc
Eurofins Scientific SE
Food Lab Inc
Intertek Group plc
Mérieux NutriSciences Corp
Microbac Laboratories Inc
NutriData Systems Corp
Premier Analytical Services Ltd
SGS SA
Thermo Fisher Scientific Inc
TÜV Nord Group
15. Methodology and Data Sources
15.1 Customization Offerings
15.2 Subscription Services
15.3 Related Reports
15.4 Publisher Expertise
LIST OF TABLES
Table 1 Market Segmentation Analysis
Table 2 Global Nutritional Analysis Market Share of Leading Companies, 2023
Table 3 Product Offerings of Leading Companies
Table 4 Low Growth Scenario Forecasts
Table 5 Reference Case Growth Scenario
Table 6 High Growth Case Scenario
Table 7 Global Nutritional Analysis Revenue (USD Million) And CAGR (%) By Type (2021-2032)
Table 8 Global Nutritional Analysis Revenue (USD Million) And CAGR (%) By Application (2021-2032)
Table 9 Global Nutritional Analysis Revenue (USD Million) And CAGR (%) By Product (2021-2032)
Table 10 Global Nutritional Analysis Market Revenue (USD Million) By Regions (2021-2032)
Table 11 Global Nutritional Analysis Market Share (%) By Regions (2021-2032)
Table 12 North America Nutritional Analysis Revenue (USD Million) By Country (2021-2032)
Table 13 Europe Nutritional Analysis Revenue (USD Million) By Country (2021-2032)
Table 14 Asia Pacific Nutritional Analysis Revenue (USD Million) By Country (2021-2032)
Table 15 South America Nutritional Analysis Revenue (USD Million) By Country (2021-2032)
Table 16 Middle East and Africa Nutritional Analysis Revenue (USD Million) By Region (2021-2032)
Table 17 North America Nutritional Analysis Revenue (USD Million) By Type (2021-2032)
Table 18 North America Nutritional Analysis Revenue (USD Million) By Application (2021-2032)
Table 19 North America Nutritional Analysis Revenue (USD Million) By Product (2021-2032)
Table 20 Europe Nutritional Analysis Revenue (USD Million) By Type (2021-2032)
Table 21 Europe Nutritional Analysis Revenue (USD Million) By Application (2021-2032)
Table 22 Europe Nutritional Analysis Revenue (USD Million) By Product (2021-2032)
Table 23 Asia Pacific Nutritional Analysis Revenue (USD Million) By Type (2021-2032)
Table 24 Asia Pacific Nutritional Analysis Revenue (USD Million) By Application (2021-2032)
Table 25 Asia Pacific Nutritional Analysis Revenue (USD Million) By Product (2021-2032)
Table 26 South America Nutritional Analysis Revenue (USD Million) By Type (2021-2032)
Table 27 South America Nutritional Analysis Revenue (USD Million) By Application (2021-2032)
Table 28 South America Nutritional Analysis Revenue (USD Million) By Product (2021-2032)
Table 29 Middle East and Africa Nutritional Analysis Revenue (USD Million) By Type (2021-2032)
Table 30 Middle East and Africa Nutritional Analysis Revenue (USD Million) By Application (2021-2032)
Table 31 Middle East and Africa Nutritional Analysis Revenue (USD Million) By Product (2021-2032)
LIST OF FIGURES
Figure 1. Market Scope
Figure 2. Pricing Forecasts Per Unit, 2023- 2032
Figure 3. Porter’s Five Forces
Figure 4. Global Nutritional Analysis Market Revenue (USD Million) By Regions (2021-2032)
Figure 5. Global Nutritional Analysis Market Share (%) By Regions (2023)
Figure 6. North America Nutritional Analysis Revenue (USD Million) By Country (2021-2032)
Figure 7. United States Nutritional Analysis Revenue (USD Million) By Country (2021-2032)
Figure 8. Canada Nutritional Analysis Revenue (USD Million) By Country (2021-2032)
Figure 9. Mexico Nutritional Analysis Revenue (USD Million) By Country (2021-2032)
Figure 10. Europe Nutritional Analysis Revenue (USD Million) By Country (2021-2032)
Figure 11. Germany Nutritional Analysis Revenue (USD Million) By Country (2021-2032)
Figure 12. France Nutritional Analysis Revenue (USD Million) By Country (2021-2032)
Figure 13. United Kingdom Nutritional Analysis Revenue (USD Million) By Country (2021-2032)
Figure 14. Spain Nutritional Analysis Revenue (USD Million) By Country (2021-2032)
Figure 15. Italy Nutritional Analysis Revenue (USD Million) By Country (2021-2032)
Figure 16. Russia Nutritional Analysis Revenue (USD Million) By Country (2021-2032)
Figure 17. Rest of Europe Nutritional Analysis Revenue (USD Million) By Country (2021-2032)
Figure 11. Asia Pacific Nutritional Analysis Revenue (USD Million) By Country (2021-2032)
Figure 12. China Nutritional Analysis Revenue (USD Million) By Country (2021-2032)
Figure 13. Japan Nutritional Analysis Revenue (USD Million) By Country (2021-2032)
Figure 14. India Nutritional Analysis Revenue (USD Million) By Country (2021-2032)
Figure 15. South Korea Nutritional Analysis Revenue (USD Million) By Country (2021-2032)
Figure 16. Australia Nutritional Analysis Revenue (USD Million) By Country (2021-2032)
Figure 17. South East Asia Nutritional Analysis Revenue (USD Million) By Country (2021-2032)
Figure 18. South America Nutritional Analysis Revenue (USD Million) By Country (2021-2032)
Figure 19. Brazil Nutritional Analysis Revenue (USD Million) By Country (2021-2032)
Figure 20. Argentina Nutritional Analysis Revenue (USD Million) By Country (2021-2032)
Figure 21. Rest of Asia Pacific Nutritional Analysis Revenue (USD Million) By Country (2021-2032)
Figure 22. Middle East and Africa Nutritional Analysis Revenue (USD Million) By Region (2021-2032)
Figure 23. Saudi Arabia Nutritional Analysis Revenue (USD Million) By Region (2021-2032)
Figure 24. The UAE Nutritional Analysis Revenue (USD Million) By Region (2021-2032)
Figure 25. Rest of Middle East Nutritional Analysis Revenue (USD Million) By Region (2021-2032)
Figure 26. South Africa Nutritional Analysis Revenue (USD Million) By Region (2021-2032)
Figure 27. Africa Nutritional Analysis Revenue (USD Million) By Region (2021-2032)
Figure 28. North America Nutritional Analysis Revenue (USD Million) By Type (2021-2032)
Figure 29. North America Nutritional Analysis Revenue (USD Million) By Application (2021-2032)
Figure 30. North America Nutritional Analysis Revenue (USD Million) By Product (2021-2032)
Figure 31. Europe Nutritional Analysis Revenue (USD Million) By Type (2021-2032)
Figure 32. Europe Nutritional Analysis Revenue (USD Million) By Application (2021-2032)
Figure 33. Europe Nutritional Analysis Revenue (USD Million) By Product (2021-2032)
Figure 34. Asia Pacific Nutritional Analysis Revenue (USD Million) By Type (2021-2032)
Figure 35. Asia Pacific Nutritional Analysis Revenue (USD Million) By Application (2021-2032)
Figure 36. Asia Pacific Nutritional Analysis Revenue (USD Million) By Product (2021-2032)
Figure 37. South America Nutritional Analysis Revenue (USD Million) By Type (2021-2032)
Figure 38. South America Nutritional Analysis Revenue (USD Million) By Application (2021-2032)
Figure 39. South America Nutritional Analysis Revenue (USD Million) By Product (2021-2032)
Figure 40. Middle East and Africa Nutritional Analysis Revenue (USD Million) By Type (2021-2032)
Figure 41. Middle East and Africa Nutritional Analysis Revenue (USD Million) By Application (2021-2032)
Figure 42. Middle East and Africa Nutritional Analysis Revenue (USD Million) By Product (2021-2032)
By Parameter
Vitamin Profile
Proteins
Fat Profile
Sugar Profile
Total Dietary Profile
Mineral Profile
Cholesterol
Calories
Moisture
Others
By Product
Beverages
Snacks
Bakery and Confectionery
Meat and Poultry
Sauces
Dressings
Condiments
Dairy and Desserts
Fruits and Vegetables
Edible Fats and Oils
Baby Foods
Others
By Objective
New Product Development
Product Labeling
Regulatory Compliance
Countries Analyzed
North America (US, Canada, Mexico)
Europe (Germany, UK, France, Spain, Italy, Russia, Rest of Europe)
Asia Pacific (China, India, Japan, South Korea, Australia, South East Asia, Rest of Asia)
South America (Brazil, Argentina, Rest of South America)
Middle East and Africa (Saudi Arabia, UAE, Rest of Middle East, South Africa, Egypt, Rest of Africa)
