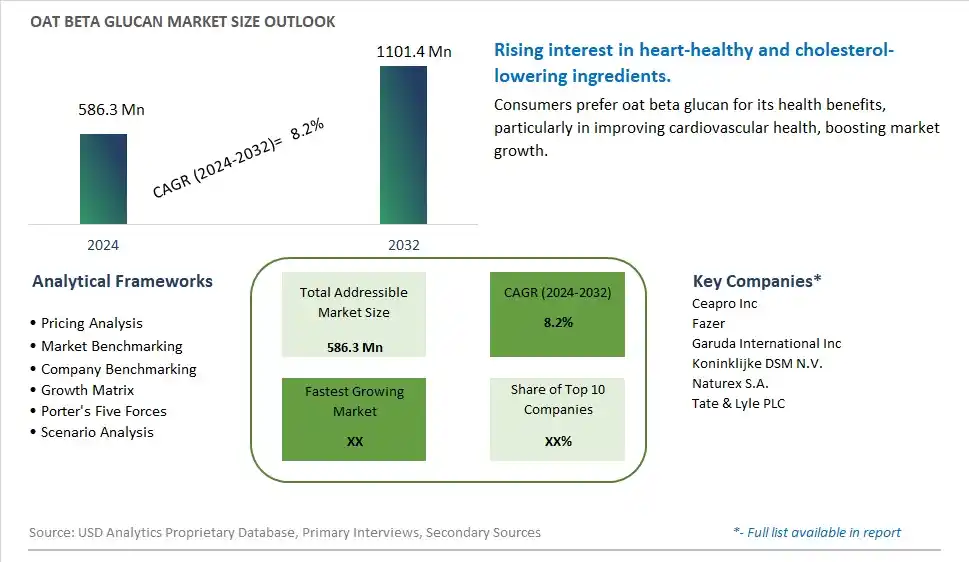
Global Oat Beta Glucan Market Size is valued at $586.3 Million in 2024 and is forecast to register a growth rate (CAGR) of 8.2% to reach $1101.4 Million by 2032.
The global Oat Beta Glucan Market Comprehensive Study analyzes and forecasts the market size across 6 regions and 24 countries for diverse segments -By Type (Organic, Conventional), By End-User (Food and Beverage, Pharmaceutical, Nutraceutical, Dietary Supplements, Cosmetic and Personal Care, Animal Nutrition)
An Introduction to Oat Beta Glucan Market
The oat beta glucan market in 2024 is expanding rapidly, driven by the demand for functional ingredients that promote heart health and immune function. Oat beta glucan, a soluble fiber found in oats, is used in various food and beverage applications for its cholesterol-lowering and immune-boosting properties. The market benefits from advancements in extraction and formulation technologies that enhance the efficacy and stability of oat beta glucan. The trend towards clean label and natural ingredients is influencing product development. Increasing consumer interest in functional foods and the popularity of heart-healthy diets are further propelling market growth.
Oat Beta Glucan Competitive Landscape
The market report analyses the leading companies in the industry including Ceapro Inc, Fazer, Garuda International Inc, Koninklijke DSM N.V., Naturex S.A., Tate & Lyle PLC, and Others.
Oat Beta Glucan Market Dynamics
Oat Beta Glucan Market Trend: Increasing Use in Health and Functional Foods
The most prominent trend in the Oat Beta Glucan Market is the increasing use in health and functional foods. Oat beta glucan, known for its cholesterol-lowering and immune-boosting properties, is becoming a sought-after ingredient in a variety of food products. This trend is driven by the demand for ingredients that offer multiple health benefits and enhance the nutritional profile of consumer products.
Oat Beta Glucan Market Driver: Health Consciousness and Preventive Health
A key driver in the Oat Beta Glucan Market is health consciousness and the focus on preventive health. As more individuals prioritize their health and seek to prevent chronic diseases through diet, there is a rising demand for oat beta glucan that provides proven health benefits, such as reducing cholesterol levels and supporting immune function. This demand supports market growth as consumers look for proactive ways to manage their health.
Oat Beta Glucan Market Opportunity: Innovation in Food and Beverage Applications
One significant opportunity in the Oat Beta Glucan Market lies in innovation in food and beverage applications. Companies can develop new products that incorporate oat beta glucan into functional foods, beverages, and dietary supplements, offering consumers convenient and effective ways to enhance their intake. By highlighting the health benefits and versatility of oat beta glucan, manufacturers can attract a broader consumer base and drive market growth.
Oat Beta Glucan Market Share Analysis- Largest Segment by Type
In the Oat Beta Glucan Market, Conventional oat beta glucan is the largest segment. This is primarily due to its established production processes and widespread use in various applications. Conventional oat beta glucan is well-integrated into a broad range of products, including food and beverages, dietary supplements, and pharmaceutical applications. It benefits from economies of scale and established supply chains, making it more readily available and cost-effective compared to organic alternatives. The widespread acceptance and usage of conventional oat beta glucan in mainstream products contribute to its dominant market position.
Oat Beta Glucan Market Share Analysis- Fastest Growing Segment by End-User
In the Oat Beta Glucan Market, Dietary Supplements is poised to grow the fastest over the next five years. The increasing consumer focus on preventive health measures and personalized nutrition is driving the demand for dietary supplements that incorporate oat beta glucan. This ingredient is valued for its beneficial effects on heart health, cholesterol levels, and immune function, which aligns well with current trends towards health optimization and disease prevention. The expansion of the dietary supplements market, driven by rising health awareness and an aging population, is expected to accelerate the growth of oat beta glucan in this segment.
Oat Beta Glucan Market Segmentation
By Type
Organic
Conventional
By End-User
Food and Beverage
Pharmaceutical
Nutraceutical
Dietary Supplements
Cosmetic and Personal Care
Animal Nutrition
Countries Analyzed
North America (US, Canada, Mexico)
Europe (Germany, UK, France, Spain, Italy, Russia, Rest of Europe)
Asia Pacific (China, India, Japan, South Korea, Australia, South East Asia, Rest of Asia)
South America (Brazil, Argentina, Rest of South America)
Middle East and Africa (Saudi Arabia, UAE, Rest of Middle East, South Africa, Egypt, Rest of Africa)
Oat Beta Glucan Companies Profiled in the Study
Ceapro Inc
Fazer
Garuda International Inc
Koninklijke DSM N.V.
Naturex S.A.
Tate & Lyle PLC
*- List Not Exhaustive
Chapter 1. TABLE OF CONTENTS
Chapter 2. Introduction to Oat Beta Glucan Market
2.1. Market Overview
2.2. Key Statistics and Report Highlights
2.3. Scope of the Comprehensive Study
2.3.1. Market Definition
2.3.2 Countries and Regions Covered
2.3.3 Research Objective
2.3.4 Units, Currency, and Conversions
2.3.5 Industry Value Chain
2.4. Key Market Segments
2.5. Key Companies
2.6. Study Period
Chapter 3. Strategic Analysis Review
3.1. Oat Beta Glucan Pricing Analysis and Forecast
3.2. Porter’s Five Forces
3.3. Market Ecosystem
3.4. SWOT Analysis
3.5. Regulatory Scenario
3.3. Effects of Inflation, Russia-Ukraine War, moderating economic growth, and other macroeconomic factors
Chapter 4. Competitive Landscape
4.1. Market Share Analysis
4.1.1. Global Oat Beta Glucan Market Share by Company, 2023
4.1.2. Product Offerings of Leading Oat Beta Glucan Companies
4.2. Market Entropy
4.2.1. New Product Launches in the Industry
4.2.2. Mergers, Acquisitions, Joint ventures, and Partnerships
4.3. Key Strategies and Best Practices
Chapter 5. Global Market Projections: Best, Reference, and Low Case Scenarios
5.1. Growth Analysis- Case Scenario Definitions
5.2. Low Growth Case Scenario Forecasts
5.3. Reference Growth Case Scenario Forecasts
5.4. High Growth Case Scenario Forecasts
Chapter 6. Market Dynamics
6.1. Oat Beta Glucan Market Drivers
6.2. Oat Beta Glucan Market Challenges
6.6. Oat Beta Glucan Market Opportunities
6.4. Oat Beta Glucan Market Trends
Chapter 7. Global Oat Beta Glucan Market Outlook Trends
7.1. Global Oat Beta Glucan Revenue (USD Million) and CAGR (%) by Type (2021-2032)
7.2. Global Oat Beta Glucan Revenue (USD Million) and CAGR (%) by Application (2021-2032)
7.3. Global Oat Beta Glucan Revenue (USD Million) and CAGR (%) by Product (2021-2032)
By Type
Organic
Conventional
By End-User
Food and Beverage
Pharmaceutical
Nutraceutical
Dietary Supplements
Cosmetic and Personal Care
Animal Nutrition
Chapter 8. Global Oat Beta Glucan Regional Analysis and Outlook
8.1. Global Oat Beta Glucan Revenue (USD Million) By Regions (2021- 2032)
8.2. North America Oat Beta Glucan Revenue (USD Million) by Country (2021-2032)
8.2.1. United States Oat Beta Glucan Regional Analysis and Outlook
8.2.2. Canada Oat Beta Glucan Regional Analysis and Outlook
8.2.3. Mexico Oat Beta Glucan Regional Analysis and Outlook
8.3. Europe Oat Beta Glucan Revenue (USD Million), by Country (2021-2032)
8.3.1. Germany Oat Beta Glucan Regional Analysis and Outlook
8.3.2. France Oat Beta Glucan Regional Analysis and Outlook
8.3.3. United Kingdom Oat Beta Glucan Regional Analysis and Outlook
8.3.4. Spain Oat Beta Glucan Regional Analysis and Outlook
8.3.5. Italy Oat Beta Glucan Regional Analysis and Outlook
8.3.6. Russia Oat Beta Glucan Regional Analysis and Outlook
8.3.7. Rest of Europe Oat Beta Glucan Regional Analysis and Outlook
8.4. Asia Pacific Oat Beta Glucan Revenue (USD Million) by Country (2021-2032)
8.4.1. China Oat Beta Glucan Regional Analysis and Outlook
8.4.2. Japan Oat Beta Glucan Regional Analysis and Outlook
8.4.3. India Oat Beta Glucan Regional Analysis and Outlook
8.4.4. South Korea Oat Beta Glucan Regional Analysis and Outlook
8.4.5. Australia Oat Beta Glucan Regional Analysis and Outlook
8.4.6. South East Asia Oat Beta Glucan Regional Analysis and Outlook
8.4.7. Rest of Asia Pacific Oat Beta Glucan Regional Analysis and Outlook
8.5. South America Oat Beta Glucan Revenue (USD Million), by Country (2021-2032)
8.5.1. Brazil Oat Beta Glucan Regional Analysis and Outlook
8.5.2. Argentina Oat Beta Glucan Regional Analysis and Outlook
8.5.3. Rest of South America Oat Beta Glucan Regional Analysis and Outlook
8.6. Middle East and Africa Oat Beta Glucan Revenue (USD Million) by Country (2021-2032)
8.6.1. Middle East Oat Beta Glucan Regional Analysis and Outlook
8.6.2. Africa Oat Beta Glucan Regional Analysis and Outlook
Chapter 9. North America Oat Beta Glucan Analysis and Outlook
9.1. North America Oat Beta Glucan Revenue (USD Million) by Segments (2021-2032)
9.1.1. North America Oat Beta Glucan Revenue (USD Million) by Type (2021-2032)
9.1.2. North America Oat Beta Glucan Revenue (USD Million) by Application (2021-2032)
9.1.3. North America Oat Beta Glucan Revenue (USD Million) by Product (2021-2032)
By Type
Organic
Conventional
By End-User
Food and Beverage
Pharmaceutical
Nutraceutical
Dietary Supplements
Cosmetic and Personal Care
Animal Nutrition
Chapter 10. Europe Oat Beta Glucan Analysis and Outlook
10.1. Europe Oat Beta Glucan Revenue (USD Million), by Segments (USD Million) (2021-2032)
10.1.1. Europe Oat Beta Glucan Revenue (USD Million) by Type (2021-2032)
10.1.2. Europe Oat Beta Glucan Revenue (USD Million) by Application (2021-2032)
10.1.3. Europe Oat Beta Glucan Revenue (USD Million) by Product (2021-2032)
By Type
Organic
Conventional
By End-User
Food and Beverage
Pharmaceutical
Nutraceutical
Dietary Supplements
Cosmetic and Personal Care
Animal Nutrition
Chapter 11. Asia Pacific Oat Beta Glucan Analysis and Outlook
11.1. Asia Pacific Oat Beta Glucan Revenue (USD Million), and Revenue (USD Million) by Segments (2021-2032)
11.1.1. Asia Pacific Oat Beta Glucan Revenue (USD Million) by Type (2021-2032)
11.1.2. Asia Pacific Oat Beta Glucan Revenue (USD Million) by Application (2021-2032)
11.1.3. Asia Pacific Oat Beta Glucan Revenue (USD Million) by Product (2021-2032)
By Type
Organic
Conventional
By End-User
Food and Beverage
Pharmaceutical
Nutraceutical
Dietary Supplements
Cosmetic and Personal Care
Animal Nutrition
Chapter 12. South America Oat Beta Glucan Analysis and Outlook
12.1. South America Oat Beta Glucan Revenue (USD Million), by Segments (2021-2032)
12.1.1. South America Oat Beta Glucan Revenue (USD Million) by Type (2021-2032)
12.1.2. South America Oat Beta Glucan Revenue (USD Million) by Application (2021-2032)
12.1.3. South America Oat Beta Glucan Revenue (USD Million) by Product (2021-2032)
By Type
Organic
Conventional
By End-User
Food and Beverage
Pharmaceutical
Nutraceutical
Dietary Supplements
Cosmetic and Personal Care
Animal Nutrition
Chapter 13. Middle East and Africa Oat Beta Glucan Analysis and Outlook
13.1. Middle East and Africa Oat Beta Glucan Revenue (USD Million), by Segments (2021-2032)
13.1.1. Middle East and Africa Oat Beta Glucan Revenue (USD Million) by Type (2021-2032)
13.1.2. Middle East and Africa Oat Beta Glucan Revenue (USD Million) by Application (2021-2032)
13.1.3. Middle East and Africa Oat Beta Glucan Revenue (USD Million) by Product (2021-2032)
By Type
Organic
Conventional
By End-User
Food and Beverage
Pharmaceutical
Nutraceutical
Dietary Supplements
Cosmetic and Personal Care
Animal Nutrition
Chapter 14. Oat Beta Glucan Company Profiles
14.1 Business Overview
14.2 Product Profiles
14.3 SWOT Profiles
14.5 Recent Developments
14.6 Financial Profile
List of Companies
Ceapro Inc
Fazer
Garuda International Inc
Koninklijke DSM N.V.
Naturex S.A.
Tate & Lyle PLC
15. Methodology and Data Sources
15.1 Customization Offerings
15.2 Subscription Services
15.3 Related Reports
15.4 Publisher Expertise
LIST OF TABLES
Table 1 Market Segmentation Analysis
Table 2 Global Oat Beta Glucan Market Share of Leading Companies, 2023
Table 3 Product Offerings of Leading Companies
Table 4 Low Growth Scenario Forecasts
Table 5 Reference Case Growth Scenario
Table 6 High Growth Case Scenario
Table 7 Global Oat Beta Glucan Revenue (USD Million) And CAGR (%) By Type (2021-2032)
Table 8 Global Oat Beta Glucan Revenue (USD Million) And CAGR (%) By Application (2021-2032)
Table 9 Global Oat Beta Glucan Revenue (USD Million) And CAGR (%) By Product (2021-2032)
Table 10 Global Oat Beta Glucan Market Revenue (USD Million) By Regions (2021-2032)
Table 11 Global Oat Beta Glucan Market Share (%) By Regions (2021-2032)
Table 12 North America Oat Beta Glucan Revenue (USD Million) By Country (2021-2032)
Table 13 Europe Oat Beta Glucan Revenue (USD Million) By Country (2021-2032)
Table 14 Asia Pacific Oat Beta Glucan Revenue (USD Million) By Country (2021-2032)
Table 15 South America Oat Beta Glucan Revenue (USD Million) By Country (2021-2032)
Table 16 Middle East and Africa Oat Beta Glucan Revenue (USD Million) By Region (2021-2032)
Table 17 North America Oat Beta Glucan Revenue (USD Million) By Type (2021-2032)
Table 18 North America Oat Beta Glucan Revenue (USD Million) By Application (2021-2032)
Table 19 North America Oat Beta Glucan Revenue (USD Million) By Product (2021-2032)
Table 20 Europe Oat Beta Glucan Revenue (USD Million) By Type (2021-2032)
Table 21 Europe Oat Beta Glucan Revenue (USD Million) By Application (2021-2032)
Table 22 Europe Oat Beta Glucan Revenue (USD Million) By Product (2021-2032)
Table 23 Asia Pacific Oat Beta Glucan Revenue (USD Million) By Type (2021-2032)
Table 24 Asia Pacific Oat Beta Glucan Revenue (USD Million) By Application (2021-2032)
Table 25 Asia Pacific Oat Beta Glucan Revenue (USD Million) By Product (2021-2032)
Table 26 South America Oat Beta Glucan Revenue (USD Million) By Type (2021-2032)
Table 27 South America Oat Beta Glucan Revenue (USD Million) By Application (2021-2032)
Table 28 South America Oat Beta Glucan Revenue (USD Million) By Product (2021-2032)
Table 29 Middle East and Africa Oat Beta Glucan Revenue (USD Million) By Type (2021-2032)
Table 30 Middle East and Africa Oat Beta Glucan Revenue (USD Million) By Application (2021-2032)
Table 31 Middle East and Africa Oat Beta Glucan Revenue (USD Million) By Product (2021-2032)
LIST OF FIGURES
Figure 1. Market Scope
Figure 2. Pricing Forecasts Per Unit, 2023- 2032
Figure 3. Porter’s Five Forces
Figure 4. Global Oat Beta Glucan Market Revenue (USD Million) By Regions (2021-2032)
Figure 5. Global Oat Beta Glucan Market Share (%) By Regions (2023)
Figure 6. North America Oat Beta Glucan Revenue (USD Million) By Country (2021-2032)
Figure 7. United States Oat Beta Glucan Revenue (USD Million) By Country (2021-2032)
Figure 8. Canada Oat Beta Glucan Revenue (USD Million) By Country (2021-2032)
Figure 9. Mexico Oat Beta Glucan Revenue (USD Million) By Country (2021-2032)
Figure 10. Europe Oat Beta Glucan Revenue (USD Million) By Country (2021-2032)
Figure 11. Germany Oat Beta Glucan Revenue (USD Million) By Country (2021-2032)
Figure 12. France Oat Beta Glucan Revenue (USD Million) By Country (2021-2032)
Figure 13. United Kingdom Oat Beta Glucan Revenue (USD Million) By Country (2021-2032)
Figure 14. Spain Oat Beta Glucan Revenue (USD Million) By Country (2021-2032)
Figure 15. Italy Oat Beta Glucan Revenue (USD Million) By Country (2021-2032)
Figure 16. Russia Oat Beta Glucan Revenue (USD Million) By Country (2021-2032)
Figure 17. Rest of Europe Oat Beta Glucan Revenue (USD Million) By Country (2021-2032)
Figure 11. Asia Pacific Oat Beta Glucan Revenue (USD Million) By Country (2021-2032)
Figure 12. China Oat Beta Glucan Revenue (USD Million) By Country (2021-2032)
Figure 13. Japan Oat Beta Glucan Revenue (USD Million) By Country (2021-2032)
Figure 14. India Oat Beta Glucan Revenue (USD Million) By Country (2021-2032)
Figure 15. South Korea Oat Beta Glucan Revenue (USD Million) By Country (2021-2032)
Figure 16. Australia Oat Beta Glucan Revenue (USD Million) By Country (2021-2032)
Figure 17. South East Asia Oat Beta Glucan Revenue (USD Million) By Country (2021-2032)
Figure 18. South America Oat Beta Glucan Revenue (USD Million) By Country (2021-2032)
Figure 19. Brazil Oat Beta Glucan Revenue (USD Million) By Country (2021-2032)
Figure 20. Argentina Oat Beta Glucan Revenue (USD Million) By Country (2021-2032)
Figure 21. Rest of Asia Pacific Oat Beta Glucan Revenue (USD Million) By Country (2021-2032)
Figure 22. Middle East and Africa Oat Beta Glucan Revenue (USD Million) By Region (2021-2032)
Figure 23. Saudi Arabia Oat Beta Glucan Revenue (USD Million) By Region (2021-2032)
Figure 24. The UAE Oat Beta Glucan Revenue (USD Million) By Region (2021-2032)
Figure 25. Rest of Middle East Oat Beta Glucan Revenue (USD Million) By Region (2021-2032)
Figure 26. South Africa Oat Beta Glucan Revenue (USD Million) By Region (2021-2032)
Figure 27. Africa Oat Beta Glucan Revenue (USD Million) By Region (2021-2032)
Figure 28. North America Oat Beta Glucan Revenue (USD Million) By Type (2021-2032)
Figure 29. North America Oat Beta Glucan Revenue (USD Million) By Application (2021-2032)
Figure 30. North America Oat Beta Glucan Revenue (USD Million) By Product (2021-2032)
Figure 31. Europe Oat Beta Glucan Revenue (USD Million) By Type (2021-2032)
Figure 32. Europe Oat Beta Glucan Revenue (USD Million) By Application (2021-2032)
Figure 33. Europe Oat Beta Glucan Revenue (USD Million) By Product (2021-2032)
Figure 34. Asia Pacific Oat Beta Glucan Revenue (USD Million) By Type (2021-2032)
Figure 35. Asia Pacific Oat Beta Glucan Revenue (USD Million) By Application (2021-2032)
Figure 36. Asia Pacific Oat Beta Glucan Revenue (USD Million) By Product (2021-2032)
Figure 37. South America Oat Beta Glucan Revenue (USD Million) By Type (2021-2032)
Figure 38. South America Oat Beta Glucan Revenue (USD Million) By Application (2021-2032)
Figure 39. South America Oat Beta Glucan Revenue (USD Million) By Product (2021-2032)
Figure 40. Middle East and Africa Oat Beta Glucan Revenue (USD Million) By Type (2021-2032)
Figure 41. Middle East and Africa Oat Beta Glucan Revenue (USD Million) By Application (2021-2032)
Figure 42. Middle East and Africa Oat Beta Glucan Revenue (USD Million) By Product (2021-2032)
By Type
Organic
Conventional
By End-User
Food and Beverage
Pharmaceutical
Nutraceutical
Dietary Supplements
Cosmetic and Personal Care
Animal Nutrition
Countries Analyzed
North America (US, Canada, Mexico)
Europe (Germany, UK, France, Spain, Italy, Russia, Rest of Europe)
Asia Pacific (China, India, Japan, South Korea, Australia, South East Asia, Rest of Asia)
South America (Brazil, Argentina, Rest of South America)
Middle East and Africa (Saudi Arabia, UAE, Rest of Middle East, South Africa, Egypt, Rest of Africa)
