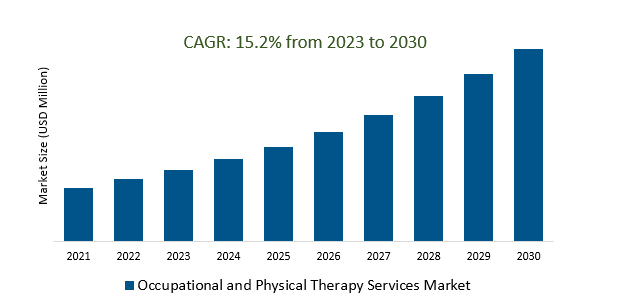
The Global Occupational and Physical Therapy Services Market Size is estimated to register 15.2% growth over the forecast period from 2023 to 2030.
The market growth is driven by an increasing elderly population worldwide is driving demand for occupational and physical therapy services as seniors often require rehabilitation and therapeutic support. Leading Companies focusing on Aging Population, Technological Advancements, Preventive Care, Mental Health Integration, Telehealth and Remote Services, Personalized and Holistic Care, Research and Evidence-Based Practice, Patient-Centric Care, and others to boost market shares in the industry.
Market Overview
The Occupational and Physical Therapy Services Market provides specialized rehabilitation services to individuals recovering from injuries, surgeries, or living with chronic conditions. It caters to diverse patient populations, including children with developmental disorders, adults, and the elderly. Key drivers of market growth include the aging population, increased chronic disease incidence, technological advancements, and a shift toward patient-centric care models. This market is characterized by a global presence, integration with the broader healthcare ecosystem, and ongoing innovation in the form of technology integration and patient-centered approaches.
Market Dynamics
Market Trends- Occupational and physical therapy services can help people improve their fitness and achieve their fitness goals.
Occupational and Physical Therapy Services are essential for aiding individuals in recovering from injuries, and surgeries, and managing chronic conditions. Occupational therapists help patients relearn daily living and work-related skills, while physical therapists focus on improving physical function and mobility. Beyond fitness, these services encompass injury rehabilitation, pain management, ergonomic assessments, and technology integration. The market is growing due to an aging population, rising chronic disease prevalence, and a shift toward patient-centered care and technological advancements in healthcare.
Market Driver- There is a growing demand for occupational and physical therapy services for preventive care.
The Occupational and Physical Therapy Services Market is experiencing heightened demand, particularly for preventive care, as occupational and physical therapists are increasingly sought after to help individuals reduce the risk of injuries and chronic health issues by providing expertise in areas such as ergonomic assessments and promoting healthy lifestyles. This shift towards preventive care aligns with broader healthcare trends, and technological advancements further enhance the relevance of these services in the modern healthcare landscape.
Market Opportunity- Occupational and physical therapists are increasingly using holistic approaches to help patients achieve their wellness and fitness goals.
Occupational and physical therapists are adopting holistic approaches in the Occupational and Physical Therapy Services Market, going beyond injury recovery to address overall wellness and fitness. They consider both physical and mental well-being, guiding patients in setting and achieving personalized wellness goals, and this aligns with the broader healthcare trend toward patient-centric care and a comprehensive approach to healthcare.
Market Share Analysis- Geriatric Therapy Occupational and Physical Therapy Services Market will register the fastest growth
The Global Occupational and Physical Therapy Services Market is analyzed across Orthopedic Therapy, General Therapy, Geriatric Therapy, and others. Geriatric Therapy is poised to register the fastest growth. The Geriatric Therapy Occupational and Physical Therapy Services Market addresses the specific healthcare needs of the elderly population, focusing on improving their well-being, mobility, and quality of life. As the global aging population grows, there's an increasing demand for these services to assist seniors in maintaining their independence, managing chronic conditions, and recovering from age-related health issues. Occupational and physical therapists play key roles in this field, with technology and telehealth integration making these services more accessible. This market is essential for promoting the health and well-being of the elderly, who represent a significant and expanding demographic globally.
Market Share Analysis- Outpatient Clinics held a significant market share in 2023
The Global Occupational and Physical Therapy Services Market is analyzed across various settings including Hospitals, Outpatient Clinics, and others. Of these, Outpatient Clinics held a significant market share in 2023. The Outpatient Clinics Occupational and Physical Therapy Services Market encompasses therapy services provided in outpatient clinic settings, offering convenient, non-emergency care to patients seeking rehabilitation and therapeutic support. It caters to a diverse patient base, including those recovering from injuries, surgeries, and chronic conditions. This market emphasizes accessibility, flexibility, and technology integration to meet evolving healthcare needs, aligning with the growing trend toward outpatient care and non-institutional healthcare settings, making it a hub for ongoing growth and innovation in rehabilitation service delivery.
Occupational and Physical Therapy Services Market Segmentation
By Application
- Orthopedic Therapy
- General Therapy
- Geriatric Therapy
- Others
By Settings
- Hospitals
- Outpatient Clinics
- Others
By Type
- Public Health Insurance
- Private Health Insurance
- Out of Pocket
By Region
- North America (United States, Canada, Mexico)
- Europe (Germany, France, United Kingdom, Spain, Italy, Others)
- Asia Pacific (China, India, Japan, South Korea, Australia, Others)
- Latin America (Brazil, Argentina, Others)
- Middle East and Africa (Saudi Arabia, UAE, Kuwait, Other Middle East, South Africa, Nigeria, Other Africa)
Occupational and Physical Therapy Services Market Companies
- ATI Holdings LLC
- Select Medical Corporation
- Bologna Isokinetic Srl
- Upstream Rehabilitation Inc
- Concentra Inc
- Athletico Physical Therapy
- Encompass Health Corporation
- Knight Health Holdings, LLC
- CORA Health Services Inc
- MED-1 Occupational Health Services
- United States Physical Therapy Inc
- PT SOLUTIONS
*List not exhaustive
Occupational and Physical Therapy Services Market Outlook 2023
1 Market Overview
1.1 Introduction to the Occupational and Physical Therapy Services Market
1.2 Scope of the Study
1.3 Research Objective
1.3.1 Key Market Scope and Segments
1.3.2 Players Covered
1.3.3 Years Considered
2 Executive Summary
2.1 2023 Occupational and Physical Therapy Services Industry- Market Statistics
3 Market Dynamics
3.1 Market Drivers
3.2 Market Challenges
3.3 Market Opportunities
3.4 Market Trends
4 Market Factor Analysis
4.1 Porter’s Five Forces
4.2 Market Entropy
4.2.1 Global Occupational and Physical Therapy Services Market Companies with Area Served
4.2.2 Products Offerings Global Occupational and Physical Therapy Services Market
5 COVID-19 Impact Analysis and Outlook Scenarios
5.1.1 Covid-19 Impact Analysis
5.1.2 post-COVID-19 Scenario- Low Growth Case
5.1.3 post-COVID-19 Scenario- Reference Growth Case
5.1.4 post-COVID-19 Scenario- Low Growth Case
6 Global Occupational and Physical Therapy Services Market Trends
6.1 Global Occupational and Physical Therapy Services Revenue (USD Million) and CAGR (%) by Type (2018-2030)
6.2 Global Occupational and Physical Therapy Services Revenue (USD Million) and CAGR (%) by Applications (2018-2030)
6.3 Global Occupational and Physical Therapy Services Revenue (USD Million) and CAGR (%) by regions (2018-2030)
7 Global Occupational and Physical Therapy Services Market Revenue (USD Million) by Type, and Applications (2018-2022)
7.1 Global Occupational and Physical Therapy Services Revenue (USD Million) by Type (2018-2022)
7.1.1 Global Occupational and Physical Therapy Services Revenue (USD Million), Market Share (%) by Type (2018-2022)
7.2 Global Occupational and Physical Therapy Services Revenue (USD Million) by Applications (2018-2022)
7.2.1 Global Occupational and Physical Therapy Services Revenue (USD Million), Market Share (%) by Applications (2018-2022)
8 Global Occupational and Physical Therapy Services Development Regional Status and Outlook
8.1 Global Occupational and Physical Therapy Services Revenue (USD Million) By Regions (2018-2022)
8.2 North America Occupational and Physical Therapy Services Revenue (USD Million) by Type, and Application (2018-2022)
8.2.1 North America Occupational and Physical Therapy Services Revenue (USD Million) by Country (2018-2022)
8.2.2 North America Occupational and Physical Therapy Services Revenue (USD Million) by Type (2018-2022)
8.2.3 North America Occupational and Physical Therapy Services Revenue (USD Million) by Applications (2018-2022)
8.3 Europe Occupational and Physical Therapy Services Revenue (USD Million), by Type, and Applications (USD Million) (2018-2022)
8.3.1 Europe Occupational and Physical Therapy Services Revenue (USD Million), by Country (2018-2022)
8.3.2 Europe Occupational and Physical Therapy Services Revenue (USD Million) by Type (2018-2022)
8.3.3 Europe Occupational and Physical Therapy Services Revenue (USD Million) by Applications (2018-2022)
8.4 Asia Pacific Occupational and Physical Therapy Services Revenue (USD Million), and Revenue (USD Million) by Type, and Applications (2018-2022)
8.4.1 Asia Pacific Occupational and Physical Therapy Services Revenue (USD Million) by Country (2018-2022)
8.4.2 Asia Pacific Occupational and Physical Therapy Services Revenue (USD Million) by Type (2018-2022)
8.4.3 Asia Pacific Occupational and Physical Therapy Services Revenue (USD Million) by Applications (2018-2022)
8.5 South America Occupational and Physical Therapy Services Revenue (USD Million), by Type, and Applications (2018-2022)
8.5.1 South America Occupational and Physical Therapy Services Revenue (USD Million), by Country (2018-2022)
8.5.2 South America Occupational and Physical Therapy Services Revenue (USD Million) by Type (2018-2022)
8.5.3 South America Occupational and Physical Therapy Services Revenue (USD Million) by Applications (2018-2022)
8.6 Middle East and Africa Occupational and Physical Therapy Services Revenue (USD Million), by Type, Technology, Application, Thickness (2018-2022)
8.6.1 Middle East and Africa Occupational and Physical Therapy Services Revenue (USD Million) by Country (2018-2022)
8.6.2 Middle East and Africa Occupational and Physical Therapy Services Revenue (USD Million) by Type (2018-2022)
8.6.3 Middle East and Africa Occupational and Physical Therapy Services Revenue (USD Million) by Applications (2018-2022)
9 Company Profiles
10 Global Occupational and Physical Therapy Services Market Revenue (USD Million), by Type, and Applications (2023-2030)
10.1 Global Occupational and Physical Therapy Services Revenue (USD Million) and Market Share (%) by Type (2023-2030)
10.1.1 Global Occupational and Physical Therapy Services Revenue (USD Million), and Market Share (%) by Type (2023-2030)
10.2 Global Occupational and Physical Therapy Services Revenue (USD Million) and Market Share (%) by Applications (2023-2030)
10.2.1 Global Occupational and Physical Therapy Services Revenue (USD Million), and Market Share (%) by Applications (2023-2030)
11 Global Occupational and Physical Therapy Services Development Regional Status and Outlook Forecast
11.1 Global Occupational and Physical Therapy Services Revenue (USD Million) By Regions (2023-2030)
11.2 North America Occupational and Physical Therapy Services Revenue (USD Million) by Type, and Applications (2023-2030)
11.2.1 North America Occupational and Physical Therapy Services Revenue (USD) Million by Country (2023-2030)
11.2.2 North America Occupational and Physical Therapy Services Revenue (USD Million), by Type (2023-2030)
11.2.3 North America Occupational and Physical Therapy Services Revenue (USD Million), Market Share (%) by Applications (2023-2030)
11.3 Europe Occupational and Physical Therapy Services Revenue (USD Million), by Type, and Applications (2023-2030)
11.3.1 Europe Occupational and Physical Therapy Services Revenue (USD Million), by Country (2023-2030)
11.3.2 Europe Occupational and Physical Therapy Services Revenue (USD Million), by Type (2023-2030)
11.3.3 Europe Occupational and Physical Therapy Services Revenue (USD Million), by Applications (2023-2030)
11.4 Asia Pacific Occupational and Physical Therapy Services Revenue (USD Million) by Type, and Applications (2023-2030)
11.4.1 Asia Pacific Occupational and Physical Therapy Services Revenue (USD Million), by Country (2023-2030)
11.4.2 Asia Pacific Occupational and Physical Therapy Services Revenue (USD Million), by Type (2023-2030)
11.4.3 Asia Pacific Occupational and Physical Therapy Services Revenue (USD Million), by Applications (2023-2030)
11.5 South America Occupational and Physical Therapy Services Revenue (USD Million), by Type, and Applications (2023-2030)
11.5.1 South America Occupational and Physical Therapy Services Revenue (USD Million), by Country (2023-2030)
11.5.2 South America Occupational and Physical Therapy Services Revenue (USD Million), by Type (2023-2030)
11.5.3 South America Occupational and Physical Therapy Services Revenue (USD Million), by Applications (2023-2030)
11.6 Middle East and Africa Occupational and Physical Therapy Services Revenue (USD Million), by Type, and Applications (2023-2030)
11.6.1 Middle East and Africa Occupational and Physical Therapy Services Revenue (USD Million), by region (2023-2030)
11.6.2 Middle East and Africa Occupational and Physical Therapy Services Revenue (USD Million), by Type (2023-2030)
11.6.3 Middle East and Africa Occupational and Physical Therapy Services Revenue (USD Million), by Applications (2023-2030)
12 Methodology and Data Sources
12.1 Methodology/Research Approach
12.1.1 Research Programs/Design
12.1.2 Market Size Estimation
12.1.3 Market Breakdown and Data Triangulation
12.2 Data Sources
12.2.1 Secondary Sources
12.2.2 Primary Sources
12.3 Disclaimer
List of Tables
Table 1 Market Segmentation Analysis
Table 2 Global Occupational and Physical Therapy Services Market Companies with Areas Served
Table 3 Products Offerings Global Occupational and Physical Therapy Services Market
Table 4 Low Growth Scenario Forecasts
Table 5 Reference Case Growth Scenario
Table 6 High Growth Case Scenario
Table 7 Global Occupational and Physical Therapy Services Revenue (USD Million) And CAGR (%) By Type (2018-2030)
Table 8 Global Occupational and Physical Therapy Services Revenue (USD Million) And CAGR (%) By Applications (2018-2030)
Table 9 Global Occupational and Physical Therapy Services Revenue (USD Million) And CAGR (%) By Regions (2018-2030)
Table 10 Global Occupational and Physical Therapy Services Revenue (USD Million) By Type (2018-2022)
Table 11 Global Occupational and Physical Therapy Services Revenue Market Share (%) By Type (2018-2022)
Table 12 Global Occupational and Physical Therapy Services Revenue (USD Million) By Applications (2018-2022)
Table 13 Global Occupational and Physical Therapy Services Revenue Market Share (%) By Applications (2018-2022)
Table 14 Global Occupational and Physical Therapy Services Market Revenue (USD Million) By Regions (2018-2022)
Table 15 Global Occupational and Physical Therapy Services Market Share (%) By Regions (2018-2022)
Table 16 North America Occupational and Physical Therapy Services Revenue (USD Million) By Country (2018-2022)
Table 17 North America Occupational and Physical Therapy Services Revenue (USD Million) By Type (2018-2022)
Table 18 North America Occupational and Physical Therapy Services Revenue (USD Million) By Applications (2018-2022)
Table 19 Europe Occupational and Physical Therapy Services Revenue (USD Million) By Country (2018-2022)
Table 20 Europe Occupational and Physical Therapy Services Revenue (USD Million) By Type (2018-2022)
Table 21 Europe Occupational and Physical Therapy Services Revenue (USD Million) By Applications (2018-2022)
Table 22 Asia Pacific Occupational and Physical Therapy Services Revenue (USD Million) By Country (2018-2022)
Table 23 Asia Pacific Occupational and Physical Therapy Services Revenue (USD Million) By Type (2018-2022)
Table 24 Asia Pacific Occupational and Physical Therapy Services Revenue (USD Million) By Applications (2018-2022)
Table 25 South America Occupational and Physical Therapy Services Revenue (USD Million) By Country (2018-2022)
Table 26 South America Occupational and Physical Therapy Services Revenue (USD Million) By Type (2018-2022)
Table 27 South America Occupational and Physical Therapy Services Revenue (USD Million) By Applications (2018-2022)
Table 28 Middle East and Africa Occupational and Physical Therapy Services Revenue (USD Million) By Region (2018-2022)
Table 29 Middle East and Africa Occupational and Physical Therapy Services Revenue (USD Million) By Type (2018-2022)
Table 30 Middle East and Africa Occupational and Physical Therapy Services Revenue (USD Million) By Applications (2018-2022)
Table 31 Financial Analysis
Table 32 Global Occupational and Physical Therapy Services Revenue (USD Million) By Type (2023-2030)
Table 33 Global Occupational and Physical Therapy Services Revenue Market Share (%) By Type (2023-2030)
Table 34 Global Occupational and Physical Therapy Services Revenue (USD Million) By Applications (2023-2030)
Table 35 Global Occupational and Physical Therapy Services Revenue Market Share (%) By Applications (2023-2030)
Table 36 Global Occupational and Physical Therapy Services Market Revenue (USD Million), And Revenue (USD Million) By Regions (2023-2030)
Table 37 North America Occupational and Physical Therapy Services Revenue (USD)By Country (2023-2030)
Table 38 North America Occupational and Physical Therapy Services Revenue (USD Million) By Type (2023-2030)
Table 39 North America Occupational and Physical Therapy Services Revenue (USD Million) By Applications (2023-2030)
Table 40 Europe Occupational and Physical Therapy Services Revenue (USD Million) By Country (2023-2030)
Table 41 Europe Occupational and Physical Therapy Services Revenue (USD Million) By Type (2023-2030)
Table 42 Europe Occupational and Physical Therapy Services Revenue (USD Million) By Applications (2023-2030)
Table 43 Asia Pacific Occupational and Physical Therapy Services Revenue (USD Million) By Country (2023-2030)
Table 44 Asia Pacific Occupational and Physical Therapy Services Revenue (USD Million) By Type (2023-2030)
Table 45 Asia Pacific Occupational and Physical Therapy Services Revenue (USD Million) By Applications (2023-2030)
Table 46 South America Occupational and Physical Therapy Services Revenue (USD Million) By Country (2023-2030)
Table 47 South America Occupational and Physical Therapy Services Revenue (USD Million) By Type (2023-2030)
Table 48 South America Occupational and Physical Therapy Services Revenue (USD Million) By Applications (2023-2030)
Table 49 Middle East and Africa Occupational and Physical Therapy Services Revenue (USD Million) By Region (2023-2030)
Table 50 Middle East and Africa Occupational and Physical Therapy Services Revenue (USD Million) By Region (2023-2030)
Table 51 Middle East and Africa Occupational and Physical Therapy Services Revenue (USD Million) By Type (2023-2030)
Table 52 Middle East and Africa Occupational and Physical Therapy Services Revenue (USD Million) By Applications (2023-2030)
Table 53 Research Programs/Design for This Report
Table 54 Key Data Information from Secondary Sources
Table 55 Key Data Information from Primary Sources
List of Figures
Figure 1 Market Scope
Figure 2 Porter’s Five Forces
Figure 3 Global Occupational and Physical Therapy Services Revenue (USD Million) By Type (2018-2022)
Figure 4 Global Occupational and Physical Therapy Services Revenue Market Share (%) By Type (2022)
Figure 5 Global Occupational and Physical Therapy Services Revenue (USD Million) By Applications (2018-2022)
Figure 6 Global Occupational and Physical Therapy Services Revenue Market Share (%) By Applications (2022)
Figure 7 Global Occupational and Physical Therapy Services Market Revenue (USD Million) By Regions (2018-2022)
Figure 8 Global Occupational and Physical Therapy Services Market Share (%) By Regions (2022)
Figure 9 North America Occupational and Physical Therapy Services Revenue (USD Million) By Country (2018-2022)
Figure 10 North America Occupational and Physical Therapy Services Revenue (USD Million) By Type (2018-2022)
Figure 11 North America Occupational and Physical Therapy Services Revenue (USD Million) By Applications (2018-2022)
Figure 12 Europe Occupational and Physical Therapy Services Revenue (USD Million) By Country (2018-2022)
Figure 13 Europe Occupational and Physical Therapy Services Revenue (USD Million) By Type (2018-2022)
Figure 14 Europe Occupational and Physical Therapy Services Revenue (USD Million) By Applications (2018-2022)
Figure 15 Asia Pacific Occupational and Physical Therapy Services Revenue (USD Million) By Country (2018-2022)
Figure 16 Asia Pacific Occupational and Physical Therapy Services Revenue (USD Million) By Type (2018-2022)
Figure 17 Asia Pacific Occupational and Physical Therapy Services Revenue (USD Million) By Applications (2018-2022)
Figure 18 South America Occupational and Physical Therapy Services Revenue (USD Million) By Country (2018-2022)
Figure 19 South America Occupational and Physical Therapy Services Revenue (USD Million) By Type (2018-2022)
Figure 20 South America Occupational and Physical Therapy Services Revenue (USD Million) By Applications (2018-2022)
Figure 21 Middle East and Africa Occupational and Physical Therapy Services Revenue (USD Million) By Region (2018-2022)
Figure 22 Middle East and Africa Occupational and Physical Therapy Services Revenue (USD Million) By Type (2018-2022)
Figure 23 Middle East and Africa Occupational and Physical Therapy Services Revenue (USD Million) By Applications (2018-2022)
Figure 24 Global Occupational and Physical Therapy Services Revenue (USD Million) By Type (2023-2030)
Figure 25 Global Occupational and Physical Therapy Services Revenue Market Share (%) By Type (2030)
Figure 26 Global Occupational and Physical Therapy Services Revenue (USD Million) By Applications (2023-2030)
Figure 27 Global Occupational and Physical Therapy Services Revenue Market Share (%) By Applications (2030)
Figure 28 Global Occupational and Physical Therapy Services Market Revenue (USD Million) By Regions (2023-2030)
Figure 29 North America Occupational and Physical Therapy Services Revenue (USD Million) By Country (2023-2030)
Figure 30 North America Occupational and Physical Therapy Services Revenue (USD Million) By Type (2023-2030)
Figure 31 North America Occupational and Physical Therapy Services Revenue (USD Million) By Applications (2023-2030)
Figure 32 Europe Occupational and Physical Therapy Services Revenue (USD Million) By Country (2023-2030)
Figure 33 Europe Occupational and Physical Therapy Services Revenue (USD Million) By Type (2023-2030)
Figure 34 Europe Occupational and Physical Therapy Services Revenue (USD Million) By Applications (2023-2030)
Figure 35 Asia Pacific Occupational and Physical Therapy Services Revenue (USD Million) By Country (2023-2030)
Figure 36 Asia Pacific Occupational and Physical Therapy Services Revenue (USD Million) By Type (2023-2030)
Figure 37 Asia Pacific Occupational and Physical Therapy Services Revenue (USD Million) By Applications (2023-2030)
Figure 38 South America Occupational and Physical Therapy Services Revenue (USD Million) By Country (2023-2030)
Figure 39 South America Occupational and Physical Therapy Services Revenue (USD Million) By Type (2023-2030)
Figure 40 South America Occupational and Physical Therapy Services Revenue (USD Million) By Applications (2023-2030)
Figure 41 Middle East and Africa Occupational and Physical Therapy Services Revenue (USD Million) By Region (2023-2030)
Figure 42 Middle East and Africa Occupational and Physical Therapy Services Revenue (USD Million) By Region (2023-2030)
Figure 43 Middle East and Africa Occupational and Physical Therapy Services Revenue (USD Million) By Type (2023-2030)
Figure 44 Middle East and Africa Occupational and Physical Therapy Services Revenue (USD Million) By Applications (2023-2030)
Figure 45 Bottom-Up and Top-Down Approaches for This Report
Figure 46 Data Triangulation
