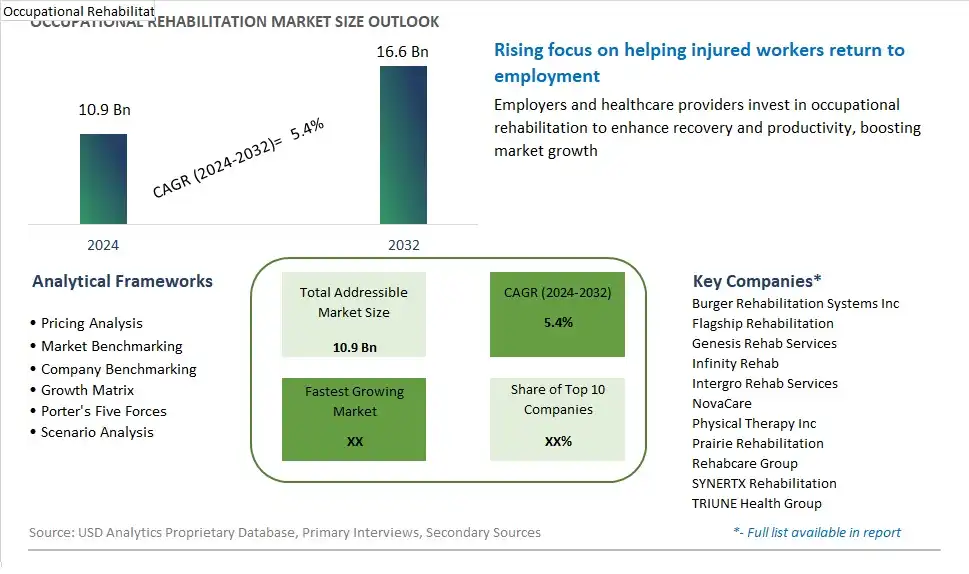
Global Occupational Rehabilitation Market Size is valued at $10.9 Billion in 2024 and is forecast to register a growth rate (CAGR) of 5.4% to reach $16.6 Billion by 2032.
The global Occupational Rehabilitation Market Comprehensive Study analyzes and forecasts the market size across 6 regions and 24 countries for diverse segments -By Type (Inpatient Care, Outpatient Care, Home Healthcare), By Application (Hospitals, Nursing Facilities, Schools, Home Health, Others)
An Introduction to Occupational Rehabilitation Market
In 2024, the occupational rehabilitation market is expanding as employers and healthcare providers recognize the importance of supporting injured or disabled individuals in returning to work and achieving optimal functioning and independence. Occupational rehabilitation encompasses a range of services and interventions aimed at helping individuals overcome physical, cognitive, or psychosocial barriers to employment and participation in daily activities. This may include physical therapy, occupational therapy, vocational counseling, job coaching, assistive technology, and workplace accommodations tailored to the individual's needs and goals. With an aging workforce, rising rates of chronic illness and injury, and increasing awareness of the social and economic benefits of inclusive workplaces, there is a growing demand for occupational rehabilitation programs that promote early intervention, functional recovery, and sustainable return-to-work outcomes. Employers are investing in proactive strategies to prevent workplace injuries, promote employee health and well-being, and facilitate smooth transitions for employees returning from illness or injury. Moreover, advancements in technology, telehealth, and remote rehabilitation services are expanding access to occupational rehabilitation programs, enabling individuals to receive timely and personalized care regardless of their location or physical limitations. As the field of occupational rehabilitation continues to evolve, expect to see further integration of evidence-based practices, interdisciplinary collaboration, and outcomes measurement to optimize functional outcomes, enhance workplace productivity, and promote social inclusion for individuals with disabilities or health conditions.
Occupational Rehabilitation Competitive Landscape
The market report analyses the leading companies in the industry including Burger Rehabilitation Systems Inc, Flagship Rehabilitation, Genesis Rehab Services, Infinity Rehab, Intergro Rehab Services, NovaCare, Physical Therapy Inc, Prairie Rehabilitation, Rehabcare Group, SYNERTX Rehabilitation, TRIUNE Health Group, and Others.
Occupational Rehabilitation Market Dynamics
Occupational Rehabilitation Market Trend: Emphasis on Workplace Health and Safety
A significant trend in the occupational rehabilitation market is the increasing emphasis on workplace health and safety by employers and regulatory bodies. With a growing awareness of the importance of maintaining employee well-being and productivity, organizations are investing in occupational rehabilitation programs to prevent work-related injuries and illnesses, as well as to support the recovery and return to work of injured or disabled employees. This trend is driven by stringent regulations governing workplace safety, the rising costs associated with workplace injuries and absenteeism, and a growing recognition of the benefits of early intervention and rehabilitation in minimizing the impact of injuries on both employees and employers. As a result, there's a growing demand for occupational rehabilitation services that focus on injury prevention, early intervention, and effective rehabilitation strategies to promote employee health and productivity.
Market Driver: Legal and Regulatory Compliance Requirements
A key driver for the occupational rehabilitation market is legal and regulatory compliance requirements that mandate employers to provide rehabilitation services and support to injured or disabled employees. In many countries, there are laws and regulations in place that require employers to implement occupational rehabilitation programs as part of their duty of care towards employees' health and safety. This driver is reinforced by the need for employers to mitigate the risk of legal liabilities, workers' compensation claims, and penalties associated with non-compliance with occupational health and safety regulations. Additionally, there's a growing recognition of the ethical and moral responsibilities of employers to support injured or disabled employees in their recovery and return to work journey, driving demand for comprehensive and effective occupational rehabilitation services.
Market Opportunity: Integration of Technology and Digital Solutions
An opportunity for the occupational rehabilitation market lies in the integration of technology and digital solutions to enhance the delivery and effectiveness of rehabilitation programs. Companies can capitalize on this opportunity by leveraging telehealth platforms, wearable devices, mobile apps, and virtual reality technology to deliver remote rehabilitation services, monitor patient progress, and provide personalized support to injured or disabled individuals. Moreover, there's potential to use data analytics and artificial intelligence algorithms to analyze patient data, identify trends, and optimize rehabilitation outcomes. By embracing technology-enabled solutions, occupational rehabilitation providers can overcome barriers such as geographical constraints, improve access to care, and enhance the efficiency and effectiveness of rehabilitation interventions. Additionally, there's an opportunity to develop innovative tools and resources for workplace ergonomics assessment, injury prevention training, and vocational rehabilitation planning to support employers in creating safer and healthier work environments. By embracing digital transformation, companies can differentiate their offerings, expand their reach, and drive growth in the occupational rehabilitation market.
Occupational Rehabilitation Market Share Analysis: Outpatient Care held the dominant market share in 2024
Within the occupational rehabilitation market, outpatient care is the largest segment, driven by several key factors. Outpatient care offers a flexible and cost-effective alternative to inpatient treatment, allowing individuals to receive rehabilitation services while maintaining their daily routines and responsibilities. This accessibility makes outpatient care particularly appealing to patients seeking rehabilitation for work-related injuries or disabilities, as it enables them to undergo therapy sessions without disrupting their employment or lifestyle. Additionally, advancements in medical technology and therapeutic techniques have expanded the scope of outpatient rehabilitation services, catering to a wide range of occupational injuries and conditions. The growing emphasis on early intervention and preventive care further supports the popularity of outpatient rehabilitation, as it allows for timely treatment and rehabilitation to minimize the impact of injuries on individuals' ability to perform their job duties effectively. As healthcare systems continue to prioritize patient-centered care and cost containment, the outpatient care segment is poised to maintain its dominance in the occupational rehabilitation market, offering comprehensive and convenient solutions to individuals seeking to regain functional independence and return to work safely.
Occupational Rehabilitation Market Share Analysis: Home Health market is poised to register the fastest growth rae over the forecast period to 2032
Within the occupational rehabilitation market segmented by application, home health is the fastest-growing segment, driven by several compelling factors. The increasing preference for personalized and patient-centric care, coupled with advancements in telemedicine and remote monitoring technologies, has facilitated the expansion of occupational rehabilitation services into patients' homes. Home health services offer convenience, flexibility, and comfort, allowing individuals recovering from work-related injuries or disabilities to receive comprehensive rehabilitation therapy in familiar surroundings. This approach not only promotes better patient compliance and engagement but also reduces the burden on healthcare facilities and enhances the overall efficiency of rehabilitation programs. Further, the COVID-19 pandemic has accelerated the adoption of home-based rehabilitation solutions, as it offers a safe and socially distanced alternative to in-person care, particularly for vulnerable populations or those with limited mobility. As healthcare systems continue to embrace telehealth and home-based care models, the home health segment is poised to experience robust growth, driving innovation and transformation in the occupational rehabilitation landscape.
Occupational Rehabilitation Market Segmentation
By Type
Inpatient Care
Outpatient Care
Home Healthcare
By Application
Hospitals
Nursing Facilities
Schools
Home Health
Others
Countries Analyzed
North America (US, Canada, Mexico)
Europe (Germany, UK, France, Spain, Italy, Russia, Rest of Europe)
Asia Pacific (China, India, Japan, South Korea, Australia, South East Asia, Rest of Asia)
South America (Brazil, Argentina, Rest of South America)
Middle East and Africa (Saudi Arabia, UAE, Rest of Middle East, South Africa, Egypt, Rest of Africa)
Occupational Rehabilitation Companies Profiled in the Study
Burger Rehabilitation Systems Inc
Flagship Rehabilitation
Genesis Rehab Services
Infinity Rehab
Intergro Rehab Services
NovaCare
Physical Therapy Inc
Prairie Rehabilitation
Rehabcare Group
SYNERTX Rehabilitation
TRIUNE Health Group
*- List Not Exhaustive
Chapter 1. TABLE OF CONTENTS
Chapter 2. Introduction to Occupational Rehabilitation Market
2.1. Market Overview
2.2. Key Statistics and Report Highlights
2.3. Scope of the Comprehensive Study
2.3.1. Market Definition
2.3.2 Countries and Regions Covered
2.3.3 Research Objective
2.3.4 Units, Currency, and Conversions
2.3.5 Industry Value Chain
2.4. Key Market Segments
2.5. Key Companies
2.6. Study Period
Chapter 3. Strategic Analysis Review
3.1. Occupational Rehabilitation Pricing Analysis and Forecast
3.2. Porter’s Five Forces
3.3. Market Ecosystem
3.4. SWOT Analysis
3.5. Regulatory Scenario
3.3. Effects of Inflation, Russia-Ukraine War, moderating economic growth, and other macroeconomic factors
Chapter 4. Competitive Landscape
4.1. Market Share Analysis
4.1.1. Global Occupational Rehabilitation Market Share by Company, 2023
4.1.2. Product Offerings of Leading Occupational Rehabilitation Companies
4.2. Market Entropy
4.2.1. New Product Launches in the Industry
4.2.2. Mergers, Acquisitions, Joint ventures, and Partnerships
4.3. Key Strategies and Best Practices
Chapter 5. Global Market Projections: Best, Reference, and Low Case Scenarios
5.1. Growth Analysis- Case Scenario Definitions
5.2. Low Growth Case Scenario Forecasts
5.3. Reference Growth Case Scenario Forecasts
5.4. High Growth Case Scenario Forecasts
Chapter 6. Market Dynamics
6.1. Occupational Rehabilitation Market Drivers
6.2. Occupational Rehabilitation Market Challenges
6.6. Occupational Rehabilitation Market Opportunities
6.4. Occupational Rehabilitation Market Trends
Chapter 7. Global Occupational Rehabilitation Market Outlook Trends
7.1. Global Occupational Rehabilitation Revenue (USD Million) and CAGR (%) by Type (2021-2032)
7.2. Global Occupational Rehabilitation Revenue (USD Million) and CAGR (%) by Application (2021-2032)
7.3. Global Occupational Rehabilitation Revenue (USD Million) and CAGR (%) by Product (2021-2032)
By Type
Inpatient Care
Outpatient Care
Home Healthcare
By Application
Hospitals
Nursing Facilities
Schools
Home Health
Others
Chapter 8. Global Occupational Rehabilitation Regional Analysis and Outlook
8.1. Global Occupational Rehabilitation Revenue (USD Million) By Regions (2021- 2032)
8.2. North America Occupational Rehabilitation Revenue (USD Million) by Country (2021-2032)
8.2.1. United States Occupational Rehabilitation Regional Analysis and Outlook
8.2.2. Canada Occupational Rehabilitation Regional Analysis and Outlook
8.2.3. Mexico Occupational Rehabilitation Regional Analysis and Outlook
8.3. Europe Occupational Rehabilitation Revenue (USD Million), by Country (2021-2032)
8.3.1. Germany Occupational Rehabilitation Regional Analysis and Outlook
8.3.2. France Occupational Rehabilitation Regional Analysis and Outlook
8.3.3. United Kingdom Occupational Rehabilitation Regional Analysis and Outlook
8.3.4. Spain Occupational Rehabilitation Regional Analysis and Outlook
8.3.5. Italy Occupational Rehabilitation Regional Analysis and Outlook
8.3.6. Russia Occupational Rehabilitation Regional Analysis and Outlook
8.3.7. Rest of Europe Occupational Rehabilitation Regional Analysis and Outlook
8.4. Asia Pacific Occupational Rehabilitation Revenue (USD Million) by Country (2021-2032)
8.4.1. China Occupational Rehabilitation Regional Analysis and Outlook
8.4.2. Japan Occupational Rehabilitation Regional Analysis and Outlook
8.4.3. India Occupational Rehabilitation Regional Analysis and Outlook
8.4.4. South Korea Occupational Rehabilitation Regional Analysis and Outlook
8.4.5. Australia Occupational Rehabilitation Regional Analysis and Outlook
8.4.6. South East Asia Occupational Rehabilitation Regional Analysis and Outlook
8.4.7. Rest of Asia Pacific Occupational Rehabilitation Regional Analysis and Outlook
8.5. South America Occupational Rehabilitation Revenue (USD Million), by Country (2021-2032)
8.5.1. Brazil Occupational Rehabilitation Regional Analysis and Outlook
8.5.2. Argentina Occupational Rehabilitation Regional Analysis and Outlook
8.5.3. Rest of South America Occupational Rehabilitation Regional Analysis and Outlook
8.6. Middle East and Africa Occupational Rehabilitation Revenue (USD Million) by Country (2021-2032)
8.6.1. Middle East Occupational Rehabilitation Regional Analysis and Outlook
8.6.2. Africa Occupational Rehabilitation Regional Analysis and Outlook
Chapter 9. North America Occupational Rehabilitation Analysis and Outlook
9.1. North America Occupational Rehabilitation Revenue (USD Million) by Segments (2021-2032)
9.1.1. North America Occupational Rehabilitation Revenue (USD Million) by Type (2021-2032)
9.1.2. North America Occupational Rehabilitation Revenue (USD Million) by Application (2021-2032)
9.1.3. North America Occupational Rehabilitation Revenue (USD Million) by Product (2021-2032)
By Type
Inpatient Care
Outpatient Care
Home Healthcare
By Application
Hospitals
Nursing Facilities
Schools
Home Health
Others
Chapter 10. Europe Occupational Rehabilitation Analysis and Outlook
10.1. Europe Occupational Rehabilitation Revenue (USD Million), by Segments (USD Million) (2021-2032)
10.1.1. Europe Occupational Rehabilitation Revenue (USD Million) by Type (2021-2032)
10.1.2. Europe Occupational Rehabilitation Revenue (USD Million) by Application (2021-2032)
10.1.3. Europe Occupational Rehabilitation Revenue (USD Million) by Product (2021-2032)
By Type
Inpatient Care
Outpatient Care
Home Healthcare
By Application
Hospitals
Nursing Facilities
Schools
Home Health
Others
Chapter 11. Asia Pacific Occupational Rehabilitation Analysis and Outlook
11.1. Asia Pacific Occupational Rehabilitation Revenue (USD Million), and Revenue (USD Million) by Segments (2021-2032)
11.1.1. Asia Pacific Occupational Rehabilitation Revenue (USD Million) by Type (2021-2032)
11.1.2. Asia Pacific Occupational Rehabilitation Revenue (USD Million) by Application (2021-2032)
11.1.3. Asia Pacific Occupational Rehabilitation Revenue (USD Million) by Product (2021-2032)
By Type
Inpatient Care
Outpatient Care
Home Healthcare
By Application
Hospitals
Nursing Facilities
Schools
Home Health
Others
Chapter 12. South America Occupational Rehabilitation Analysis and Outlook
12.1. South America Occupational Rehabilitation Revenue (USD Million), by Segments (2021-2032)
12.1.1. South America Occupational Rehabilitation Revenue (USD Million) by Type (2021-2032)
12.1.2. South America Occupational Rehabilitation Revenue (USD Million) by Application (2021-2032)
12.1.3. South America Occupational Rehabilitation Revenue (USD Million) by Product (2021-2032)
By Type
Inpatient Care
Outpatient Care
Home Healthcare
By Application
Hospitals
Nursing Facilities
Schools
Home Health
Others
Chapter 13. Middle East and Africa Occupational Rehabilitation Analysis and Outlook
13.1. Middle East and Africa Occupational Rehabilitation Revenue (USD Million), by Segments (2021-2032)
13.1.1. Middle East and Africa Occupational Rehabilitation Revenue (USD Million) by Type (2021-2032)
13.1.2. Middle East and Africa Occupational Rehabilitation Revenue (USD Million) by Application (2021-2032)
13.1.3. Middle East and Africa Occupational Rehabilitation Revenue (USD Million) by Product (2021-2032)
By Type
Inpatient Care
Outpatient Care
Home Healthcare
By Application
Hospitals
Nursing Facilities
Schools
Home Health
Others
Chapter 14. Occupational Rehabilitation Company Profiles
14.1 Business Overview
14.2 Product Profiles
14.3 SWOT Profiles
14.5 Recent Developments
14.6 Financial Profile
List of Companies
Burger Rehabilitation Systems Inc
Flagship Rehabilitation
Genesis Rehab Services
Infinity Rehab
Intergro Rehab Services
NovaCare
Physical Therapy Inc
Prairie Rehabilitation
Rehabcare Group
SYNERTX Rehabilitation
TRIUNE Health Group
15. Methodology and Data Sources
15.1 Customization Offerings
15.2 Subscription Services
15.3 Related Reports
15.4 Publisher Expertise
LIST OF TABLES
Table 1 Market Segmentation Analysis
Table 2 Global Occupational Rehabilitation Market Share of Leading Companies, 2023
Table 3 Product Offerings of Leading Companies
Table 4 Low Growth Scenario Forecasts
Table 5 Reference Case Growth Scenario
Table 6 High Growth Case Scenario
Table 7 Global Occupational Rehabilitation Revenue (USD Million) And CAGR (%) By Type (2021-2032)
Table 8 Global Occupational Rehabilitation Revenue (USD Million) And CAGR (%) By Application (2021-2032)
Table 9 Global Occupational Rehabilitation Revenue (USD Million) And CAGR (%) By Product (2021-2032)
Table 10 Global Occupational Rehabilitation Market Revenue (USD Million) By Regions (2021-2032)
Table 11 Global Occupational Rehabilitation Market Share (%) By Regions (2021-2032)
Table 12 North America Occupational Rehabilitation Revenue (USD Million) By Country (2021-2032)
Table 13 Europe Occupational Rehabilitation Revenue (USD Million) By Country (2021-2032)
Table 14 Asia Pacific Occupational Rehabilitation Revenue (USD Million) By Country (2021-2032)
Table 15 South America Occupational Rehabilitation Revenue (USD Million) By Country (2021-2032)
Table 16 Middle East and Africa Occupational Rehabilitation Revenue (USD Million) By Region (2021-2032)
Table 17 North America Occupational Rehabilitation Revenue (USD Million) By Type (2021-2032)
Table 18 North America Occupational Rehabilitation Revenue (USD Million) By Application (2021-2032)
Table 19 North America Occupational Rehabilitation Revenue (USD Million) By Product (2021-2032)
Table 20 Europe Occupational Rehabilitation Revenue (USD Million) By Type (2021-2032)
Table 21 Europe Occupational Rehabilitation Revenue (USD Million) By Application (2021-2032)
Table 22 Europe Occupational Rehabilitation Revenue (USD Million) By Product (2021-2032)
Table 23 Asia Pacific Occupational Rehabilitation Revenue (USD Million) By Type (2021-2032)
Table 24 Asia Pacific Occupational Rehabilitation Revenue (USD Million) By Application (2021-2032)
Table 25 Asia Pacific Occupational Rehabilitation Revenue (USD Million) By Product (2021-2032)
Table 26 South America Occupational Rehabilitation Revenue (USD Million) By Type (2021-2032)
Table 27 South America Occupational Rehabilitation Revenue (USD Million) By Application (2021-2032)
Table 28 South America Occupational Rehabilitation Revenue (USD Million) By Product (2021-2032)
Table 29 Middle East and Africa Occupational Rehabilitation Revenue (USD Million) By Type (2021-2032)
Table 30 Middle East and Africa Occupational Rehabilitation Revenue (USD Million) By Application (2021-2032)
Table 31 Middle East and Africa Occupational Rehabilitation Revenue (USD Million) By Product (2021-2032)
LIST OF FIGURES
Figure 1. Market Scope
Figure 2. Pricing Forecasts Per Unit, 2023- 2032
Figure 3. Porter’s Five Forces
Figure 4. Global Occupational Rehabilitation Market Revenue (USD Million) By Regions (2021-2032)
Figure 5. Global Occupational Rehabilitation Market Share (%) By Regions (2023)
Figure 6. North America Occupational Rehabilitation Revenue (USD Million) By Country (2021-2032)
Figure 7. United States Occupational Rehabilitation Revenue (USD Million) By Country (2021-2032)
Figure 8. Canada Occupational Rehabilitation Revenue (USD Million) By Country (2021-2032)
Figure 9. Mexico Occupational Rehabilitation Revenue (USD Million) By Country (2021-2032)
Figure 10. Europe Occupational Rehabilitation Revenue (USD Million) By Country (2021-2032)
Figure 11. Germany Occupational Rehabilitation Revenue (USD Million) By Country (2021-2032)
Figure 12. France Occupational Rehabilitation Revenue (USD Million) By Country (2021-2032)
Figure 13. United Kingdom Occupational Rehabilitation Revenue (USD Million) By Country (2021-2032)
Figure 14. Spain Occupational Rehabilitation Revenue (USD Million) By Country (2021-2032)
Figure 15. Italy Occupational Rehabilitation Revenue (USD Million) By Country (2021-2032)
Figure 16. Russia Occupational Rehabilitation Revenue (USD Million) By Country (2021-2032)
Figure 17. Rest of Europe Occupational Rehabilitation Revenue (USD Million) By Country (2021-2032)
Figure 11. Asia Pacific Occupational Rehabilitation Revenue (USD Million) By Country (2021-2032)
Figure 12. China Occupational Rehabilitation Revenue (USD Million) By Country (2021-2032)
Figure 13. Japan Occupational Rehabilitation Revenue (USD Million) By Country (2021-2032)
Figure 14. India Occupational Rehabilitation Revenue (USD Million) By Country (2021-2032)
Figure 15. South Korea Occupational Rehabilitation Revenue (USD Million) By Country (2021-2032)
Figure 16. Australia Occupational Rehabilitation Revenue (USD Million) By Country (2021-2032)
Figure 17. South East Asia Occupational Rehabilitation Revenue (USD Million) By Country (2021-2032)
Figure 18. South America Occupational Rehabilitation Revenue (USD Million) By Country (2021-2032)
Figure 19. Brazil Occupational Rehabilitation Revenue (USD Million) By Country (2021-2032)
Figure 20. Argentina Occupational Rehabilitation Revenue (USD Million) By Country (2021-2032)
Figure 21. Rest of Asia Pacific Occupational Rehabilitation Revenue (USD Million) By Country (2021-2032)
Figure 22. Middle East and Africa Occupational Rehabilitation Revenue (USD Million) By Region (2021-2032)
Figure 23. Saudi Arabia Occupational Rehabilitation Revenue (USD Million) By Region (2021-2032)
Figure 24. The UAE Occupational Rehabilitation Revenue (USD Million) By Region (2021-2032)
Figure 25. Rest of Middle East Occupational Rehabilitation Revenue (USD Million) By Region (2021-2032)
Figure 26. South Africa Occupational Rehabilitation Revenue (USD Million) By Region (2021-2032)
Figure 27. Africa Occupational Rehabilitation Revenue (USD Million) By Region (2021-2032)
Figure 28. North America Occupational Rehabilitation Revenue (USD Million) By Type (2021-2032)
Figure 29. North America Occupational Rehabilitation Revenue (USD Million) By Application (2021-2032)
Figure 30. North America Occupational Rehabilitation Revenue (USD Million) By Product (2021-2032)
Figure 31. Europe Occupational Rehabilitation Revenue (USD Million) By Type (2021-2032)
Figure 32. Europe Occupational Rehabilitation Revenue (USD Million) By Application (2021-2032)
Figure 33. Europe Occupational Rehabilitation Revenue (USD Million) By Product (2021-2032)
Figure 34. Asia Pacific Occupational Rehabilitation Revenue (USD Million) By Type (2021-2032)
Figure 35. Asia Pacific Occupational Rehabilitation Revenue (USD Million) By Application (2021-2032)
Figure 36. Asia Pacific Occupational Rehabilitation Revenue (USD Million) By Product (2021-2032)
Figure 37. South America Occupational Rehabilitation Revenue (USD Million) By Type (2021-2032)
Figure 38. South America Occupational Rehabilitation Revenue (USD Million) By Application (2021-2032)
Figure 39. South America Occupational Rehabilitation Revenue (USD Million) By Product (2021-2032)
Figure 40. Middle East and Africa Occupational Rehabilitation Revenue (USD Million) By Type (2021-2032)
Figure 41. Middle East and Africa Occupational Rehabilitation Revenue (USD Million) By Application (2021-2032)
Figure 42. Middle East and Africa Occupational Rehabilitation Revenue (USD Million) By Product (2021-2032)
By Type
Inpatient Care
Outpatient Care
Home Healthcare
By Application
Hospitals
Nursing Facilities
Schools
Home Health
Others
Countries Analyzed
North America (US, Canada, Mexico)
Europe (Germany, UK, France, Spain, Italy, Russia, Rest of Europe)
Asia Pacific (China, India, Japan, South Korea, Australia, South East Asia, Rest of Asia)
South America (Brazil, Argentina, Rest of South America)
Middle East and Africa (Saudi Arabia, UAE, Rest of Middle East, South Africa, Egypt, Rest of Africa)
