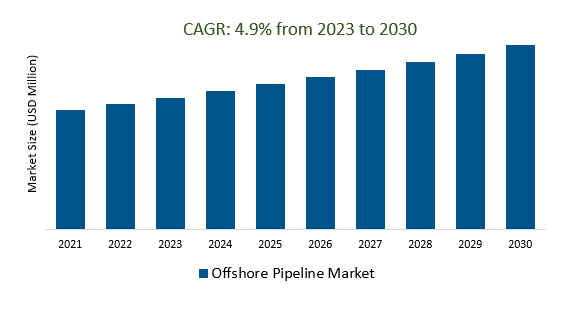
The Global Offshore Pipeline Market Size is estimated to register 4.9% growth over the forecast period from 2023 to 2030.
Market growth is driven by an increase in the growing emphasis on transitioning to cleaner energy sources. This shift has sparked greater interest in offshore hydrogen transportation, with hydrogen pipelines, often integrated with natural gas pipelines, gaining prominence as a method to transport hydrogen generated from renewable sources to onshore locations. This trend is fueled by the imperative to decarbonize energy systems. Leading Companies focusing on Carbon Capture and Storage (CCS) Infrastructure, Hydrate and Gas Hydrate Extraction, Intercontinental and Transoceanic Pipelines, Evolving Materials and Coatings, Deep Ocean Mining and Mineral Transport, and others to boost market shares in the industry.
Market Overview
The offshore pipeline market involves the design, construction, and maintenance of pipelines for transporting oil, natural gas, and other fluids from offshore drilling platforms to onshore facilities. It's heavily dependent on the oil and gas industry, subject to economic fluctuations and geopolitical factors. Technological advancements have enabled deeper water operations, while environmental considerations drive the use of eco-friendly materials and stringent safety standards. Emerging trends like offshore wind energy, hydrogen transport, and carbon capture and storage (CCS) offer new opportunities. The market is global, with significant activity in regions like the Gulf of Mexico and the North Sea, involving various industry players and service providers.
Market Dynamics
Market Trends- Offshore pipelines play a critical role in unlocking the potential of renewable energy sources, facilitating their integration into the global energy mix, and driving the transition towards a sustainable energy future.
Offshore pipelines are pivotal in harnessing the potential of renewable energy sources, seamlessly integrating them into the global energy mix, and propelling the shift toward a sustainable energy future. They facilitate the transmission of electricity from offshore wind farms, ensuring the efficient delivery of clean energy to onshore grids. Additionally, these pipelines support the establishment of offshore hydrogen transport systems, enabling the use of green hydrogen generated from renewable sources. By connecting various renewable energy assets to consumers and markets, offshore pipelines play a significant role in lowering greenhouse gas emissions and promoting the global transition to a more sustainable and environmentally conscious energy environment.
Market Driver- The expansion of Deepwater exploration and production activities is fueling demand for offshore pipelines, as companies seek efficient and reliable transportation solutions for extracting and delivering hydrocarbons from Deepwater reservoirs.
The surge in deepwater exploration and production initiatives is spurring the need for offshore pipelines, as companies actively pursue effective and trustworthy transportation options for extracting and conveying hydrocarbons from deepwater reservoirs. As shallower reserves diminish, the industry is extending its reach into more intricate and demanding offshore settings. Offshore pipelines, featuring cutting-edge technology and materials, assume a vital role in facilitating the secure and dependable transfer of oil and gas resources from these distant and occasionally challenging deepwater sites to onshore processing facilities, bolstering the resilience and sustainability of the energy supply chain.
Market Opportunity- Adherence to stringent environmental regulations and the pursuit of sustainable practices are shaping the offshore pipeline industry, ensuring environmental protection and fostering a more sustainable future for offshore energy production.
Stringent environmental regulations and a commitment to sustainable practices are shaping the offshore pipeline industry, prioritizing environmental protection and a sustainable future for offshore energy production. In response to environmental concerns and climate change, the industry is adopting eco-friendly materials, advanced leak detection systems, and strict safety standards to reduce its ecological impact, aligning offshore energy operations with the global imperative to combat climate change and protect the environment.
Market Share Analysis- Gas Offshore Pipeline Market will register the fastest growth
The Global Offshore Pipeline Market is analyzed across Oil, Gas, Refined Products, and others. Gas is poised to register the fastest growth. The gas offshore pipeline market involves the transportation of natural gas from offshore production facilities to onshore sites. It plays a crucial role in the energy industry, particularly for offshore gas exploration and production. Technological advancements have enabled deeper water operations, and environmental considerations are driving the use of eco-friendly materials and stringent safety standards. The market operates globally, with regions like the Gulf of Mexico and the North Sea being prominent. Economic factors and regulatory changes can significantly influence the market's dynamics. For the latest information, recent industry reports and updates should be consulted, as the market is subject to ongoing developments and changes.
Market Share Analysis- Transport Line held a significant market share in 2023
The Global Offshore Pipeline Market is analyzed across various Organizations including Transport Lines, Export Lines, and others. Of these, Transport Line held a significant market share in 2023. Transport Line for Offshore Pipeline Market" is not a standard industry term or concept. It seems to be a combination of terms related to the offshore pipeline market and transportation. If you could provide more specific information or context, I would be happy to provide you with relevant information or insights. For instance, if you are looking for information about the transportation of materials, equipment, or personnel related to offshore pipeline projects, please clarify, and I will do my best to assist you accordingly.
Offshore Pipeline Market Segmentation
By Type
By Line
- Transport Line
- Export Line
- Others
By Diameter
- Below 24 inches
- Greater than 24 inches
By Installation
By Region
- North America (United States, Canada, Mexico)
- Europe (Germany, France, United Kingdom, Spain, Italy, Others)
- Asia Pacific (China, India, Japan, South Korea, Australia, Others)
- Latin America (Brazil, Argentina, Others)
- Middle East and Africa (Saudi Arabia, UAE, Kuwait, Other Middle East, South Africa, Nigeria, Other Africa)
Offshore Pipeline Market Companies
- McDermott (United States)
- John Wood Group PLC (United Kingdom)
- TechnipFMC plc (United Kingdom)
- Saipem (Italy)
- Sapura Energy Berhad (Malaysia)
- SUBSEA7 (United Kingdom)
- Fugro (Netherlands)
- Atteris (Australia)
- Penspen (United Kingdom)
- Petrofac Limited (United Kingdom)
- Enbridge Inc (Canada)
- L&T Hydrocarbon Engineering (India)
- SoluForce B.V. (Netherlands)
- Bourbon (France)
- DEME (Belgium)
- Allseas (Switzerland)
- Cortez Subsea (United Kingdom)
- Ramboll Group A/S (Denmark)
- Jesco (Saudi Arabia)
- National Petroleum Construction Company (UAE)
*List not exhaustive
Offshore Pipeline Market Outlook 2023
1 Market Overview
1.1 Introduction to the Offshore Pipeline Market
1.2 Scope of the Study
1.3 Research Objective
1.3.1 Key Market Scope and Segments
1.3.2 Players Covered
1.3.3 Years Considered
2 Executive Summary
2.1 2023 Offshore Pipeline Industry- Market Statistics
3 Market Dynamics
3.1 Market Drivers
3.2 Market Challenges
3.3 Market Opportunities
3.4 Market Trends
4 Market Factor Analysis
4.1 Porter’s Five Forces
4.2 Market Entropy
4.2.1 Global Offshore Pipeline Market Companies with Area Served
4.2.2 Products Offerings Global Offshore Pipeline Market
5 COVID-19 Impact Analysis and Outlook Scenarios
5.1.1 Covid-19 Impact Analysis
5.1.2 post-COVID-19 Scenario- Low Growth Case
5.1.3 post-COVID-19 Scenario- Reference Growth Case
5.1.4 post-COVID-19 Scenario- Low Growth Case
6 Global Offshore Pipeline Market Trends
6.1 Global Offshore Pipeline Revenue (USD Million) and CAGR (%) by Type (2018-2030)
6.2 Global Offshore Pipeline Revenue (USD Million) and CAGR (%) by Applications (2018-2030)
6.3 Global Offshore Pipeline Revenue (USD Million) and CAGR (%) by regions (2018-2030)
7 Global Offshore Pipeline Market Revenue (USD Million) by Type, and Applications (2018-2022)
7.1 Global Offshore Pipeline Revenue (USD Million) by Type (2018-2022)
7.1.1 Global Offshore Pipeline Revenue (USD Million), Market Share (%) by Type (2018-2022)
7.2 Global Offshore Pipeline Revenue (USD Million) by Applications (2018-2022)
7.2.1 Global Offshore Pipeline Revenue (USD Million), Market Share (%) by Applications (2018-2022)
8 Global Offshore Pipeline Development Regional Status and Outlook
8.1 Global Offshore Pipeline Revenue (USD Million) By Regions (2018-2022)
8.2 North America Offshore Pipeline Revenue (USD Million) by Type, and Application (2018-2022)
8.2.1 North America Offshore Pipeline Revenue (USD Million) by Country (2018-2022)
8.2.2 North America Offshore Pipeline Revenue (USD Million) by Type (2018-2022)
8.2.3 North America Offshore Pipeline Revenue (USD Million) by Applications (2018-2022)
8.3 Europe Offshore Pipeline Revenue (USD Million), by Type, and Applications (USD Million) (2018-2022)
8.3.1 Europe Offshore Pipeline Revenue (USD Million), by Country (2018-2022)
8.3.2 Europe Offshore Pipeline Revenue (USD Million) by Type (2018-2022)
8.3.3 Europe Offshore Pipeline Revenue (USD Million) by Applications (2018-2022)
8.4 Asia Pacific Offshore Pipeline Revenue (USD Million), and Revenue (USD Million) by Type, and Applications (2018-2022)
8.4.1 Asia Pacific Offshore Pipeline Revenue (USD Million) by Country (2018-2022)
8.4.2 Asia Pacific Offshore Pipeline Revenue (USD Million) by Type (2018-2022)
8.4.3 Asia Pacific Offshore Pipeline Revenue (USD Million) by Applications (2018-2022)
8.5 South America Offshore Pipeline Revenue (USD Million), by Type, and Applications (2018-2022)
8.5.1 South America Offshore Pipeline Revenue (USD Million), by Country (2018-2022)
8.5.2 South America Offshore Pipeline Revenue (USD Million) by Type (2018-2022)
8.5.3 South America Offshore Pipeline Revenue (USD Million) by Applications (2018-2022)
8.6 Middle East and Africa Offshore Pipeline Revenue (USD Million), by Type, Technology, Application, Thickness (2018-2022)
8.6.1 Middle East and Africa Offshore Pipeline Revenue (USD Million) by Country (2018-2022)
8.6.2 Middle East and Africa Offshore Pipeline Revenue (USD Million) by Type (2018-2022)
8.6.3 Middle East and Africa Offshore Pipeline Revenue (USD Million) by Applications (2018-2022)
9 Company Profiles
10 Global Offshore Pipeline Market Revenue (USD Million), by Type, and Applications (2023-2030)
10.1 Global Offshore Pipeline Revenue (USD Million) and Market Share (%) by Type (2023-2030)
10.1.1 Global Offshore Pipeline Revenue (USD Million), and Market Share (%) by Type (2023-2030)
10.2 Global Offshore Pipeline Revenue (USD Million) and Market Share (%) by Applications (2023-2030)
10.2.1 Global Offshore Pipeline Revenue (USD Million), and Market Share (%) by Applications (2023-2030)
11 Global Offshore Pipeline Development Regional Status and Outlook Forecast
11.1 Global Offshore Pipeline Revenue (USD Million) By Regions (2023-2030)
11.2 North America Offshore Pipeline Revenue (USD Million) by Type, and Applications (2023-2030)
11.2.1 North America Offshore Pipeline Revenue (USD) Million by Country (2023-2030)
11.2.2 North America Offshore Pipeline Revenue (USD Million), by Type (2023-2030)
11.2.3 North America Offshore Pipeline Revenue (USD Million), Market Share (%) by Applications (2023-2030)
11.3 Europe Offshore Pipeline Revenue (USD Million), by Type, and Applications (2023-2030)
11.3.1 Europe Offshore Pipeline Revenue (USD Million), by Country (2023-2030)
11.3.2 Europe Offshore Pipeline Revenue (USD Million), by Type (2023-2030)
11.3.3 Europe Offshore Pipeline Revenue (USD Million), by Applications (2023-2030)
11.4 Asia Pacific Offshore Pipeline Revenue (USD Million) by Type, and Applications (2023-2030)
11.4.1 Asia Pacific Offshore Pipeline Revenue (USD Million), by Country (2023-2030)
11.4.2 Asia Pacific Offshore Pipeline Revenue (USD Million), by Type (2023-2030)
11.4.3 Asia Pacific Offshore Pipeline Revenue (USD Million), by Applications (2023-2030)
11.5 South America Offshore Pipeline Revenue (USD Million), by Type, and Applications (2023-2030)
11.5.1 South America Offshore Pipeline Revenue (USD Million), by Country (2023-2030)
11.5.2 South America Offshore Pipeline Revenue (USD Million), by Type (2023-2030)
11.5.3 South America Offshore Pipeline Revenue (USD Million), by Applications (2023-2030)
11.6 Middle East and Africa Offshore Pipeline Revenue (USD Million), by Type, and Applications (2023-2030)
11.6.1 Middle East and Africa Offshore Pipeline Revenue (USD Million), by region (2023-2030)
11.6.2 Middle East and Africa Offshore Pipeline Revenue (USD Million), by Type (2023-2030)
11.6.3 Middle East and Africa Offshore Pipeline Revenue (USD Million), by Applications (2023-2030)
12 Methodology and Data Sources
12.1 Methodology/Research Approach
12.1.1 Research Programs/Design
12.1.2 Market Size Estimation
12.1.3 Market Breakdown and Data Triangulation
12.2 Data Sources
12.2.1 Secondary Sources
12.2.2 Primary Sources
12.3 Disclaimer
List of Tables
Table 1 Market Segmentation Analysis
Table 2 Global Offshore Pipeline Market Companies with Areas Served
Table 3 Products Offerings Global Offshore Pipeline Market
Table 4 Low Growth Scenario Forecasts
Table 5 Reference Case Growth Scenario
Table 6 High Growth Case Scenario
Table 7 Global Offshore Pipeline Revenue (USD Million) And CAGR (%) By Type (2018-2030)
Table 8 Global Offshore Pipeline Revenue (USD Million) And CAGR (%) By Applications (2018-2030)
Table 9 Global Offshore Pipeline Revenue (USD Million) And CAGR (%) By Regions (2018-2030)
Table 10 Global Offshore Pipeline Revenue (USD Million) By Type (2018-2022)
Table 11 Global Offshore Pipeline Revenue Market Share (%) By Type (2018-2022)
Table 12 Global Offshore Pipeline Revenue (USD Million) By Applications (2018-2022)
Table 13 Global Offshore Pipeline Revenue Market Share (%) By Applications (2018-2022)
Table 14 Global Offshore Pipeline Market Revenue (USD Million) By Regions (2018-2022)
Table 15 Global Offshore Pipeline Market Share (%) By Regions (2018-2022)
Table 16 North America Offshore Pipeline Revenue (USD Million) By Country (2018-2022)
Table 17 North America Offshore Pipeline Revenue (USD Million) By Type (2018-2022)
Table 18 North America Offshore Pipeline Revenue (USD Million) By Applications (2018-2022)
Table 19 Europe Offshore Pipeline Revenue (USD Million) By Country (2018-2022)
Table 20 Europe Offshore Pipeline Revenue (USD Million) By Type (2018-2022)
Table 21 Europe Offshore Pipeline Revenue (USD Million) By Applications (2018-2022)
Table 22 Asia Pacific Offshore Pipeline Revenue (USD Million) By Country (2018-2022)
Table 23 Asia Pacific Offshore Pipeline Revenue (USD Million) By Type (2018-2022)
Table 24 Asia Pacific Offshore Pipeline Revenue (USD Million) By Applications (2018-2022)
Table 25 South America Offshore Pipeline Revenue (USD Million) By Country (2018-2022)
Table 26 South America Offshore Pipeline Revenue (USD Million) By Type (2018-2022)
Table 27 South America Offshore Pipeline Revenue (USD Million) By Applications (2018-2022)
Table 28 Middle East and Africa Offshore Pipeline Revenue (USD Million) By Region (2018-2022)
Table 29 Middle East and Africa Offshore Pipeline Revenue (USD Million) By Type (2018-2022)
Table 30 Middle East and Africa Offshore Pipeline Revenue (USD Million) By Applications (2018-2022)
Table 31 Financial Analysis
Table 32 Global Offshore Pipeline Revenue (USD Million) By Type (2023-2030)
Table 33 Global Offshore Pipeline Revenue Market Share (%) By Type (2023-2030)
Table 34 Global Offshore Pipeline Revenue (USD Million) By Applications (2023-2030)
Table 35 Global Offshore Pipeline Revenue Market Share (%) By Applications (2023-2030)
Table 36 Global Offshore Pipeline Market Revenue (USD Million), And Revenue (USD Million) By Regions (2023-2030)
Table 37 North America Offshore Pipeline Revenue (USD)By Country (2023-2030)
Table 38 North America Offshore Pipeline Revenue (USD Million) By Type (2023-2030)
Table 39 North America Offshore Pipeline Revenue (USD Million) By Applications (2023-2030)
Table 40 Europe Offshore Pipeline Revenue (USD Million) By Country (2023-2030)
Table 41 Europe Offshore Pipeline Revenue (USD Million) By Type (2023-2030)
Table 42 Europe Offshore Pipeline Revenue (USD Million) By Applications (2023-2030)
Table 43 Asia Pacific Offshore Pipeline Revenue (USD Million) By Country (2023-2030)
Table 44 Asia Pacific Offshore Pipeline Revenue (USD Million) By Type (2023-2030)
Table 45 Asia Pacific Offshore Pipeline Revenue (USD Million) By Applications (2023-2030)
Table 46 South America Offshore Pipeline Revenue (USD Million) By Country (2023-2030)
Table 47 South America Offshore Pipeline Revenue (USD Million) By Type (2023-2030)
Table 48 South America Offshore Pipeline Revenue (USD Million) By Applications (2023-2030)
Table 49 Middle East and Africa Offshore Pipeline Revenue (USD Million) By Region (2023-2030)
Table 50 Middle East and Africa Offshore Pipeline Revenue (USD Million) By Region (2023-2030)
Table 51 Middle East and Africa Offshore Pipeline Revenue (USD Million) By Type (2023-2030)
Table 52 Middle East and Africa Offshore Pipeline Revenue (USD Million) By Applications (2023-2030)
Table 53 Research Programs/Design for This Report
Table 54 Key Data Information from Secondary Sources
Table 55 Key Data Information from Primary Sources
List of Figures
Figure 1 Market Scope
Figure 2 Porter’s Five Forces
Figure 3 Global Offshore Pipeline Revenue (USD Million) By Type (2018-2022)
Figure 4 Global Offshore Pipeline Revenue Market Share (%) By Type (2022)
Figure 5 Global Offshore Pipeline Revenue (USD Million) By Applications (2018-2022)
Figure 6 Global Offshore Pipeline Revenue Market Share (%) By Applications (2022)
Figure 7 Global Offshore Pipeline Market Revenue (USD Million) By Regions (2018-2022)
Figure 8 Global Offshore Pipeline Market Share (%) By Regions (2022)
Figure 9 North America Offshore Pipeline Revenue (USD Million) By Country (2018-2022)
Figure 10 North America Offshore Pipeline Revenue (USD Million) By Type (2018-2022)
Figure 11 North America Offshore Pipeline Revenue (USD Million) By Applications (2018-2022)
Figure 12 Europe Offshore Pipeline Revenue (USD Million) By Country (2018-2022)
Figure 13 Europe Offshore Pipeline Revenue (USD Million) By Type (2018-2022)
Figure 14 Europe Offshore Pipeline Revenue (USD Million) By Applications (2018-2022)
Figure 15 Asia Pacific Offshore Pipeline Revenue (USD Million) By Country (2018-2022)
Figure 16 Asia Pacific Offshore Pipeline Revenue (USD Million) By Type (2018-2022)
Figure 17 Asia Pacific Offshore Pipeline Revenue (USD Million) By Applications (2018-2022)
Figure 18 South America Offshore Pipeline Revenue (USD Million) By Country (2018-2022)
Figure 19 South America Offshore Pipeline Revenue (USD Million) By Type (2018-2022)
Figure 20 South America Offshore Pipeline Revenue (USD Million) By Applications (2018-2022)
Figure 21 Middle East and Africa Offshore Pipeline Revenue (USD Million) By Region (2018-2022)
Figure 22 Middle East and Africa Offshore Pipeline Revenue (USD Million) By Type (2018-2022)
Figure 23 Middle East and Africa Offshore Pipeline Revenue (USD Million) By Applications (2018-2022)
Figure 24 Global Offshore Pipeline Revenue (USD Million) By Type (2023-2030)
Figure 25 Global Offshore Pipeline Revenue Market Share (%) By Type (2030)
Figure 26 Global Offshore Pipeline Revenue (USD Million) By Applications (2023-2030)
Figure 27 Global Offshore Pipeline Revenue Market Share (%) By Applications (2030)
Figure 28 Global Offshore Pipeline Market Revenue (USD Million) By Regions (2023-2030)
Figure 29 North America Offshore Pipeline Revenue (USD Million) By Country (2023-2030)
Figure 30 North America Offshore Pipeline Revenue (USD Million) By Type (2023-2030)
Figure 31 North America Offshore Pipeline Revenue (USD Million) By Applications (2023-2030)
Figure 32 Europe Offshore Pipeline Revenue (USD Million) By Country (2023-2030)
Figure 33 Europe Offshore Pipeline Revenue (USD Million) By Type (2023-2030)
Figure 34 Europe Offshore Pipeline Revenue (USD Million) By Applications (2023-2030)
Figure 35 Asia Pacific Offshore Pipeline Revenue (USD Million) By Country (2023-2030)
Figure 36 Asia Pacific Offshore Pipeline Revenue (USD Million) By Type (2023-2030)
Figure 37 Asia Pacific Offshore Pipeline Revenue (USD Million) By Applications (2023-2030)
Figure 38 South America Offshore Pipeline Revenue (USD Million) By Country (2023-2030)
Figure 39 South America Offshore Pipeline Revenue (USD Million) By Type (2023-2030)
Figure 40 South America Offshore Pipeline Revenue (USD Million) By Applications (2023-2030)
Figure 41 Middle East and Africa Offshore Pipeline Revenue (USD Million) By Region (2023-2030)
Figure 42 Middle East and Africa Offshore Pipeline Revenue (USD Million) By Region (2023-2030)
Figure 43 Middle East and Africa Offshore Pipeline Revenue (USD Million) By Type (2023-2030)
Figure 44 Middle East and Africa Offshore Pipeline Revenue (USD Million) By Applications (2023-2030)
Figure 45 Bottom-Up and Top-Down Approaches for This Report
Figure 46 Data Triangulation
