
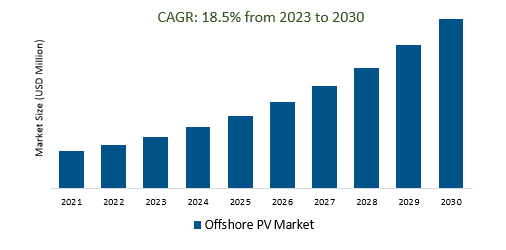
The Global Offshore PV Market Size is estimated to register 18.5% growth over the forecast period from 2023 to 2030.
The market growth is driven by increasing ongoing research and development leading to improved solar panel efficiency and new materials for use in offshore environments, increasing the feasibility of offshore PV projects. Leading Companies focusing on Capacity Expansion, Global Expansion, Technological Advancements, Hybrid Energy Systems, Floating Solar, Green Hydrogen Production, Job Creation, and others to boost market shares in the industry.
The Offshore PV Market, involving the installation of solar panels on water bodies, has seen rapid growth due to increasing global demand for clean energy and land constraints in densely populated areas. Major drivers include climate change mitigation, technological advancements, and government support through incentives and regulations. Challenges include high initial costs and the need for environmental considerations. The market's geographical presence has been notable in Europe and Asia, with innovations in floating solar technology and improved grid integration. The sector is dynamic and continually evolving, with a focus on sustainable energy production and environmental benefits.
Floating solar farms present a compelling solution within the Offshore PV Market, offering several significant advantages. The solar energy on water bodies, not only generate clean electricity but also utilize otherwise unused space, reducing the pressure on land resources, a critical consideration in densely populated regions. Additionally, the presence of solar panels can provide shade, mitigating water evaporation and thereby improving water quality, which can be particularly important in arid or water-stressed areas.
Private sector investments in the Offshore PV Market have been on the rise due to the increasing recognition of offshore solar energy as a lucrative and sustainable investment opportunity. As corporations and private investors diversify their portfolios, many are turning to offshore PV projects, attracted by the potential for consistent long-term returns and alignment with environmental sustainability goals. These investments are injecting substantial capital into the sector, enabling the development of larger and more technologically advanced offshore PV installations.
The introduction of local job creation initiatives is playing a pivotal role in fueling the growth of the Offshore PV Market. As governments and organizations recognize the economic and social benefits of renewable energy projects, they are increasingly prioritizing local job opportunities. Offshore PV installations require a range of skilled and unskilled labor, from manufacturing and construction to maintenance and operations. By generating employment opportunities within communities, offshore PV projects not only contribute to regional economic development but also foster public support for clean energy initiatives.
The Global Offshore PV Market is analyzed across Floating PV, Fixed PV, and others. Floating PV is poised to register the fastest growth. Floating PV, a subsector of the Offshore PV Market, involves installing solar panels on water surfaces such as lakes and oceans. This approach maximizes space efficiency, reduces water evaporation, and enhances water quality. It's gaining global popularity as an environmentally friendly and innovative solution for clean energy generation, particularly in regions with limited land availability and a strong focus on renewable energy in the fight against climate change. Floating PV underscores the adaptability of solar technology and broadens the Offshore PV Market's reach by utilizing untapped water resources.
The Global Offshore PV Market is analyzed across various applications including Near Coast (Shallow Sea), Real Offshore (Deep Sea), and others. Of these, Near Coast held a significant market share in 2023. The Near Coast (Shallow Sea) Offshore PV Market involves deploying photovoltaic solar panels in the shallow waters of coastal regions, offering a close-to-shore renewable energy solution. It addresses land constraints and rising demand for clean energy, capitalizing on the advantages of shallower sea environments. This market contributes to the broader offshore PV sector by providing environmentally friendly energy options in coastal areas.
By Type
By Application
By Region
*List not exhaustive
Offshore PV Market Outlook 2023
1 Market Overview
1.1 Introduction to the Offshore PV Market
1.2 Scope of the Study
1.3 Research Objective
1.3.1 Key Market Scope and Segments
1.3.2 Players Covered
1.3.3 Years Considered
2 Executive Summary
2.1 2023 Offshore PV Industry- Market Statistics
3 Market Dynamics
3.1 Market Drivers
3.2 Market Challenges
3.3 Market Opportunities
3.4 Market Trends
4 Market Factor Analysis
4.1 Porter’s Five Forces
4.2 Market Entropy
4.2.1 Global Offshore PV Market Companies with Area Served
4.2.2 Products Offerings Global Offshore PV Market
5 COVID-19 Impact Analysis and Outlook Scenarios
5.1.1 Covid-19 Impact Analysis
5.1.2 post-COVID-19 Scenario- Low Growth Case
5.1.3 post-COVID-19 Scenario- Reference Growth Case
5.1.4 post-COVID-19 Scenario- Low Growth Case
6 Global Offshore PV Market Trends
6.1 Global Offshore PV Revenue (USD Million) and CAGR (%) by Type (2018-2030)
6.2 Global Offshore PV Revenue (USD Million) and CAGR (%) by Applications (2018-2030)
6.3 Global Offshore PV Revenue (USD Million) and CAGR (%) by regions (2018-2030)
7 Global Offshore PV Market Revenue (USD Million) by Type, and Applications (2018-2022)
7.1 Global Offshore PV Revenue (USD Million) by Type (2018-2022)
7.1.1 Global Offshore PV Revenue (USD Million), Market Share (%) by Type (2018-2022)
7.2 Global Offshore PV Revenue (USD Million) by Applications (2018-2022)
7.2.1 Global Offshore PV Revenue (USD Million), Market Share (%) by Applications (2018-2022)
8 Global Offshore PV Development Regional Status and Outlook
8.1 Global Offshore PV Revenue (USD Million) By Regions (2018-2022)
8.2 North America Offshore PV Revenue (USD Million) by Type, and Application (2018-2022)
8.2.1 North America Offshore PV Revenue (USD Million) by Country (2018-2022)
8.2.2 North America Offshore PV Revenue (USD Million) by Type (2018-2022)
8.2.3 North America Offshore PV Revenue (USD Million) by Applications (2018-2022)
8.3 Europe Offshore PV Revenue (USD Million), by Type, and Applications (USD Million) (2018-2022)
8.3.1 Europe Offshore PV Revenue (USD Million), by Country (2018-2022)
8.3.2 Europe Offshore PV Revenue (USD Million) by Type (2018-2022)
8.3.3 Europe Offshore PV Revenue (USD Million) by Applications (2018-2022)
8.4 Asia Pacific Offshore PV Revenue (USD Million), and Revenue (USD Million) by Type, and Applications (2018-2022)
8.4.1 Asia Pacific Offshore PV Revenue (USD Million) by Country (2018-2022)
8.4.2 Asia Pacific Offshore PV Revenue (USD Million) by Type (2018-2022)
8.4.3 Asia Pacific Offshore PV Revenue (USD Million) by Applications (2018-2022)
8.5 South America Offshore PV Revenue (USD Million), by Type, and Applications (2018-2022)
8.5.1 South America Offshore PV Revenue (USD Million), by Country (2018-2022)
8.5.2 South America Offshore PV Revenue (USD Million) by Type (2018-2022)
8.5.3 South America Offshore PV Revenue (USD Million) by Applications (2018-2022)
8.6 Middle East and Africa Offshore PV Revenue (USD Million), by Type, Technology, Application, Thickness (2018-2022)
8.6.1 Middle East and Africa Offshore PV Revenue (USD Million) by Country (2018-2022)
8.6.2 Middle East and Africa Offshore PV Revenue (USD Million) by Type (2018-2022)
8.6.3 Middle East and Africa Offshore PV Revenue (USD Million) by Applications (2018-2022)
9 Company Profiles
10 Global Offshore PV Market Revenue (USD Million), by Type, and Applications (2023-2030)
10.1 Global Offshore PV Revenue (USD Million) and Market Share (%) by Type (2023-2030)
10.1.1 Global Offshore PV Revenue (USD Million), and Market Share (%) by Type (2023-2030)
10.2 Global Offshore PV Revenue (USD Million) and Market Share (%) by Applications (2023-2030)
10.2.1 Global Offshore PV Revenue (USD Million), and Market Share (%) by Applications (2023-2030)
11 Global Offshore PV Development Regional Status and Outlook Forecast
11.1 Global Offshore PV Revenue (USD Million) By Regions (2023-2030)
11.2 North America Offshore PV Revenue (USD Million) by Type, and Applications (2023-2030)
11.2.1 North America Offshore PV Revenue (USD) Million by Country (2023-2030)
11.2.2 North America Offshore PV Revenue (USD Million), by Type (2023-2030)
11.2.3 North America Offshore PV Revenue (USD Million), Market Share (%) by Applications (2023-2030)
11.3 Europe Offshore PV Revenue (USD Million), by Type, and Applications (2023-2030)
11.3.1 Europe Offshore PV Revenue (USD Million), by Country (2023-2030)
11.3.2 Europe Offshore PV Revenue (USD Million), by Type (2023-2030)
11.3.3 Europe Offshore PV Revenue (USD Million), by Applications (2023-2030)
11.4 Asia Pacific Offshore PV Revenue (USD Million) by Type, and Applications (2023-2030)
11.4.1 Asia Pacific Offshore PV Revenue (USD Million), by Country (2023-2030)
11.4.2 Asia Pacific Offshore PV Revenue (USD Million), by Type (2023-2030)
11.4.3 Asia Pacific Offshore PV Revenue (USD Million), by Applications (2023-2030)
11.5 South America Offshore PV Revenue (USD Million), by Type, and Applications (2023-2030)
11.5.1 South America Offshore PV Revenue (USD Million), by Country (2023-2030)
11.5.2 South America Offshore PV Revenue (USD Million), by Type (2023-2030)
11.5.3 South America Offshore PV Revenue (USD Million), by Applications (2023-2030)
11.6 Middle East and Africa Offshore PV Revenue (USD Million), by Type, and Applications (2023-2030)
11.6.1 Middle East and Africa Offshore PV Revenue (USD Million), by region (2023-2030)
11.6.2 Middle East and Africa Offshore PV Revenue (USD Million), by Type (2023-2030)
11.6.3 Middle East and Africa Offshore PV Revenue (USD Million), by Applications (2023-2030)
12 Methodology and Data Sources
12.1 Methodology/Research Approach
12.1.1 Research Programs/Design
12.1.2 Market Size Estimation
12.1.3 Market Breakdown and Data Triangulation
12.2 Data Sources
12.2.1 Secondary Sources
12.2.2 Primary Sources
12.3 Disclaimer
List of Tables
Table 1 Market Segmentation Analysis
Table 2 Global Offshore PV Market Companies with Areas Served
Table 3 Products Offerings Global Offshore PV Market
Table 4 Low Growth Scenario Forecasts
Table 5 Reference Case Growth Scenario
Table 6 High Growth Case Scenario
Table 7 Global Offshore PV Revenue (USD Million) And CAGR (%) By Type (2018-2030)
Table 8 Global Offshore PV Revenue (USD Million) And CAGR (%) By Applications (2018-2030)
Table 9 Global Offshore PV Revenue (USD Million) And CAGR (%) By Regions (2018-2030)
Table 10 Global Offshore PV Revenue (USD Million) By Type (2018-2022)
Table 11 Global Offshore PV Revenue Market Share (%) By Type (2018-2022)
Table 12 Global Offshore PV Revenue (USD Million) By Applications (2018-2022)
Table 13 Global Offshore PV Revenue Market Share (%) By Applications (2018-2022)
Table 14 Global Offshore PV Market Revenue (USD Million) By Regions (2018-2022)
Table 15 Global Offshore PV Market Share (%) By Regions (2018-2022)
Table 16 North America Offshore PV Revenue (USD Million) By Country (2018-2022)
Table 17 North America Offshore PV Revenue (USD Million) By Type (2018-2022)
Table 18 North America Offshore PV Revenue (USD Million) By Applications (2018-2022)
Table 19 Europe Offshore PV Revenue (USD Million) By Country (2018-2022)
Table 20 Europe Offshore PV Revenue (USD Million) By Type (2018-2022)
Table 21 Europe Offshore PV Revenue (USD Million) By Applications (2018-2022)
Table 22 Asia Pacific Offshore PV Revenue (USD Million) By Country (2018-2022)
Table 23 Asia Pacific Offshore PV Revenue (USD Million) By Type (2018-2022)
Table 24 Asia Pacific Offshore PV Revenue (USD Million) By Applications (2018-2022)
Table 25 South America Offshore PV Revenue (USD Million) By Country (2018-2022)
Table 26 South America Offshore PV Revenue (USD Million) By Type (2018-2022)
Table 27 South America Offshore PV Revenue (USD Million) By Applications (2018-2022)
Table 28 Middle East and Africa Offshore PV Revenue (USD Million) By Region (2018-2022)
Table 29 Middle East and Africa Offshore PV Revenue (USD Million) By Type (2018-2022)
Table 30 Middle East and Africa Offshore PV Revenue (USD Million) By Applications (2018-2022)
Table 31 Financial Analysis
Table 32 Global Offshore PV Revenue (USD Million) By Type (2023-2030)
Table 33 Global Offshore PV Revenue Market Share (%) By Type (2023-2030)
Table 34 Global Offshore PV Revenue (USD Million) By Applications (2023-2030)
Table 35 Global Offshore PV Revenue Market Share (%) By Applications (2023-2030)
Table 36 Global Offshore PV Market Revenue (USD Million), And Revenue (USD Million) By Regions (2023-2030)
Table 37 North America Offshore PV Revenue (USD)By Country (2023-2030)
Table 38 North America Offshore PV Revenue (USD Million) By Type (2023-2030)
Table 39 North America Offshore PV Revenue (USD Million) By Applications (2023-2030)
Table 40 Europe Offshore PV Revenue (USD Million) By Country (2023-2030)
Table 41 Europe Offshore PV Revenue (USD Million) By Type (2023-2030)
Table 42 Europe Offshore PV Revenue (USD Million) By Applications (2023-2030)
Table 43 Asia Pacific Offshore PV Revenue (USD Million) By Country (2023-2030)
Table 44 Asia Pacific Offshore PV Revenue (USD Million) By Type (2023-2030)
Table 45 Asia Pacific Offshore PV Revenue (USD Million) By Applications (2023-2030)
Table 46 South America Offshore PV Revenue (USD Million) By Country (2023-2030)
Table 47 South America Offshore PV Revenue (USD Million) By Type (2023-2030)
Table 48 South America Offshore PV Revenue (USD Million) By Applications (2023-2030)
Table 49 Middle East and Africa Offshore PV Revenue (USD Million) By Region (2023-2030)
Table 50 Middle East and Africa Offshore PV Revenue (USD Million) By Region (2023-2030)
Table 51 Middle East and Africa Offshore PV Revenue (USD Million) By Type (2023-2030)
Table 52 Middle East and Africa Offshore PV Revenue (USD Million) By Applications (2023-2030)
Table 53 Research Programs/Design for This Report
Table 54 Key Data Information from Secondary Sources
Table 55 Key Data Information from Primary Sources
List of Figures
Figure 1 Market Scope
Figure 2 Porter’s Five Forces
Figure 3 Global Offshore PV Revenue (USD Million) By Type (2018-2022)
Figure 4 Global Offshore PV Revenue Market Share (%) By Type (2022)
Figure 5 Global Offshore PV Revenue (USD Million) By Applications (2018-2022)
Figure 6 Global Offshore PV Revenue Market Share (%) By Applications (2022)
Figure 7 Global Offshore PV Market Revenue (USD Million) By Regions (2018-2022)
Figure 8 Global Offshore PV Market Share (%) By Regions (2022)
Figure 9 North America Offshore PV Revenue (USD Million) By Country (2018-2022)
Figure 10 North America Offshore PV Revenue (USD Million) By Type (2018-2022)
Figure 11 North America Offshore PV Revenue (USD Million) By Applications (2018-2022)
Figure 12 Europe Offshore PV Revenue (USD Million) By Country (2018-2022)
Figure 13 Europe Offshore PV Revenue (USD Million) By Type (2018-2022)
Figure 14 Europe Offshore PV Revenue (USD Million) By Applications (2018-2022)
Figure 15 Asia Pacific Offshore PV Revenue (USD Million) By Country (2018-2022)
Figure 16 Asia Pacific Offshore PV Revenue (USD Million) By Type (2018-2022)
Figure 17 Asia Pacific Offshore PV Revenue (USD Million) By Applications (2018-2022)
Figure 18 South America Offshore PV Revenue (USD Million) By Country (2018-2022)
Figure 19 South America Offshore PV Revenue (USD Million) By Type (2018-2022)
Figure 20 South America Offshore PV Revenue (USD Million) By Applications (2018-2022)
Figure 21 Middle East and Africa Offshore PV Revenue (USD Million) By Region (2018-2022)
Figure 22 Middle East and Africa Offshore PV Revenue (USD Million) By Type (2018-2022)
Figure 23 Middle East and Africa Offshore PV Revenue (USD Million) By Applications (2018-2022)
Figure 24 Global Offshore PV Revenue (USD Million) By Type (2023-2030)
Figure 25 Global Offshore PV Revenue Market Share (%) By Type (2030)
Figure 26 Global Offshore PV Revenue (USD Million) By Applications (2023-2030)
Figure 27 Global Offshore PV Revenue Market Share (%) By Applications (2030)
Figure 28 Global Offshore PV Market Revenue (USD Million) By Regions (2023-2030)
Figure 29 North America Offshore PV Revenue (USD Million) By Country (2023-2030)
Figure 30 North America Offshore PV Revenue (USD Million) By Type (2023-2030)
Figure 31 North America Offshore PV Revenue (USD Million) By Applications (2023-2030)
Figure 32 Europe Offshore PV Revenue (USD Million) By Country (2023-2030)
Figure 33 Europe Offshore PV Revenue (USD Million) By Type (2023-2030)
Figure 34 Europe Offshore PV Revenue (USD Million) By Applications (2023-2030)
Figure 35 Asia Pacific Offshore PV Revenue (USD Million) By Country (2023-2030)
Figure 36 Asia Pacific Offshore PV Revenue (USD Million) By Type (2023-2030)
Figure 37 Asia Pacific Offshore PV Revenue (USD Million) By Applications (2023-2030)
Figure 38 South America Offshore PV Revenue (USD Million) By Country (2023-2030)
Figure 39 South America Offshore PV Revenue (USD Million) By Type (2023-2030)
Figure 40 South America Offshore PV Revenue (USD Million) By Applications (2023-2030)
Figure 41 Middle East and Africa Offshore PV Revenue (USD Million) By Region (2023-2030)
Figure 42 Middle East and Africa Offshore PV Revenue (USD Million) By Region (2023-2030)
Figure 43 Middle East and Africa Offshore PV Revenue (USD Million) By Type (2023-2030)
Figure 44 Middle East and Africa Offshore PV Revenue (USD Million) By Applications (2023-2030)
Figure 45 Bottom-Up and Top-Down Approaches for This Report
Figure 46 Data Triangulation
By Type
By Application
By Region