
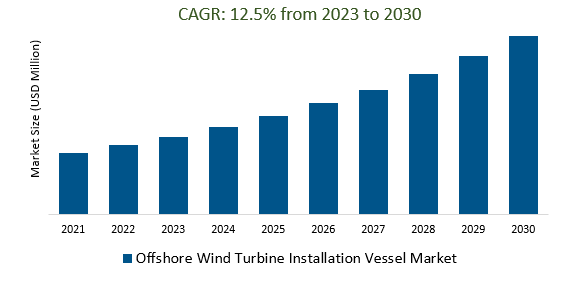
The Global Offshore Wind Turbine Installation Vessel Market Size is estimated to register 12.5% growth over the forecast period from 2023 to 2030.
The market growth is driven by an increasing growth of floating offshore wind farms is driving the need for specialized WTIVs designed for these installations. Leading Companies focusing on Expanding Offshore Wind Capacity, Technology Advancements, Larger Turbines and Deeper Waters, Floating Wind Farms, Digitalization and Data Analytics, and others to boost market shares in the industry.
The Offshore Wind Turbine Installation Vessel (WTIV) market was experiencing global growth driven by the expanding offshore wind industry, substantial investments, and specialized vessel needs for wind turbine installation, maintenance, and decommissioning. This market featured key players like DEME Group and Fred. Olsen Wind carrier, and was characterized by technological advancements, particularly in crane capacity and digitalization, to handle larger turbine sizes and improve operational efficiency. Challenges and opportunities arose from environmental considerations, decommissioning requirements, and supply chain logistics, while the market's future appeared promising with the ongoing expansion of offshore wind projects globally.
The Offshore Wind Turbine Installation Vessel (WTIV) market is experiencing robust growth, primarily due to the rapid expansion of the global offshore wind energy industry. This surge in demand is driven by the proliferation of offshore wind projects worldwide, including in Europe, Asia-Pacific, and North America. WTIVs are critical for transporting, installing, and maintaining wind turbines in challenging marine environments, with innovative technologies enhancing operational efficiency and safety. Furthermore, stringent environmental regulations and emissions reduction goals are propelling the transition to cleaner energy sources, solidifying the WTIV market's pivotal role in the global shift towards sustainable energy solutions.
The demand for specialized installation vessels in the Offshore Wind Turbine Installation Vessel (WTIV) market is being driven by the growing size of offshore wind turbines. As wind turbines increase in size to capture more energy, there is a pressing need for WTIVs with the capacity to efficiently and safely handle these larger components. Vessel manufacturers and operators are responding by investing in advanced technologies and heavy-lift cranes to adapt to the changing landscape of the offshore wind industry, highlighting the importance of innovation and flexibility to meet the industry's evolving needs for greater energy production and cost-effectiveness in renewable energy projects.
The Offshore Wind Turbine Installation Vessel (WTIV) market is experiencing a shift as a growing number of offshore wind turbines near the end of their operational lifespan, creating a demand for specialized vessels capable of efficiently and safely decommissioning these turbines. These vessels are now sought after to dismantle and transport turbine components back to shore, signifying the maturation of the offshore wind industry and offering opportunities for WTIV operators to diversify their services by providing specialized decommissioning solutions.
The Global Offshore Wind Turbine Installation Vessel Market is analyzed across Self-propelled Jack-up Vessel, Normal Jack-up Vessel, Heavy Lift Vessel, and others. Self-propelled Jack-up Vessel is poised to register the fastest growth. The Self-propelled Jack-up Vessel (SPJUV) market within the Offshore Wind Turbine Installation Vessel (WTIV) sector is highly specialized, offering efficient and cost-effective solutions for the installation and maintenance of offshore wind turbines. Equipped with self-elevating legs, SPJUVs provide stability and access to offshore wind installation sites, particularly in areas with varying water depths and challenging seabed conditions. This market segment is witnessing growth in tandem with the offshore wind industry's expansion, with key players like Seajacks and DEME Group providing these vessels. The adaptability and technological advancements in SPJUVs position them as valuable assets for the sector, enhancing installation efficiency and safety in offshore wind projects.
The Global Offshore Wind Turbine Installation Vessel Market is analyzed across various applications including Onshore Wind, Offshore Wind, and others. Of these, Offshore Wind held a significant market share in 2023. The Offshore Wind Turbine Installation Vessel (WTIV) market is a critical component of the offshore wind energy sector, with a pivotal role in installing, maintaining, and decommissioning offshore wind turbines. It is experiencing substantial growth due to the global expansion of offshore wind projects, the development of larger turbines, and technological innovations. Key trends include the growth in turbine size, the global reach of offshore wind projects, and the use of advanced technologies to enhance operational efficiency and safety. The WTIV market is poised to continue evolving as offshore wind energy plays a central role in the transition to cleaner and more sustainable energy sources.
By Type
By Application
By Region
*List not exhaustive
Offshore Wind Turbine Installation Vessel Market Outlook 2023
1 Market Overview
1.1 Introduction to the Offshore Wind Turbine Installation Vessel Market
1.2 Scope of the Study
1.3 Research Objective
1.3.1 Key Market Scope and Segments
1.3.2 Players Covered
1.3.3 Years Considered
2 Executive Summary
2.1 2023 Offshore Wind Turbine Installation Vessel Industry- Market Statistics
3 Market Dynamics
3.1 Market Drivers
3.2 Market Challenges
3.3 Market Opportunities
3.4 Market Trends
4 Market Factor Analysis
4.1 Porter’s Five Forces
4.2 Market Entropy
4.2.1 Global Offshore Wind Turbine Installation Vessel Market Companies with Area Served
4.2.2 Products Offerings Global Offshore Wind Turbine Installation Vessel Market
5 COVID-19 Impact Analysis and Outlook Scenarios
5.1.1 Covid-19 Impact Analysis
5.1.2 post-COVID-19 Scenario- Low Growth Case
5.1.3 post-COVID-19 Scenario- Reference Growth Case
5.1.4 post-COVID-19 Scenario- Low Growth Case
6 Global Offshore Wind Turbine Installation Vessel Market Trends
6.1 Global Offshore Wind Turbine Installation Vessel Revenue (USD Million) and CAGR (%) by Type (2018-2030)
6.2 Global Offshore Wind Turbine Installation Vessel Revenue (USD Million) and CAGR (%) by Applications (2018-2030)
6.3 Global Offshore Wind Turbine Installation Vessel Revenue (USD Million) and CAGR (%) by regions (2018-2030)
7 Global Offshore Wind Turbine Installation Vessel Market Revenue (USD Million) by Type, and Applications (2018-2022)
7.1 Global Offshore Wind Turbine Installation Vessel Revenue (USD Million) by Type (2018-2022)
7.1.1 Global Offshore Wind Turbine Installation Vessel Revenue (USD Million), Market Share (%) by Type (2018-2022)
7.2 Global Offshore Wind Turbine Installation Vessel Revenue (USD Million) by Applications (2018-2022)
7.2.1 Global Offshore Wind Turbine Installation Vessel Revenue (USD Million), Market Share (%) by Applications (2018-2022)
8 Global Offshore Wind Turbine Installation Vessel Development Regional Status and Outlook
8.1 Global Offshore Wind Turbine Installation Vessel Revenue (USD Million) By Regions (2018-2022)
8.2 North America Offshore Wind Turbine Installation Vessel Revenue (USD Million) by Type, and Application (2018-2022)
8.2.1 North America Offshore Wind Turbine Installation Vessel Revenue (USD Million) by Country (2018-2022)
8.2.2 North America Offshore Wind Turbine Installation Vessel Revenue (USD Million) by Type (2018-2022)
8.2.3 North America Offshore Wind Turbine Installation Vessel Revenue (USD Million) by Applications (2018-2022)
8.3 Europe Offshore Wind Turbine Installation Vessel Revenue (USD Million), by Type, and Applications (USD Million) (2018-2022)
8.3.1 Europe Offshore Wind Turbine Installation Vessel Revenue (USD Million), by Country (2018-2022)
8.3.2 Europe Offshore Wind Turbine Installation Vessel Revenue (USD Million) by Type (2018-2022)
8.3.3 Europe Offshore Wind Turbine Installation Vessel Revenue (USD Million) by Applications (2018-2022)
8.4 Asia Pacific Offshore Wind Turbine Installation Vessel Revenue (USD Million), and Revenue (USD Million) by Type, and Applications (2018-2022)
8.4.1 Asia Pacific Offshore Wind Turbine Installation Vessel Revenue (USD Million) by Country (2018-2022)
8.4.2 Asia Pacific Offshore Wind Turbine Installation Vessel Revenue (USD Million) by Type (2018-2022)
8.4.3 Asia Pacific Offshore Wind Turbine Installation Vessel Revenue (USD Million) by Applications (2018-2022)
8.5 South America Offshore Wind Turbine Installation Vessel Revenue (USD Million), by Type, and Applications (2018-2022)
8.5.1 South America Offshore Wind Turbine Installation Vessel Revenue (USD Million), by Country (2018-2022)
8.5.2 South America Offshore Wind Turbine Installation Vessel Revenue (USD Million) by Type (2018-2022)
8.5.3 South America Offshore Wind Turbine Installation Vessel Revenue (USD Million) by Applications (2018-2022)
8.6 Middle East and Africa Offshore Wind Turbine Installation Vessel Revenue (USD Million), by Type, Technology, Application, Thickness (2018-2022)
8.6.1 Middle East and Africa Offshore Wind Turbine Installation Vessel Revenue (USD Million) by Country (2018-2022)
8.6.2 Middle East and Africa Offshore Wind Turbine Installation Vessel Revenue (USD Million) by Type (2018-2022)
8.6.3 Middle East and Africa Offshore Wind Turbine Installation Vessel Revenue (USD Million) by Applications (2018-2022)
9 Company Profiles
10 Global Offshore Wind Turbine Installation Vessel Market Revenue (USD Million), by Type, and Applications (2023-2030)
10.1 Global Offshore Wind Turbine Installation Vessel Revenue (USD Million) and Market Share (%) by Type (2023-2030)
10.1.1 Global Offshore Wind Turbine Installation Vessel Revenue (USD Million), and Market Share (%) by Type (2023-2030)
10.2 Global Offshore Wind Turbine Installation Vessel Revenue (USD Million) and Market Share (%) by Applications (2023-2030)
10.2.1 Global Offshore Wind Turbine Installation Vessel Revenue (USD Million), and Market Share (%) by Applications (2023-2030)
11 Global Offshore Wind Turbine Installation Vessel Development Regional Status and Outlook Forecast
11.1 Global Offshore Wind Turbine Installation Vessel Revenue (USD Million) By Regions (2023-2030)
11.2 North America Offshore Wind Turbine Installation Vessel Revenue (USD Million) by Type, and Applications (2023-2030)
11.2.1 North America Offshore Wind Turbine Installation Vessel Revenue (USD) Million by Country (2023-2030)
11.2.2 North America Offshore Wind Turbine Installation Vessel Revenue (USD Million), by Type (2023-2030)
11.2.3 North America Offshore Wind Turbine Installation Vessel Revenue (USD Million), Market Share (%) by Applications (2023-2030)
11.3 Europe Offshore Wind Turbine Installation Vessel Revenue (USD Million), by Type, and Applications (2023-2030)
11.3.1 Europe Offshore Wind Turbine Installation Vessel Revenue (USD Million), by Country (2023-2030)
11.3.2 Europe Offshore Wind Turbine Installation Vessel Revenue (USD Million), by Type (2023-2030)
11.3.3 Europe Offshore Wind Turbine Installation Vessel Revenue (USD Million), by Applications (2023-2030)
11.4 Asia Pacific Offshore Wind Turbine Installation Vessel Revenue (USD Million) by Type, and Applications (2023-2030)
11.4.1 Asia Pacific Offshore Wind Turbine Installation Vessel Revenue (USD Million), by Country (2023-2030)
11.4.2 Asia Pacific Offshore Wind Turbine Installation Vessel Revenue (USD Million), by Type (2023-2030)
11.4.3 Asia Pacific Offshore Wind Turbine Installation Vessel Revenue (USD Million), by Applications (2023-2030)
11.5 South America Offshore Wind Turbine Installation Vessel Revenue (USD Million), by Type, and Applications (2023-2030)
11.5.1 South America Offshore Wind Turbine Installation Vessel Revenue (USD Million), by Country (2023-2030)
11.5.2 South America Offshore Wind Turbine Installation Vessel Revenue (USD Million), by Type (2023-2030)
11.5.3 South America Offshore Wind Turbine Installation Vessel Revenue (USD Million), by Applications (2023-2030)
11.6 Middle East and Africa Offshore Wind Turbine Installation Vessel Revenue (USD Million), by Type, and Applications (2023-2030)
11.6.1 Middle East and Africa Offshore Wind Turbine Installation Vessel Revenue (USD Million), by region (2023-2030)
11.6.2 Middle East and Africa Offshore Wind Turbine Installation Vessel Revenue (USD Million), by Type (2023-2030)
11.6.3 Middle East and Africa Offshore Wind Turbine Installation Vessel Revenue (USD Million), by Applications (2023-2030)
12 Methodology and Data Sources
12.1 Methodology/Research Approach
12.1.1 Research Programs/Design
12.1.2 Market Size Estimation
12.1.3 Market Breakdown and Data Triangulation
12.2 Data Sources
12.2.1 Secondary Sources
12.2.2 Primary Sources
12.3 Disclaimer
List of Tables
Table 1 Market Segmentation Analysis
Table 2 Global Offshore Wind Turbine Installation Vessel Market Companies with Areas Served
Table 3 Products Offerings Global Offshore Wind Turbine Installation Vessel Market
Table 4 Low Growth Scenario Forecasts
Table 5 Reference Case Growth Scenario
Table 6 High Growth Case Scenario
Table 7 Global Offshore Wind Turbine Installation Vessel Revenue (USD Million) And CAGR (%) By Type (2018-2030)
Table 8 Global Offshore Wind Turbine Installation Vessel Revenue (USD Million) And CAGR (%) By Applications (2018-2030)
Table 9 Global Offshore Wind Turbine Installation Vessel Revenue (USD Million) And CAGR (%) By Regions (2018-2030)
Table 10 Global Offshore Wind Turbine Installation Vessel Revenue (USD Million) By Type (2018-2022)
Table 11 Global Offshore Wind Turbine Installation Vessel Revenue Market Share (%) By Type (2018-2022)
Table 12 Global Offshore Wind Turbine Installation Vessel Revenue (USD Million) By Applications (2018-2022)
Table 13 Global Offshore Wind Turbine Installation Vessel Revenue Market Share (%) By Applications (2018-2022)
Table 14 Global Offshore Wind Turbine Installation Vessel Market Revenue (USD Million) By Regions (2018-2022)
Table 15 Global Offshore Wind Turbine Installation Vessel Market Share (%) By Regions (2018-2022)
Table 16 North America Offshore Wind Turbine Installation Vessel Revenue (USD Million) By Country (2018-2022)
Table 17 North America Offshore Wind Turbine Installation Vessel Revenue (USD Million) By Type (2018-2022)
Table 18 North America Offshore Wind Turbine Installation Vessel Revenue (USD Million) By Applications (2018-2022)
Table 19 Europe Offshore Wind Turbine Installation Vessel Revenue (USD Million) By Country (2018-2022)
Table 20 Europe Offshore Wind Turbine Installation Vessel Revenue (USD Million) By Type (2018-2022)
Table 21 Europe Offshore Wind Turbine Installation Vessel Revenue (USD Million) By Applications (2018-2022)
Table 22 Asia Pacific Offshore Wind Turbine Installation Vessel Revenue (USD Million) By Country (2018-2022)
Table 23 Asia Pacific Offshore Wind Turbine Installation Vessel Revenue (USD Million) By Type (2018-2022)
Table 24 Asia Pacific Offshore Wind Turbine Installation Vessel Revenue (USD Million) By Applications (2018-2022)
Table 25 South America Offshore Wind Turbine Installation Vessel Revenue (USD Million) By Country (2018-2022)
Table 26 South America Offshore Wind Turbine Installation Vessel Revenue (USD Million) By Type (2018-2022)
Table 27 South America Offshore Wind Turbine Installation Vessel Revenue (USD Million) By Applications (2018-2022)
Table 28 Middle East and Africa Offshore Wind Turbine Installation Vessel Revenue (USD Million) By Region (2018-2022)
Table 29 Middle East and Africa Offshore Wind Turbine Installation Vessel Revenue (USD Million) By Type (2018-2022)
Table 30 Middle East and Africa Offshore Wind Turbine Installation Vessel Revenue (USD Million) By Applications (2018-2022)
Table 31 Financial Analysis
Table 32 Global Offshore Wind Turbine Installation Vessel Revenue (USD Million) By Type (2023-2030)
Table 33 Global Offshore Wind Turbine Installation Vessel Revenue Market Share (%) By Type (2023-2030)
Table 34 Global Offshore Wind Turbine Installation Vessel Revenue (USD Million) By Applications (2023-2030)
Table 35 Global Offshore Wind Turbine Installation Vessel Revenue Market Share (%) By Applications (2023-2030)
Table 36 Global Offshore Wind Turbine Installation Vessel Market Revenue (USD Million), And Revenue (USD Million) By Regions (2023-2030)
Table 37 North America Offshore Wind Turbine Installation Vessel Revenue (USD)By Country (2023-2030)
Table 38 North America Offshore Wind Turbine Installation Vessel Revenue (USD Million) By Type (2023-2030)
Table 39 North America Offshore Wind Turbine Installation Vessel Revenue (USD Million) By Applications (2023-2030)
Table 40 Europe Offshore Wind Turbine Installation Vessel Revenue (USD Million) By Country (2023-2030)
Table 41 Europe Offshore Wind Turbine Installation Vessel Revenue (USD Million) By Type (2023-2030)
Table 42 Europe Offshore Wind Turbine Installation Vessel Revenue (USD Million) By Applications (2023-2030)
Table 43 Asia Pacific Offshore Wind Turbine Installation Vessel Revenue (USD Million) By Country (2023-2030)
Table 44 Asia Pacific Offshore Wind Turbine Installation Vessel Revenue (USD Million) By Type (2023-2030)
Table 45 Asia Pacific Offshore Wind Turbine Installation Vessel Revenue (USD Million) By Applications (2023-2030)
Table 46 South America Offshore Wind Turbine Installation Vessel Revenue (USD Million) By Country (2023-2030)
Table 47 South America Offshore Wind Turbine Installation Vessel Revenue (USD Million) By Type (2023-2030)
Table 48 South America Offshore Wind Turbine Installation Vessel Revenue (USD Million) By Applications (2023-2030)
Table 49 Middle East and Africa Offshore Wind Turbine Installation Vessel Revenue (USD Million) By Region (2023-2030)
Table 50 Middle East and Africa Offshore Wind Turbine Installation Vessel Revenue (USD Million) By Region (2023-2030)
Table 51 Middle East and Africa Offshore Wind Turbine Installation Vessel Revenue (USD Million) By Type (2023-2030)
Table 52 Middle East and Africa Offshore Wind Turbine Installation Vessel Revenue (USD Million) By Applications (2023-2030)
Table 53 Research Programs/Design for This Report
Table 54 Key Data Information from Secondary Sources
Table 55 Key Data Information from Primary Sources
List of Figures
Figure 1 Market Scope
Figure 2 Porter’s Five Forces
Figure 3 Global Offshore Wind Turbine Installation Vessel Revenue (USD Million) By Type (2018-2022)
Figure 4 Global Offshore Wind Turbine Installation Vessel Revenue Market Share (%) By Type (2022)
Figure 5 Global Offshore Wind Turbine Installation Vessel Revenue (USD Million) By Applications (2018-2022)
Figure 6 Global Offshore Wind Turbine Installation Vessel Revenue Market Share (%) By Applications (2022)
Figure 7 Global Offshore Wind Turbine Installation Vessel Market Revenue (USD Million) By Regions (2018-2022)
Figure 8 Global Offshore Wind Turbine Installation Vessel Market Share (%) By Regions (2022)
Figure 9 North America Offshore Wind Turbine Installation Vessel Revenue (USD Million) By Country (2018-2022)
Figure 10 North America Offshore Wind Turbine Installation Vessel Revenue (USD Million) By Type (2018-2022)
Figure 11 North America Offshore Wind Turbine Installation Vessel Revenue (USD Million) By Applications (2018-2022)
Figure 12 Europe Offshore Wind Turbine Installation Vessel Revenue (USD Million) By Country (2018-2022)
Figure 13 Europe Offshore Wind Turbine Installation Vessel Revenue (USD Million) By Type (2018-2022)
Figure 14 Europe Offshore Wind Turbine Installation Vessel Revenue (USD Million) By Applications (2018-2022)
Figure 15 Asia Pacific Offshore Wind Turbine Installation Vessel Revenue (USD Million) By Country (2018-2022)
Figure 16 Asia Pacific Offshore Wind Turbine Installation Vessel Revenue (USD Million) By Type (2018-2022)
Figure 17 Asia Pacific Offshore Wind Turbine Installation Vessel Revenue (USD Million) By Applications (2018-2022)
Figure 18 South America Offshore Wind Turbine Installation Vessel Revenue (USD Million) By Country (2018-2022)
Figure 19 South America Offshore Wind Turbine Installation Vessel Revenue (USD Million) By Type (2018-2022)
Figure 20 South America Offshore Wind Turbine Installation Vessel Revenue (USD Million) By Applications (2018-2022)
Figure 21 Middle East and Africa Offshore Wind Turbine Installation Vessel Revenue (USD Million) By Region (2018-2022)
Figure 22 Middle East and Africa Offshore Wind Turbine Installation Vessel Revenue (USD Million) By Type (2018-2022)
Figure 23 Middle East and Africa Offshore Wind Turbine Installation Vessel Revenue (USD Million) By Applications (2018-2022)
Figure 24 Global Offshore Wind Turbine Installation Vessel Revenue (USD Million) By Type (2023-2030)
Figure 25 Global Offshore Wind Turbine Installation Vessel Revenue Market Share (%) By Type (2030)
Figure 26 Global Offshore Wind Turbine Installation Vessel Revenue (USD Million) By Applications (2023-2030)
Figure 27 Global Offshore Wind Turbine Installation Vessel Revenue Market Share (%) By Applications (2030)
Figure 28 Global Offshore Wind Turbine Installation Vessel Market Revenue (USD Million) By Regions (2023-2030)
Figure 29 North America Offshore Wind Turbine Installation Vessel Revenue (USD Million) By Country (2023-2030)
Figure 30 North America Offshore Wind Turbine Installation Vessel Revenue (USD Million) By Type (2023-2030)
Figure 31 North America Offshore Wind Turbine Installation Vessel Revenue (USD Million) By Applications (2023-2030)
Figure 32 Europe Offshore Wind Turbine Installation Vessel Revenue (USD Million) By Country (2023-2030)
Figure 33 Europe Offshore Wind Turbine Installation Vessel Revenue (USD Million) By Type (2023-2030)
Figure 34 Europe Offshore Wind Turbine Installation Vessel Revenue (USD Million) By Applications (2023-2030)
Figure 35 Asia Pacific Offshore Wind Turbine Installation Vessel Revenue (USD Million) By Country (2023-2030)
Figure 36 Asia Pacific Offshore Wind Turbine Installation Vessel Revenue (USD Million) By Type (2023-2030)
Figure 37 Asia Pacific Offshore Wind Turbine Installation Vessel Revenue (USD Million) By Applications (2023-2030)
Figure 38 South America Offshore Wind Turbine Installation Vessel Revenue (USD Million) By Country (2023-2030)
Figure 39 South America Offshore Wind Turbine Installation Vessel Revenue (USD Million) By Type (2023-2030)
Figure 40 South America Offshore Wind Turbine Installation Vessel Revenue (USD Million) By Applications (2023-2030)
Figure 41 Middle East and Africa Offshore Wind Turbine Installation Vessel Revenue (USD Million) By Region (2023-2030)
Figure 42 Middle East and Africa Offshore Wind Turbine Installation Vessel Revenue (USD Million) By Region (2023-2030)
Figure 43 Middle East and Africa Offshore Wind Turbine Installation Vessel Revenue (USD Million) By Type (2023-2030)
Figure 44 Middle East and Africa Offshore Wind Turbine Installation Vessel Revenue (USD Million) By Applications (2023-2030)
Figure 45 Bottom-Up and Top-Down Approaches for This Report
Figure 46 Data Triangulation
By Type
By Application
By Region