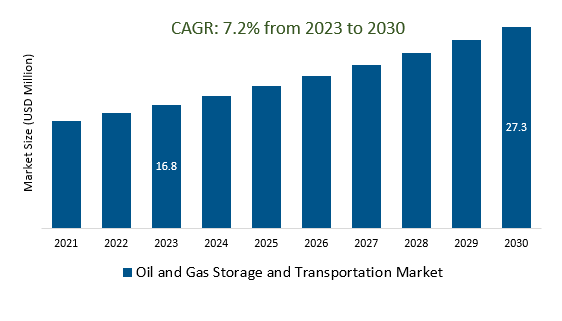
The global Oil and Gas Storage and Transportation Market Size is estimated to be US$ 16.8 Billion in 2023 and is poised to register 7.2% growth over the forecast period from 2023 to 2030 to reach US $ 27.3 billion in 2030.
The rapid growth in demand for oil and gas products coupled with ongoing investments in storage and transportation infrastructure to ensure a reliable supply chain is fueling the market outlook for 2030. In particular, ongoing investments in gas storage terminals, pipelines, and transportation networks to expand capacity, enhance efficiency, and adapt to evolving industry needs are widely observed. Further, the growing consumption of LNG as a cleaner energy source is driving investments in specialized LNG terminals and transportation.
The recent market trends set to shape the future of the Oil and Gas Storage and Transportation industry include the integration of digital technologies, IoT sensors, and automation in storage and transportation operations, Stricter environmental regulations for leak detection systems, emissions reductions, and spill prevention measures, planned launch of FSRUs, repair, and replacement of aging infrastructure, and investments in new technologies and infrastructure.
As the Oil and Gas Storage and Transportation market is navigating through changes driven by technological advancements, environmental concerns, and shifts in energy demand, the report identifies the most prominent drivers, trends, and opportunities for industry stakeholders.
Market Dynamics
Market Trends- Companies are launching Global Energy Demand to attract a consumer base.
Global energy demand is a fundamental driver of the Oil and Gas Storage and Transportation Market. The continuous increase in energy demand, particularly in rapidly growing economies and emerging markets, sustains the need for the storage and transportation of oil and gas products. This demand is driven by factors such as population growth, urbanization, and industrialization. As the world relies heavily on fossil fuels for energy, meeting this demand necessitates a robust infrastructure for storing, transporting, and distributing oil and gas resources, making it a pivotal factor influencing the market's growth and investment prospects.
Market Driver- Security and Safety Concerns Demand for efficient Oil and Gas Storage and Transportation Market
Security and safety concerns play a pivotal role in the Oil and Gas Storage and Transportation Market. These concerns encompass physical threats like terrorism and theft, as well as cybersecurity risks. They can disrupt operations, cause economic and environmental damage, and compromise critical data and control systems. To mitigate these risks, companies are investing significantly in advanced security and surveillance technologies, along with robust cybersecurity measures, to ensure the safety, integrity, and reliability of their oil and gas storage and transportation facilities.
Market Opportunity-Introduction of Technological Advancements
Technological advancements, including IoT, data analytics, automation, and real-time monitoring, are driving efficiency and safety improvements in the Oil and Gas Storage and Transportation Market. These innovations optimize operations, reduce downtime, enhance safety, and enable better environmental performance, underscoring their crucial role in modernizing the industry.
Market Share Analysis- Power Silicon Carbide Wafer Market will register the fastest growth.
The global Silicon Carbide Wafer Market is analyzed across power, Radio Frequency (RF), and others. Of these, power is poised to register the fastest growth.
Market Share Analysis- Automotive and Electric Vehicles (EVs) held a significant market share in 2023.
The global Silicon Carbide Wafer Market is analyzed across a wide range of End users including Automotive and Electric Vehicles (EVs), Telecom and Communications, Energy Storage, Industrial, and others. Of these, Automotive and Electric Vehicles (EVs) held a significant market share in 2023.
Market Segmentation
By Type
- Marine Vessels and Platforms
- Control and Instrumentation
- Pipe Lines
- Oilfield Tools
By Applications
- Crude Oil
- Refined Petroleum Products
- Natural Gas
- Liquefied Natural Gas
- Others
By Service
- Transportation
- Storage
- Floating Production
By Region
- North America (United States, Canada, Mexico)
- Europe (Germany, France, United Kingdom, Spain, Italy, Others)
- Asia Pacific (China, India, Japan, South Korea, Australia, Others)
- Latin America (Brazil, Argentina, Others)
- Middle East and Africa (Saudi Arabia, UAE, Kuwait, Other Middle East, South Africa, Nigeria, Other Africa)
Key Players
Leading companies profiled in the study include-
- GDF SUEZ
- CLH Gaseous Fuel Applications Pvt. Ltd.
- Royal Vopak
- Vitol Group
- Horizon Terminals Limited
- Amec Foster Wheeler
- Magellan Midstream
- WorleyParsons
- Niska Gas Storage
- Buckeye
- Centrica
- Ramboll Group
- DaLian Port
- Kinder Morgan
- Odfjell
- Oiltanking
- CIM-CCMP
- NuStar Energy
* List not exhaustive
Oil and Gas Storage and Transportation Market Outlook 2023
1 Market Overview
1.1 Introduction to the Oil and Gas Storage and Transportation Market
1.2 Scope of the Study
1.3 Research Objective
1.3.1 Key Market Scope and Segments
1.3.2 Players Covered
1.3.3 Years Considered
2 Executive Summary
2.1 2023 Oil and Gas Storage and Transportation Industry- Market Statistics
3 Market Dynamics
3.1 Market Drivers
3.2 Market Challenges
3.3 Market Opportunities
3.4 Market Trends
4 Market Factor Analysis
4.1 Porter’s Five Forces
4.2 Market Entropy
4.2.1 Global Oil and Gas Storage and Transportation Market Companies with Area Served
4.2.2 Products Offerings Global Oil and Gas Storage and Transportation Market
5 COVID-19 Impact Analysis and Outlook Scenarios
5.1.1 Covid-19 Impact Analysis
5.1.2 Post-COVID-19 Scenario- Low Growth Case
5.1.3 Post-COVID-19 Scenario- Reference Growth Case
5.1.4 Post-COVID-19 Scenario- Low Growth Case
6 Global Oil and Gas Storage and Transportation Market Trends
6.1 Global Oil and Gas Storage and Transportation Revenue (USD Million) and CAGR (%) by Type (2018-2030)
6.2 Global Oil and Gas Storage and Transportation Revenue (USD Million) and CAGR (%) by Applications (2018-2030)
6.3 Global Oil and Gas Storage and Transportation Revenue (USD Million) and CAGR (%) by Regions (2018-2030)
7 Global Oil and Gas Storage and Transportation Market Revenue (USD Million) by Type, and Applications (2018-2022)
7.1 Global Oil and Gas Storage and Transportation Revenue (USD Million) by Type (2018-2022)
7.1.1 Global Oil and Gas Storage and Transportation Revenue (USD Million), Market Share (%) by Type (2018-2022)
7.2 Global Oil and Gas Storage and Transportation Revenue (USD Million) by Applications (2018-2022)
7.2.1 Global Oil and Gas Storage and Transportation Revenue (USD Million), Market Share (%) by Applications (2018-2022)
8 Global Oil and Gas Storage and Transportation Development Regional Status and Outlook
8.1 Global Oil and Gas Storage and Transportation Revenue (USD Million) By Regions (2018-2022)
8.2 North America Oil and Gas Storage and Transportation Revenue (USD Million) by Type, and Application (2018-2022)
8.2.1 North America Oil and Gas Storage and Transportation Revenue (USD Million) by Country (2018-2022)
8.2.2 North America Oil and Gas Storage and Transportation Revenue (USD Million) by Type (2018-2022)
8.2.3 North America Oil and Gas Storage and Transportation Revenue (USD Million) by Applications (2018-2022)
8.3 Europe Oil and Gas Storage and Transportation Revenue (USD Million), by Type, and Applications (USD Million) (2018-2022)
8.3.1 Europe Oil and Gas Storage and Transportation Revenue (USD Million), by Country (2018-2022)
8.3.2 Europe Oil and Gas Storage and Transportation Revenue (USD Million) by Type (2018-2022)
8.3.3 Europe Oil and Gas Storage and Transportation Revenue (USD Million) by Applications (2018-2022)
8.4 Asia Pacific Oil and Gas Storage and Transportation Revenue (USD Million), and Revenue (USD Million) by Type, and Applications (2018-2022)
8.4.1 Asia Pacific Oil and Gas Storage and Transportation Revenue (USD Million) by Country (2018-2022)
8.4.2 Asia Pacific Oil and Gas Storage and Transportation Revenue (USD Million) by Type (2018-2022)
8.4.3 Asia Pacific Oil and Gas Storage and Transportation Revenue (USD Million) by Applications (2018-2022)
8.5 South America Oil and Gas Storage and Transportation Revenue (USD Million), by Type, and Applications (2018-2022)
8.5.1 South America Oil and Gas Storage and Transportation Revenue (USD Million), by Country (2018-2022)
8.5.2 South America Oil and Gas Storage and Transportation Revenue (USD Million) by Type (2018-2022)
8.5.3 South America Oil and Gas Storage and Transportation Revenue (USD Million) by Applications (2018-2022)
8.6 Middle East and Africa Oil and Gas Storage and Transportation Revenue (USD Million), by Type, Technology, Application, Thickness (2018-2022)
8.6.1 Middle East and Africa Oil and Gas Storage and Transportation Revenue (USD Million) by Country (2018-2022)
8.6.2 Middle East and Africa Oil and Gas Storage and Transportation Revenue (USD Million) by Type (2018-2022)
8.6.3 Middle East and Africa Oil and Gas Storage and Transportation Revenue (USD Million) by Applications (2018-2022)
9 Company Profiles
10 Global Oil and Gas Storage and Transportation Market Revenue (USD Million), by Type, and Applications (2023-2030)
10.1 Global Oil and Gas Storage and Transportation Revenue (USD Million) and Market Share (%) by Type (2023-2030)
10.1.1 Global Oil and Gas Storage and Transportation Revenue (USD Million), and Market Share (%) by Type (2023-2030)
10.2 Global Oil and Gas Storage and Transportation Revenue (USD Million) and Market Share (%) by Applications (2023-2030)
10.2.1 Global Oil and Gas Storage and Transportation Revenue (USD Million), and Market Share (%) by Applications (2023-2030)
11 Global Oil and Gas Storage and Transportation Development Regional Status and Outlook Forecast
11.1 Global Oil and Gas Storage and Transportation Revenue (USD Million) By Regions (2023-2030)
11.2 North America Oil and Gas Storage and Transportation Revenue (USD Million) by Type, and Applications (2023-2030)
11.2.1 North America Oil and Gas Storage and Transportation Revenue (USD) Million by Country (2023-2030)
11.2.2 North America Oil and Gas Storage and Transportation Revenue (USD Million), by Type (2023-2030)
11.2.3 North America Oil and Gas Storage and Transportation Revenue (USD Million), Market Share (%) by Applications (2023-2030)
11.3 Europe Oil and Gas Storage and Transportation Revenue (USD Million), by Type, and Applications (2023-2030)
11.3.1 Europe Oil and Gas Storage and Transportation Revenue (USD Million), by Country (2023-2030)
11.3.2 Europe Oil and Gas Storage and Transportation Revenue (USD Million), by Type (2023-2030)
11.3.3 Europe Oil and Gas Storage and Transportation Revenue (USD Million), by Applications (2023-2030)
11.4 Asia Pacific Oil and Gas Storage and Transportation Revenue (USD Million) by Type, and Applications (2023-2030)
11.4.1 Asia Pacific Oil and Gas Storage and Transportation Revenue (USD Million), by Country (2023-2030)
11.4.2 Asia Pacific Oil and Gas Storage and Transportation Revenue (USD Million), by Type (2023-2030)
11.4.3 Asia Pacific Oil and Gas Storage and Transportation Revenue (USD Million), by Applications (2023-2030)
11.5 South America Oil and Gas Storage and Transportation Revenue (USD Million), by Type, and Applications (2023-2030)
11.5.1 South America Oil and Gas Storage and Transportation Revenue (USD Million), by Country (2023-2030)
11.5.2 South America Oil and Gas Storage and Transportation Revenue (USD Million), by Type (2023-2030)
11.5.3 South America Oil and Gas Storage and Transportation Revenue (USD Million), by Applications (2023-2030)
11.6 Middle East and Africa Oil and Gas Storage and Transportation Revenue (USD Million), by Type, and Applications (2023-2030)
11.6.1 Middle East and Africa Oil and Gas Storage and Transportation Revenue (USD Million), by Region (2023-2030)
11.6.2 Middle East and Africa Oil and Gas Storage and Transportation Revenue (USD Million), by Type (2023-2030)
11.6.3 Middle East and Africa Oil and Gas Storage and Transportation Revenue (USD Million), by Applications (2023-2030)
12 Methodology and Data Sources
12.1 Methodology/Research Approach
12.1.1 Research Programs/Design
12.1.2 Market Size Estimation
12.1.3 Market Breakdown and Data Triangulation
12.2 Data Sources
12.2.1 Secondary Sources
12.2.2 Primary Sources
12.3 Disclaimer
List of Tables
Table 1 Market Segmentation Analysis
Table 2 Global Oil and Gas Storage and Transportation Market Companies with Areas Served
Table 3 Products Offerings Global Oil and Gas Storage and Transportation Market
Table 4 Low Growth Scenario Forecasts
Table 5 Reference Case Growth Scenario
Table 6 High Growth Case Scenario
Table 7 Global Oil and Gas Storage and Transportation Revenue (USD Million) And CAGR (%) By Type (2018-2030)
Table 8 Global Oil and Gas Storage and Transportation Revenue (USD Million) And CAGR (%) By Applications (2018-2030)
Table 9 Global Oil and Gas Storage and Transportation Revenue (USD Million) And CAGR (%) By Regions (2018-2030)
Table 10 Global Oil and Gas Storage and Transportation Revenue (USD Million) By Type (2018-2022)
Table 11 Global Oil and Gas Storage and Transportation Revenue Market Share (%) By Type (2018-2022)
Table 12 Global Oil and Gas Storage and Transportation Revenue (USD Million) By Applications (2018-2022)
Table 13 Global Oil and Gas Storage and Transportation Revenue Market Share (%) By Applications (2018-2022)
Table 14 Global Oil and Gas Storage and Transportation Market Revenue (USD Million) By Regions (2018-2022)
Table 15 Global Oil and Gas Storage and Transportation Market Share (%) By Regions (2018-2022)
Table 16 North America Oil and Gas Storage and Transportation Revenue (USD Million) By Country (2018-2022)
Table 17 North America Oil and Gas Storage and Transportation Revenue (USD Million) By Type (2018-2022)
Table 18 North America Oil and Gas Storage and Transportation Revenue (USD Million) By Applications (2018-2022)
Table 19 Europe Oil and Gas Storage and Transportation Revenue (USD Million) By Country (2018-2022)
Table 20 Europe Oil and Gas Storage and Transportation Revenue (USD Million) By Type (2018-2022)
Table 21 Europe Oil and Gas Storage and Transportation Revenue (USD Million) By Applications (2018-2022)
Table 22 Asia Pacific Oil and Gas Storage and Transportation Revenue (USD Million) By Country (2018-2022)
Table 23 Asia Pacific Oil and Gas Storage and Transportation Revenue (USD Million) By Type (2018-2022)
Table 24 Asia Pacific Oil and Gas Storage and Transportation Revenue (USD Million) By Applications (2018-2022)
Table 25 South America Oil and Gas Storage and Transportation Revenue (USD Million) By Country (2018-2022)
Table 26 South America Oil and Gas Storage and Transportation Revenue (USD Million) By Type (2018-2022)
Table 27 South America Oil and Gas Storage and Transportation Revenue (USD Million) By Applications (2018-2022)
Table 28 Middle East and Africa Oil and Gas Storage and Transportation Revenue (USD Million) By Region (2018-2022)
Table 29 Middle East and Africa Oil and Gas Storage and Transportation Revenue (USD Million) By Type (2018-2022)
Table 30 Middle East and Africa Oil and Gas Storage and Transportation Revenue (USD Million) By Applications (2018-2022)
Table 31 Financial Analysis
Table 32 Global Oil and Gas Storage and Transportation Revenue (USD Million) By Type (2023-2030)
Table 33 Global Oil and Gas Storage and Transportation Revenue Market Share (%) By Type (2023-2030)
Table 34 Global Oil and Gas Storage and Transportation Revenue (USD Million) By Applications (2023-2030)
Table 35 Global Oil and Gas Storage and Transportation Revenue Market Share (%) By Applications (2023-2030)
Table 36 Global Oil and Gas Storage and Transportation Market Revenue (USD Million), And Revenue (USD Million) By Regions (2023-2030)
Table 37 North America Oil and Gas Storage and Transportation Revenue (USD)By Country (2023-2030)
Table 38 North America Oil and Gas Storage and Transportation Revenue (USD Million) By Type (2023-2030)
Table 39 North America Oil and Gas Storage and Transportation Revenue (USD Million) By Applications (2023-2030)
Table 40 Europe Oil and Gas Storage and Transportation Revenue (USD Million) By Country (2023-2030)
Table 41 Europe Oil and Gas Storage and Transportation Revenue (USD Million) By Type (2023-2030)
Table 42 Europe Oil and Gas Storage and Transportation Revenue (USD Million) By Applications (2023-2030)
Table 43 Asia Pacific Oil and Gas Storage and Transportation Revenue (USD Million) By Country (2023-2030)
Table 44 Asia Pacific Oil and Gas Storage and Transportation Revenue (USD Million) By Type (2023-2030)
Table 45 Asia Pacific Oil and Gas Storage and Transportation Revenue (USD Million) By Applications (2023-2030)
Table 46 South America Oil and Gas Storage and Transportation Revenue (USD Million) By Country (2023-2030)
Table 47 South America Oil and Gas Storage and Transportation Revenue (USD Million) By Type (2023-2030)
Table 48 South America Oil and Gas Storage and Transportation Revenue (USD Million) By Applications (2023-2030)
Table 49 Middle East and Africa Oil and Gas Storage and Transportation Revenue (USD Million) By Region (2023-2030)
Table 50 Middle East and Africa Oil and Gas Storage and Transportation Revenue (USD Million) By Region (2023-2030)
Table 51 Middle East and Africa Oil and Gas Storage and Transportation Revenue (USD Million) By Type (2023-2030)
Table 52 Middle East and Africa Oil and Gas Storage and Transportation Revenue (USD Million) By Applications (2023-2030)
Table 53 Research Programs/Design for This Report
Table 54 Key Data Information from Secondary Sources
Table 55 Key Data Information from Primary Sources
List of Figures
Figure 1 Market Scope
Figure 2 Porter’s Five Forces
Figure 3 Global Oil and Gas Storage and Transportation Revenue (USD Million) By Type (2018-2022)
Figure 4 Global Oil and Gas Storage and Transportation Revenue Market Share (%) By Type (2022)
Figure 5 Global Oil and Gas Storage and Transportation Revenue (USD Million) By Applications (2018-2022)
Figure 6 Global Oil and Gas Storage and Transportation Revenue Market Share (%) By Applications (2022)
Figure 7 Global Oil and Gas Storage and Transportation Market Revenue (USD Million) By Regions (2018-2022)
Figure 8 Global Oil and Gas Storage and Transportation Market Share (%) By Regions (2022)
Figure 9 North America Oil and Gas Storage and Transportation Revenue (USD Million) By Country (2018-2022)
Figure 10 North America Oil and Gas Storage and Transportation Revenue (USD Million) By Type (2018-2022)
Figure 11 North America Oil and Gas Storage and Transportation Revenue (USD Million) By Applications (2018-2022)
Figure 12 Europe Oil and Gas Storage and Transportation Revenue (USD Million) By Country (2018-2022)
Figure 13 Europe Oil and Gas Storage and Transportation Revenue (USD Million) By Type (2018-2022)
Figure 14 Europe Oil and Gas Storage and Transportation Revenue (USD Million) By Applications (2018-2022)
Figure 15 Asia Pacific Oil and Gas Storage and Transportation Revenue (USD Million) By Country (2018-2022)
Figure 16 Asia Pacific Oil and Gas Storage and Transportation Revenue (USD Million) By Type (2018-2022)
Figure 17 Asia Pacific Oil and Gas Storage and Transportation Revenue (USD Million) By Applications (2018-2022)
Figure 18 South America Oil and Gas Storage and Transportation Revenue (USD Million) By Country (2018-2022)
Figure 19 South America Oil and Gas Storage and Transportation Revenue (USD Million) By Type (2018-2022)
Figure 20 South America Oil and Gas Storage and Transportation Revenue (USD Million) By Applications (2018-2022)
Figure 21 Middle East and Africa Oil and Gas Storage and Transportation Revenue (USD Million) By Region (2018-2022)
Figure 22 Middle East and Africa Oil and Gas Storage and Transportation Revenue (USD Million) By Type (2018-2022)
Figure 23 Middle East and Africa Oil and Gas Storage and Transportation Revenue (USD Million) By Applications (2018-2022)
Figure 24 Global Oil and Gas Storage and Transportation Revenue (USD Million) By Type (2023-2030)
Figure 25 Global Oil and Gas Storage and Transportation Revenue Market Share (%) By Type (2030)
Figure 26 Global Oil and Gas Storage and Transportation Revenue (USD Million) By Applications (2023-2030)
Figure 27 Global Oil and Gas Storage and Transportation Revenue Market Share (%) By Applications (2030)
Figure 28 Global Oil and Gas Storage and Transportation Market Revenue (USD Million) By Regions (2023-2030)
Figure 29 North America Oil and Gas Storage and Transportation Revenue (USD Million) By Country (2023-2030)
Figure 30 North America Oil and Gas Storage and Transportation Revenue (USD Million) By Type (2023-2030)
Figure 31 North America Oil and Gas Storage and Transportation Revenue (USD Million) By Applications (2023-2030)
Figure 32 Europe Oil and Gas Storage and Transportation Revenue (USD Million) By Country (2023-2030)
Figure 33 Europe Oil and Gas Storage and Transportation Revenue (USD Million) By Type (2023-2030)
Figure 34 Europe Oil and Gas Storage and Transportation Revenue (USD Million) By Applications (2023-2030)
Figure 35 Asia Pacific Oil and Gas Storage and Transportation Revenue (USD Million) By Country (2023-2030)
Figure 36 Asia Pacific Oil and Gas Storage and Transportation Revenue (USD Million) By Type (2023-2030)
Figure 37 Asia Pacific Oil and Gas Storage and Transportation Revenue (USD Million) By Applications (2023-2030)
Figure 38 South America Oil and Gas Storage and Transportation Revenue (USD Million) By Country (2023-2030)
Figure 39 South America Oil and Gas Storage and Transportation Revenue (USD Million) By Type (2023-2030)
Figure 40 South America Oil and Gas Storage and Transportation Revenue (USD Million) By Applications (2023-2030)
Figure 41 Middle East and Africa Oil and Gas Storage and Transportation Revenue (USD Million) By Region (2023-2030)
Figure 42 Middle East and Africa Oil and Gas Storage and Transportation Revenue (USD Million) By Region (2023-2030)
Figure 43 Middle East and Africa Oil and Gas Storage and Transportation Revenue (USD Million) By Type (2023-2030)
Figure 44 Middle East and Africa Oil and Gas Storage and Transportation Revenue (USD Million) By Applications (2023-2030)
Figure 45 Bottom-Up and Top-Down Approaches For This Report
Figure 46 Data Triangulation
