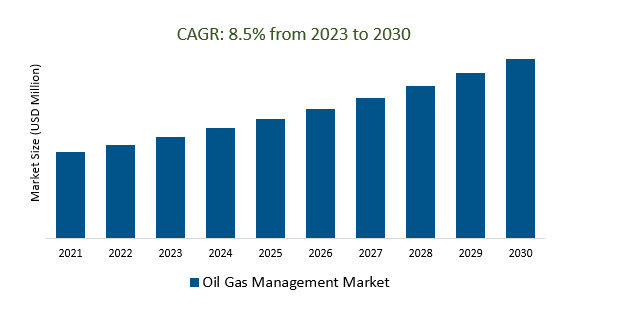
The Global Oil Gas Management Market Size is estimated to register 8.5% growth over the forecast period from 2023 to 2030.
Rising environmental regulations and a heightened focus on carbon emissions reduction are key drivers of market growth in the Oil Gas Management Market, propelling the adoption of cleaner technologies and practices within the industry. Leading Companies focusing on Energy Transition Strategies, Digital Transformation and IoT Integration, Environmental Compliance, and Emissions Reduction, Energy Security and Supply Chain Resilience, Market Volatility and Price Trends, Geopolitical Challenges and Global Relations, and others to boost market shares in the industry.
Market Overview
The Oil Gas Management Market is undergoing significant transformation, with a focus on digital technology adoption for operational efficiency, compliance with environmental regulations, and the ongoing influence of geopolitical factors. Companies increasingly integrate IoT and data analytics to streamline processes and reduce costs. Environmental concerns are pushing the industry toward cleaner practices, including carbon capture and storage. Geopolitical factors continue to affect supply chain resilience and market stability. The industry is navigating the shift towards sustainability while balancing traditional hydrocarbon production with cleaner energy alternatives.
Market Dynamics
Market Trends- Geopolitical tensions and conflicts can disrupt the flow of oil and gas, leading to higher prices and shortages.
The impact of global conflicts and geopolitical tensions on the oil and gas industry is significant. Disruptions in key producing regions can lead to increased energy costs, supply deficits, and market instability. This underscores the industry's susceptibility to international political events, emphasizing the importance of strong risk management and contingency planning. These geopolitical factors continue to influence the strategies and decision-making of oil and gas firms, emphasizing the necessity for supply chain diversification and security measures to counter potential disruptions.
Market Driver- The growing demand for oil and gas infrastructure is driving the growth of the oil and gas management market.
The Oil Gas Management Market is experiencing significant growth due to the increasing demand for oil and gas infrastructure, driven by the global need for energy resources. This growth entails investments in pipelines, storage facilities, and transportation networks, which are increasingly managed with advanced technologies. The market's trajectory is closely linked to the growing demand for reliable and efficient infrastructure to meet global energy needs and address sustainability concerns.
Market Opportunity- The energy transition is reshaping the oil and gas management market, creating new opportunities for companies to develop and implement innovative solutions to reduce emissions and improve efficiency.
The oil and gas management market is undergoing a transformation driven by the energy transition, with a focus on innovative solutions to reduce emissions and improve operational efficiency. The industry will place greater emphasis on cleaner technologies, sustainability practices, carbon capture, and digital tools for operational optimization, leading to improved environmental performance and adaptability to evolving energy dynamics.
Market Share Analysis- Residual Risk Management Oil Gas Management Market will register the fastest growth
The Global Oil Gas Management Market is analyzed across Initial Risk Management, Residual Risk Management, and others. Residual Risk Management is poised to register the fastest growth. Residual Risk Management in the Oil Gas Management Market is a crucial process involving the identification and mitigation of risks that persist after initial risk management measures. These residual risks encompass geopolitical, environmental, market, and safety challenges. The industry must employ continuous monitoring and adaptation to minimize the impact of these remaining risks on operations and ensure long-term sustainability.
Market Share Analysis- Gas held a significant market share in 2023
The Global Oil Gas Management Market is analyzed across various applications including Oil, Gas, and others. Of these, Gas held a significant market share in 2023. The oil and gas management market for gas is expected to grow significantly in the coming years, driven by the increasing demand for gas and the growing complexity of gas operations. Oil and gas management companies are developing a range of innovative solutions to meet the needs of the gas industry, including data-driven decision support systems, artificial intelligence (AI) and machine learning (ML) solutions, and digital twin technology.
Oil Gas Management Market News
LyondellBasell Unveils Fresh Brand Identity by its Revised Company Strategy: LyondellBasell (NYSE: LYB), a prominent player in the chemical industry, has introduced a new brand identity that reflects its commitment to 'creating solutions for everyday sustainable living.' The updated brand encompasses a new logo, tagline, and visual identity, aligning with the company's revised strategy introduced in early 2023.
Imperial Oil Limited (TSE: IMO, NYSE American: IMO) has disclosed its intention to initiate a significant issuer bid, targeting a buyback of up to $1,500,000,000 worth of its common shares ('Shares'). This move comes following the Board of Directors' approval, based on the recommendation of an independent directors' special committee.
Oil Gas Management Market Segmentation
By Type
· Initial Risk Management
· Residual Risk Management
By Application
· Oil
· Gas
By Region
- North America (United States, Canada, Mexico)
- Europe (Germany, France, United Kingdom, Spain, Italy, Others)
- Asia Pacific (China, India, Japan, South Korea, Australia, Others)
- Latin America (Brazil, Argentina, Others)
- Middle East and Africa (Saudi Arabia, UAE, Kuwait, Other Middle East, South Africa, Nigeria, Other Africa)
Oil Gas Management Market Companies
- Royal Dutch Shell (United Kingdom)
- Eni S.p.A (Italy)
- BP plc (United Kingdom)
- TotalEnergies (France)
- Equinor ASA (Norway)
- Repsol S.A. (Spain)
- OMV Group (Austria)
- CNOOC Limited (China)
- ExxonMobil Corporation (United States)
- Chevron Corporation (United States)
- PetroChina Company Limited (China)
- Sinopec (China)
- Indian Oil Corporation (India)
- Gazprom (Russia)
*List not exhaustive
Oil Gas Management Market Outlook 2023
1 Market Overview
1.1 Introduction to the Oil Gas Management Market
1.2 Scope of the Study
1.3 Research Objective
1.3.1 Key Market Scope and Segments
1.3.2 Players Covered
1.3.3 Years Considered
2 Executive Summary
2.1 2023 Oil Gas Management Industry- Market Statistics
3 Market Dynamics
3.1 Market Drivers
3.2 Market Challenges
3.3 Market Opportunities
3.4 Market Trends
4 Market Factor Analysis
4.1 Porter’s Five Forces
4.2 Market Entropy
4.2.1 Global Oil Gas Management Market Companies with Area Served
4.2.2 Products Offerings Global Oil Gas Management Market
5 COVID-19 Impact Analysis and Outlook Scenarios
5.1.1 Covid-19 Impact Analysis
5.1.2 post-COVID-19 Scenario- Low Growth Case
5.1.3 post-COVID-19 Scenario- Reference Growth Case
5.1.4 post-COVID-19 Scenario- Low Growth Case
6 Global Oil Gas Management Market Trends
6.1 Global Oil Gas Management Revenue (USD Million) and CAGR (%) by Type (2018-2030)
6.2 Global Oil Gas Management Revenue (USD Million) and CAGR (%) by Applications (2018-2030)
6.3 Global Oil Gas Management Revenue (USD Million) and CAGR (%) by regions (2018-2030)
7 Global Oil Gas Management Market Revenue (USD Million) by Type, and Applications (2018-2022)
7.1 Global Oil Gas Management Revenue (USD Million) by Type (2018-2022)
7.1.1 Global Oil Gas Management Revenue (USD Million), Market Share (%) by Type (2018-2022)
7.2 Global Oil Gas Management Revenue (USD Million) by Applications (2018-2022)
7.2.1 Global Oil Gas Management Revenue (USD Million), Market Share (%) by Applications (2018-2022)
8 Global Oil Gas Management Development Regional Status and Outlook
8.1 Global Oil Gas Management Revenue (USD Million) By Regions (2018-2022)
8.2 North America Oil Gas Management Revenue (USD Million) by Type, and Application (2018-2022)
8.2.1 North America Oil Gas Management Revenue (USD Million) by Country (2018-2022)
8.2.2 North America Oil Gas Management Revenue (USD Million) by Type (2018-2022)
8.2.3 North America Oil Gas Management Revenue (USD Million) by Applications (2018-2022)
8.3 Europe Oil Gas Management Revenue (USD Million), by Type, and Applications (USD Million) (2018-2022)
8.3.1 Europe Oil Gas Management Revenue (USD Million), by Country (2018-2022)
8.3.2 Europe Oil Gas Management Revenue (USD Million) by Type (2018-2022)
8.3.3 Europe Oil Gas Management Revenue (USD Million) by Applications (2018-2022)
8.4 Asia Pacific Oil Gas Management Revenue (USD Million), and Revenue (USD Million) by Type, and Applications (2018-2022)
8.4.1 Asia Pacific Oil Gas Management Revenue (USD Million) by Country (2018-2022)
8.4.2 Asia Pacific Oil Gas Management Revenue (USD Million) by Type (2018-2022)
8.4.3 Asia Pacific Oil Gas Management Revenue (USD Million) by Applications (2018-2022)
8.5 South America Oil Gas Management Revenue (USD Million), by Type, and Applications (2018-2022)
8.5.1 South America Oil Gas Management Revenue (USD Million), by Country (2018-2022)
8.5.2 South America Oil Gas Management Revenue (USD Million) by Type (2018-2022)
8.5.3 South America Oil Gas Management Revenue (USD Million) by Applications (2018-2022)
8.6 Middle East and Africa Oil Gas Management Revenue (USD Million), by Type, Technology, Application, Thickness (2018-2022)
8.6.1 Middle East and Africa Oil Gas Management Revenue (USD Million) by Country (2018-2022)
8.6.2 Middle East and Africa Oil Gas Management Revenue (USD Million) by Type (2018-2022)
8.6.3 Middle East and Africa Oil Gas Management Revenue (USD Million) by Applications (2018-2022)
9 Company Profiles
10 Global Oil Gas Management Market Revenue (USD Million), by Type, and Applications (2023-2030)
10.1 Global Oil Gas Management Revenue (USD Million) and Market Share (%) by Type (2023-2030)
10.1.1 Global Oil Gas Management Revenue (USD Million), and Market Share (%) by Type (2023-2030)
10.2 Global Oil Gas Management Revenue (USD Million) and Market Share (%) by Applications (2023-2030)
10.2.1 Global Oil Gas Management Revenue (USD Million), and Market Share (%) by Applications (2023-2030)
11 Global Oil Gas Management Development Regional Status and Outlook Forecast
11.1 Global Oil Gas Management Revenue (USD Million) By Regions (2023-2030)
11.2 North America Oil Gas Management Revenue (USD Million) by Type, and Applications (2023-2030)
11.2.1 North America Oil Gas Management Revenue (USD) Million by Country (2023-2030)
11.2.2 North America Oil Gas Management Revenue (USD Million), by Type (2023-2030)
11.2.3 North America Oil Gas Management Revenue (USD Million), Market Share (%) by Applications (2023-2030)
11.3 Europe Oil Gas Management Revenue (USD Million), by Type, and Applications (2023-2030)
11.3.1 Europe Oil Gas Management Revenue (USD Million), by Country (2023-2030)
11.3.2 Europe Oil Gas Management Revenue (USD Million), by Type (2023-2030)
11.3.3 Europe Oil Gas Management Revenue (USD Million), by Applications (2023-2030)
11.4 Asia Pacific Oil Gas Management Revenue (USD Million) by Type, and Applications (2023-2030)
11.4.1 Asia Pacific Oil Gas Management Revenue (USD Million), by Country (2023-2030)
11.4.2 Asia Pacific Oil Gas Management Revenue (USD Million), by Type (2023-2030)
11.4.3 Asia Pacific Oil Gas Management Revenue (USD Million), by Applications (2023-2030)
11.5 South America Oil Gas Management Revenue (USD Million), by Type, and Applications (2023-2030)
11.5.1 South America Oil Gas Management Revenue (USD Million), by Country (2023-2030)
11.5.2 South America Oil Gas Management Revenue (USD Million), by Type (2023-2030)
11.5.3 South America Oil Gas Management Revenue (USD Million), by Applications (2023-2030)
11.6 Middle East and Africa Oil Gas Management Revenue (USD Million), by Type, and Applications (2023-2030)
11.6.1 Middle East and Africa Oil Gas Management Revenue (USD Million), by region (2023-2030)
11.6.2 Middle East and Africa Oil Gas Management Revenue (USD Million), by Type (2023-2030)
11.6.3 Middle East and Africa Oil Gas Management Revenue (USD Million), by Applications (2023-2030)
12 Methodology and Data Sources
12.1 Methodology/Research Approach
12.1.1 Research Programs/Design
12.1.2 Market Size Estimation
12.1.3 Market Breakdown and Data Triangulation
12.2 Data Sources
12.2.1 Secondary Sources
12.2.2 Primary Sources
12.3 Disclaimer
List of Tables
Table 1 Market Segmentation Analysis
Table 2 Global Oil Gas Management Market Companies with Areas Served
Table 3 Products Offerings Global Oil Gas Management Market
Table 4 Low Growth Scenario Forecasts
Table 5 Reference Case Growth Scenario
Table 6 High Growth Case Scenario
Table 7 Global Oil Gas Management Revenue (USD Million) And CAGR (%) By Type (2018-2030)
Table 8 Global Oil Gas Management Revenue (USD Million) And CAGR (%) By Applications (2018-2030)
Table 9 Global Oil Gas Management Revenue (USD Million) And CAGR (%) By Regions (2018-2030)
Table 10 Global Oil Gas Management Revenue (USD Million) By Type (2018-2022)
Table 11 Global Oil Gas Management Revenue Market Share (%) By Type (2018-2022)
Table 12 Global Oil Gas Management Revenue (USD Million) By Applications (2018-2022)
Table 13 Global Oil Gas Management Revenue Market Share (%) By Applications (2018-2022)
Table 14 Global Oil Gas Management Market Revenue (USD Million) By Regions (2018-2022)
Table 15 Global Oil Gas Management Market Share (%) By Regions (2018-2022)
Table 16 North America Oil Gas Management Revenue (USD Million) By Country (2018-2022)
Table 17 North America Oil Gas Management Revenue (USD Million) By Type (2018-2022)
Table 18 North America Oil Gas Management Revenue (USD Million) By Applications (2018-2022)
Table 19 Europe Oil Gas Management Revenue (USD Million) By Country (2018-2022)
Table 20 Europe Oil Gas Management Revenue (USD Million) By Type (2018-2022)
Table 21 Europe Oil Gas Management Revenue (USD Million) By Applications (2018-2022)
Table 22 Asia Pacific Oil Gas Management Revenue (USD Million) By Country (2018-2022)
Table 23 Asia Pacific Oil Gas Management Revenue (USD Million) By Type (2018-2022)
Table 24 Asia Pacific Oil Gas Management Revenue (USD Million) By Applications (2018-2022)
Table 25 South America Oil Gas Management Revenue (USD Million) By Country (2018-2022)
Table 26 South America Oil Gas Management Revenue (USD Million) By Type (2018-2022)
Table 27 South America Oil Gas Management Revenue (USD Million) By Applications (2018-2022)
Table 28 Middle East and Africa Oil Gas Management Revenue (USD Million) By Region (2018-2022)
Table 29 Middle East and Africa Oil Gas Management Revenue (USD Million) By Type (2018-2022)
Table 30 Middle East and Africa Oil Gas Management Revenue (USD Million) By Applications (2018-2022)
Table 31 Financial Analysis
Table 32 Global Oil Gas Management Revenue (USD Million) By Type (2023-2030)
Table 33 Global Oil Gas Management Revenue Market Share (%) By Type (2023-2030)
Table 34 Global Oil Gas Management Revenue (USD Million) By Applications (2023-2030)
Table 35 Global Oil Gas Management Revenue Market Share (%) By Applications (2023-2030)
Table 36 Global Oil Gas Management Market Revenue (USD Million), And Revenue (USD Million) By Regions (2023-2030)
Table 37 North America Oil Gas Management Revenue (USD)By Country (2023-2030)
Table 38 North America Oil Gas Management Revenue (USD Million) By Type (2023-2030)
Table 39 North America Oil Gas Management Revenue (USD Million) By Applications (2023-2030)
Table 40 Europe Oil Gas Management Revenue (USD Million) By Country (2023-2030)
Table 41 Europe Oil Gas Management Revenue (USD Million) By Type (2023-2030)
Table 42 Europe Oil Gas Management Revenue (USD Million) By Applications (2023-2030)
Table 43 Asia Pacific Oil Gas Management Revenue (USD Million) By Country (2023-2030)
Table 44 Asia Pacific Oil Gas Management Revenue (USD Million) By Type (2023-2030)
Table 45 Asia Pacific Oil Gas Management Revenue (USD Million) By Applications (2023-2030)
Table 46 South America Oil Gas Management Revenue (USD Million) By Country (2023-2030)
Table 47 South America Oil Gas Management Revenue (USD Million) By Type (2023-2030)
Table 48 South America Oil Gas Management Revenue (USD Million) By Applications (2023-2030)
Table 49 Middle East and Africa Oil Gas Management Revenue (USD Million) By Region (2023-2030)
Table 50 Middle East and Africa Oil Gas Management Revenue (USD Million) By Region (2023-2030)
Table 51 Middle East and Africa Oil Gas Management Revenue (USD Million) By Type (2023-2030)
Table 52 Middle East and Africa Oil Gas Management Revenue (USD Million) By Applications (2023-2030)
Table 53 Research Programs/Design for This Report
Table 54 Key Data Information from Secondary Sources
Table 55 Key Data Information from Primary Sources
List of Figures
Figure 1 Market Scope
Figure 2 Porter’s Five Forces
Figure 3 Global Oil Gas Management Revenue (USD Million) By Type (2018-2022)
Figure 4 Global Oil Gas Management Revenue Market Share (%) By Type (2022)
Figure 5 Global Oil Gas Management Revenue (USD Million) By Applications (2018-2022)
Figure 6 Global Oil Gas Management Revenue Market Share (%) By Applications (2022)
Figure 7 Global Oil Gas Management Market Revenue (USD Million) By Regions (2018-2022)
Figure 8 Global Oil Gas Management Market Share (%) By Regions (2022)
Figure 9 North America Oil Gas Management Revenue (USD Million) By Country (2018-2022)
Figure 10 North America Oil Gas Management Revenue (USD Million) By Type (2018-2022)
Figure 11 North America Oil Gas Management Revenue (USD Million) By Applications (2018-2022)
Figure 12 Europe Oil Gas Management Revenue (USD Million) By Country (2018-2022)
Figure 13 Europe Oil Gas Management Revenue (USD Million) By Type (2018-2022)
Figure 14 Europe Oil Gas Management Revenue (USD Million) By Applications (2018-2022)
Figure 15 Asia Pacific Oil Gas Management Revenue (USD Million) By Country (2018-2022)
Figure 16 Asia Pacific Oil Gas Management Revenue (USD Million) By Type (2018-2022)
Figure 17 Asia Pacific Oil Gas Management Revenue (USD Million) By Applications (2018-2022)
Figure 18 South America Oil Gas Management Revenue (USD Million) By Country (2018-2022)
Figure 19 South America Oil Gas Management Revenue (USD Million) By Type (2018-2022)
Figure 20 South America Oil Gas Management Revenue (USD Million) By Applications (2018-2022)
Figure 21 Middle East and Africa Oil Gas Management Revenue (USD Million) By Region (2018-2022)
Figure 22 Middle East and Africa Oil Gas Management Revenue (USD Million) By Type (2018-2022)
Figure 23 Middle East and Africa Oil Gas Management Revenue (USD Million) By Applications (2018-2022)
Figure 24 Global Oil Gas Management Revenue (USD Million) By Type (2023-2030)
Figure 25 Global Oil Gas Management Revenue Market Share (%) By Type (2030)
Figure 26 Global Oil Gas Management Revenue (USD Million) By Applications (2023-2030)
Figure 27 Global Oil Gas Management Revenue Market Share (%) By Applications (2030)
Figure 28 Global Oil Gas Management Market Revenue (USD Million) By Regions (2023-2030)
Figure 29 North America Oil Gas Management Revenue (USD Million) By Country (2023-2030)
Figure 30 North America Oil Gas Management Revenue (USD Million) By Type (2023-2030)
Figure 31 North America Oil Gas Management Revenue (USD Million) By Applications (2023-2030)
Figure 32 Europe Oil Gas Management Revenue (USD Million) By Country (2023-2030)
Figure 33 Europe Oil Gas Management Revenue (USD Million) By Type (2023-2030)
Figure 34 Europe Oil Gas Management Revenue (USD Million) By Applications (2023-2030)
Figure 35 Asia Pacific Oil Gas Management Revenue (USD Million) By Country (2023-2030)
Figure 36 Asia Pacific Oil Gas Management Revenue (USD Million) By Type (2023-2030)
Figure 37 Asia Pacific Oil Gas Management Revenue (USD Million) By Applications (2023-2030)
Figure 38 South America Oil Gas Management Revenue (USD Million) By Country (2023-2030)
Figure 39 South America Oil Gas Management Revenue (USD Million) By Type (2023-2030)
Figure 40 South America Oil Gas Management Revenue (USD Million) By Applications (2023-2030)
Figure 41 Middle East and Africa Oil Gas Management Revenue (USD Million) By Region (2023-2030)
Figure 42 Middle East and Africa Oil Gas Management Revenue (USD Million) By Region (2023-2030)
Figure 43 Middle East and Africa Oil Gas Management Revenue (USD Million) By Type (2023-2030)
Figure 44 Middle East and Africa Oil Gas Management Revenue (USD Million) By Applications (2023-2030)
Figure 45 Bottom-Up and Top-Down Approaches for This Report
Figure 46 Data Triangulation
