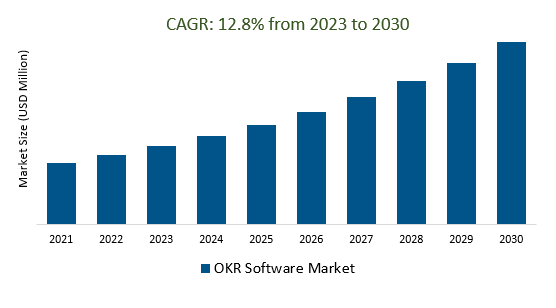
The Global OKR Software Market Size is estimated to register 12.8% growth over the forecast period from 2023 to 2030.
The market growth is driven by the increasing OKR software market was becoming increasingly competitive, with new entrants and established players offering a wide range of features and pricing options. Leading companies that are focusing on Market Expansion, Integration with Other Tools, Enhanced User Experience, Customization and Flexibility, Industry-Specific Solutions, Globalization and Localization, Education, and Training, and others to boost market shares in the industry.
Market Overview
The OKR (Objectives and Key Results) software market was experiencing substantial growth, driven by increased adoption across various industries. Key players included both specialized OKR-focused companies and larger enterprise software vendors. OKR software offerings featured goal setting, tracking, analytics, and integration capabilities, aiding organizations in aligning teams with their strategic objectives. The market was marked by user-friendly interfaces, customization options, and a shift towards remote work support. Advanced analytics, AI integration, and data security were also notable trends, while training and education were emphasized for effective OKR implementation. The market remained competitive, with a focus on innovation and industry-specific features.
Market Dynamics
Market Trends - Data Analytics and AI Driving the Next Generation of OKR Software
Data analytics and AI are driving the evolution of the OKR (Objectives and Key Results) software market, offering advanced insights, predictive capabilities, and intelligent goal recommendations. These technologies enhance decision-making, goal effectiveness, and strategic alignment within organizations, ushering in the next generation of OKR software.
Market Driver- Data Security and Privacy Demand OKR Software Market
Data security and privacy have become critical considerations in the OKR (Objectives and Key Results) software market as organizations prioritize safeguarding sensitive data and adhering to privacy regulations. OKR software providers are enhancing their security measures to meet these demands while still enabling effective goal alignment and performance management.
Market Opportunity-Introduction of SaaS and Cloud Deployment
SaaS and cloud deployment models dominate the OKR (Objectives and Key Results) software market, offering scalability, accessibility, and cost-efficiency. These solutions enable remote access, collaboration, and reduced infrastructure requirements, reflecting the growing preference for cloud-based OKR software.
Market Share Analysis- Cloud OKR Software Market will register the fastest growth
The Global OKR Software Market is analyzed across Cloud, On-Premise, and others. Of these, Cloud is poised to register the fastest growth. Cloud-based solutions are a prevailing choice in the OKR (Objectives and Key Results) software market, offering scalability, accessibility, and cost-effectiveness. These cloud-deployed OKR software solutions facilitate remote access, collaboration, and data management, aligning with the ongoing shift toward cloud computing in the software landscape.
Market Share Analysis- BFSI held a significant market share in 2023
The Global OKR Software Market is analyzed across a wide range of end users including BFSI, E-Commerce and Retail, Healthcare, IT and Telecom, and others. Of these, BFSI held a significant market share in 2023. The BFSI (Banking, Financial Services, and Insurance) sector presents a significant opportunity for the OKR (Objectives and Key Results) software market, as it enables strategic alignment, goal monitoring, and agility in areas like financial products, risk management, and compliance. The BFSI industry's focus on efficiency, customer experience, and regulatory adherence is expected to drive increased adoption of OKR software tailored to its unique requirements.
OKR Software Market Segmentation
By Deployment Type
By End-user
- BFSI
- E-Commerce and Retail
- Healthcare
- IT and Telecom
- Others
By Organization Size
- Small and Medium Enterprises
- Large Enterprises
By Region
- North America (United States, Canada, Mexico)
- Europe (Germany, France, United Kingdom, Spain, Italy, Others)
- Asia Pacific (China, India, Japan, South Korea, Australia, Others)
- Latin America (Brazil, Argentina, Others)
- Middle East and Africa (Saudi Arabia, UAE, Kuwait, Other Middle East, South Africa, Nigeria, Other Africa)
OKR Software Market Companies
- Google LLC (United States)
- Koan Inc (United States)
- Workboard Inc (United States)
- Perdoo GmbH (Germany)
- People Goal Ltd (United Kingdom)
- BetterWorks Systems Inc (United States)
- xto10x Technologies (India)
- Profit.co (United States)
- Culture Amp (United States)
- Inspire Software (United States)
- People box (India)
- Leap some (Germany)
- Lattice (United States)
- Perform Yard (United States)
- Kalidas Inc. (United States)
*List not exhaustive
OKR Software Market Outlook 2023
1 Market Overview
1.1 Introduction to the OKR Software Market
1.2 Scope of the Study
1.3 Research Objective
1.3.1 Key Market Scope and Segments
1.3.2 Players Covered
1.3.3 Years Considered
2 Executive Summary
2.1 2023 OKR Software Industry- Market Statistics
3 Market Dynamics
3.1 Market Drivers
3.2 Market Challenges
3.3 Market Opportunities
3.4 Market Trends
4 Market Factor Analysis
4.1 Porter’s Five Forces
4.2 Market Entropy
4.2.1 Global OKR Software Market Companies with Area Served
4.2.2 Products Offerings Global OKR Software Market
5 COVID-19 Impact Analysis and Outlook Scenarios
5.1.1 Covid-19 Impact Analysis
5.1.2 post-COVID-19 Scenario- Low Growth Case
5.1.3 post-COVID-19 Scenario- Reference Growth Case
5.1.4 post-COVID-19 Scenario- Low Growth Case
6 Global OKR Software Market Trends
6.1 Global OKR Software Revenue (USD Million) and CAGR (%) by Type (2018-2030)
6.2 Global OKR Software Revenue (USD Million) and CAGR (%) by Applications (2018-2030)
6.3 Global OKR Software Revenue (USD Million) and CAGR (%) by regions (2018-2030)
7 Global OKR Software Market Revenue (USD Million) by Type, and Applications (2018-2022)
7.1 Global OKR Software Revenue (USD Million) by Type (2018-2022)
7.1.1 Global OKR Software Revenue (USD Million), Market Share (%) by Type (2018-2022)
7.2 Global OKR Software Revenue (USD Million) by Applications (2018-2022)
7.2.1 Global OKR Software Revenue (USD Million), Market Share (%) by Applications (2018-2022)
8 Global OKR Software Development Regional Status and Outlook
8.1 Global OKR Software Revenue (USD Million) By Regions (2018-2022)
8.2 North America OKR Software Revenue (USD Million) by Type, and Application (2018-2022)
8.2.1 North America OKR Software Revenue (USD Million) by Country (2018-2022)
8.2.2 North America OKR Software Revenue (USD Million) by Type (2018-2022)
8.2.3 North America OKR Software Revenue (USD Million) by Applications (2018-2022)
8.3 Europe OKR Software Revenue (USD Million), by Type, and Applications (USD Million) (2018-2022)
8.3.1 Europe OKR Software Revenue (USD Million), by Country (2018-2022)
8.3.2 Europe OKR Software Revenue (USD Million) by Type (2018-2022)
8.3.3 Europe OKR Software Revenue (USD Million) by Applications (2018-2022)
8.4 Asia Pacific OKR Software Revenue (USD Million), and Revenue (USD Million) by Type, and Applications (2018-2022)
8.4.1 Asia Pacific OKR Software Revenue (USD Million) by Country (2018-2022)
8.4.2 Asia Pacific OKR Software Revenue (USD Million) by Type (2018-2022)
8.4.3 Asia Pacific OKR Software Revenue (USD Million) by Applications (2018-2022)
8.5 South America OKR Software Revenue (USD Million), by Type, and Applications (2018-2022)
8.5.1 South America OKR Software Revenue (USD Million), by Country (2018-2022)
8.5.2 South America OKR Software Revenue (USD Million) by Type (2018-2022)
8.5.3 South America OKR Software Revenue (USD Million) by Applications (2018-2022)
8.6 Middle East and Africa OKR Software Revenue (USD Million), by Type, Technology, Application, Thickness (2018-2022)
8.6.1 Middle East and Africa OKR Software Revenue (USD Million) by Country (2018-2022)
8.6.2 Middle East and Africa OKR Software Revenue (USD Million) by Type (2018-2022)
8.6.3 Middle East and Africa OKR Software Revenue (USD Million) by Applications (2018-2022)
9 Company Profiles
10 Global OKR Software Market Revenue (USD Million), by Type, and Applications (2023-2030)
10.1 Global OKR Software Revenue (USD Million) and Market Share (%) by Type (2023-2030)
10.1.1 Global OKR Software Revenue (USD Million), and Market Share (%) by Type (2023-2030)
10.2 Global OKR Software Revenue (USD Million) and Market Share (%) by Applications (2023-2030)
10.2.1 Global OKR Software Revenue (USD Million), and Market Share (%) by Applications (2023-2030)
11 Global OKR Software Development Regional Status and Outlook Forecast
11.1 Global OKR Software Revenue (USD Million) By Regions (2023-2030)
11.2 North America OKR Software Revenue (USD Million) by Type, and Applications (2023-2030)
11.2.1 North America OKR Software Revenue (USD) Million by Country (2023-2030)
11.2.2 North America OKR Software Revenue (USD Million), by Type (2023-2030)
11.2.3 North America OKR Software Revenue (USD Million), Market Share (%) by Applications (2023-2030)
11.3 Europe OKR Software Revenue (USD Million), by Type, and Applications (2023-2030)
11.3.1 Europe OKR Software Revenue (USD Million), by Country (2023-2030)
11.3.2 Europe OKR Software Revenue (USD Million), by Type (2023-2030)
11.3.3 Europe OKR Software Revenue (USD Million), by Applications (2023-2030)
11.4 Asia Pacific OKR Software Revenue (USD Million) by Type, and Applications (2023-2030)
11.4.1 Asia Pacific OKR Software Revenue (USD Million), by Country (2023-2030)
11.4.2 Asia Pacific OKR Software Revenue (USD Million), by Type (2023-2030)
11.4.3 Asia Pacific OKR Software Revenue (USD Million), by Applications (2023-2030)
11.5 South America OKR Software Revenue (USD Million), by Type, and Applications (2023-2030)
11.5.1 South America OKR Software Revenue (USD Million), by Country (2023-2030)
11.5.2 South America OKR Software Revenue (USD Million), by Type (2023-2030)
11.5.3 South America OKR Software Revenue (USD Million), by Applications (2023-2030)
11.6 Middle East and Africa OKR Software Revenue (USD Million), by Type, and Applications (2023-2030)
11.6.1 Middle East and Africa OKR Software Revenue (USD Million), by region (2023-2030)
11.6.2 Middle East and Africa OKR Software Revenue (USD Million), by Type (2023-2030)
11.6.3 Middle East and Africa OKR Software Revenue (USD Million), by Applications (2023-2030)
12 Methodology and Data Sources
12.1 Methodology/Research Approach
12.1.1 Research Programs/Design
12.1.2 Market Size Estimation
12.1.3 Market Breakdown and Data Triangulation
12.2 Data Sources
12.2.1 Secondary Sources
12.2.2 Primary Sources
12.3 Disclaimer
List of Tables
Table 1 Market Segmentation Analysis
Table 2 Global OKR Software Market Companies with Areas Served
Table 3 Products Offerings Global OKR Software Market
Table 4 Low Growth Scenario Forecasts
Table 5 Reference Case Growth Scenario
Table 6 High Growth Case Scenario
Table 7 Global OKR Software Revenue (USD Million) And CAGR (%) By Type (2018-2030)
Table 8 Global OKR Software Revenue (USD Million) And CAGR (%) By Applications (2018-2030)
Table 9 Global OKR Software Revenue (USD Million) And CAGR (%) By Regions (2018-2030)
Table 10 Global OKR Software Revenue (USD Million) By Type (2018-2022)
Table 11 Global OKR Software Revenue Market Share (%) By Type (2018-2022)
Table 12 Global OKR Software Revenue (USD Million) By Applications (2018-2022)
Table 13 Global OKR Software Revenue Market Share (%) By Applications (2018-2022)
Table 14 Global OKR Software Market Revenue (USD Million) By Regions (2018-2022)
Table 15 Global OKR Software Market Share (%) By Regions (2018-2022)
Table 16 North America OKR Software Revenue (USD Million) By Country (2018-2022)
Table 17 North America OKR Software Revenue (USD Million) By Type (2018-2022)
Table 18 North America OKR Software Revenue (USD Million) By Applications (2018-2022)
Table 19 Europe OKR Software Revenue (USD Million) By Country (2018-2022)
Table 20 Europe OKR Software Revenue (USD Million) By Type (2018-2022)
Table 21 Europe OKR Software Revenue (USD Million) By Applications (2018-2022)
Table 22 Asia Pacific OKR Software Revenue (USD Million) By Country (2018-2022)
Table 23 Asia Pacific OKR Software Revenue (USD Million) By Type (2018-2022)
Table 24 Asia Pacific OKR Software Revenue (USD Million) By Applications (2018-2022)
Table 25 South America OKR Software Revenue (USD Million) By Country (2018-2022)
Table 26 South America OKR Software Revenue (USD Million) By Type (2018-2022)
Table 27 South America OKR Software Revenue (USD Million) By Applications (2018-2022)
Table 28 Middle East and Africa OKR Software Revenue (USD Million) By Region (2018-2022)
Table 29 Middle East and Africa OKR Software Revenue (USD Million) By Type (2018-2022)
Table 30 Middle East and Africa OKR Software Revenue (USD Million) By Applications (2018-2022)
Table 31 Financial Analysis
Table 32 Global OKR Software Revenue (USD Million) By Type (2023-2030)
Table 33 Global OKR Software Revenue Market Share (%) By Type (2023-2030)
Table 34 Global OKR Software Revenue (USD Million) By Applications (2023-2030)
Table 35 Global OKR Software Revenue Market Share (%) By Applications (2023-2030)
Table 36 Global OKR Software Market Revenue (USD Million), And Revenue (USD Million) By Regions (2023-2030)
Table 37 North America OKR Software Revenue (USD)By Country (2023-2030)
Table 38 North America OKR Software Revenue (USD Million) By Type (2023-2030)
Table 39 North America OKR Software Revenue (USD Million) By Applications (2023-2030)
Table 40 Europe OKR Software Revenue (USD Million) By Country (2023-2030)
Table 41 Europe OKR Software Revenue (USD Million) By Type (2023-2030)
Table 42 Europe OKR Software Revenue (USD Million) By Applications (2023-2030)
Table 43 Asia Pacific OKR Software Revenue (USD Million) By Country (2023-2030)
Table 44 Asia Pacific OKR Software Revenue (USD Million) By Type (2023-2030)
Table 45 Asia Pacific OKR Software Revenue (USD Million) By Applications (2023-2030)
Table 46 South America OKR Software Revenue (USD Million) By Country (2023-2030)
Table 47 South America OKR Software Revenue (USD Million) By Type (2023-2030)
Table 48 South America OKR Software Revenue (USD Million) By Applications (2023-2030)
Table 49 Middle East and Africa OKR Software Revenue (USD Million) By Region (2023-2030)
Table 50 Middle East and Africa OKR Software Revenue (USD Million) By Region (2023-2030)
Table 51 Middle East and Africa OKR Software Revenue (USD Million) By Type (2023-2030)
Table 52 Middle East and Africa OKR Software Revenue (USD Million) By Applications (2023-2030)
Table 53 Research Programs/Design for This Report
Table 54 Key Data Information from Secondary Sources
Table 55 Key Data Information from Primary Sources
List of Figures
Figure 1 Market Scope
Figure 2 Porter’s Five Forces
Figure 3 Global OKR Software Revenue (USD Million) By Type (2018-2022)
Figure 4 Global OKR Software Revenue Market Share (%) By Type (2022)
Figure 5 Global OKR Software Revenue (USD Million) By Applications (2018-2022)
Figure 6 Global OKR Software Revenue Market Share (%) By Applications (2022)
Figure 7 Global OKR Software Market Revenue (USD Million) By Regions (2018-2022)
Figure 8 Global OKR Software Market Share (%) By Regions (2022)
Figure 9 North America OKR Software Revenue (USD Million) By Country (2018-2022)
Figure 10 North America OKR Software Revenue (USD Million) By Type (2018-2022)
Figure 11 North America OKR Software Revenue (USD Million) By Applications (2018-2022)
Figure 12 Europe OKR Software Revenue (USD Million) By Country (2018-2022)
Figure 13 Europe OKR Software Revenue (USD Million) By Type (2018-2022)
Figure 14 Europe OKR Software Revenue (USD Million) By Applications (2018-2022)
Figure 15 Asia Pacific OKR Software Revenue (USD Million) By Country (2018-2022)
Figure 16 Asia Pacific OKR Software Revenue (USD Million) By Type (2018-2022)
Figure 17 Asia Pacific OKR Software Revenue (USD Million) By Applications (2018-2022)
Figure 18 South America OKR Software Revenue (USD Million) By Country (2018-2022)
Figure 19 South America OKR Software Revenue (USD Million) By Type (2018-2022)
Figure 20 South America OKR Software Revenue (USD Million) By Applications (2018-2022)
Figure 21 Middle East and Africa OKR Software Revenue (USD Million) By Region (2018-2022)
Figure 22 Middle East and Africa OKR Software Revenue (USD Million) By Type (2018-2022)
Figure 23 Middle East and Africa OKR Software Revenue (USD Million) By Applications (2018-2022)
Figure 24 Global OKR Software Revenue (USD Million) By Type (2023-2030)
Figure 25 Global OKR Software Revenue Market Share (%) By Type (2030)
Figure 26 Global OKR Software Revenue (USD Million) By Applications (2023-2030)
Figure 27 Global OKR Software Revenue Market Share (%) By Applications (2030)
Figure 28 Global OKR Software Market Revenue (USD Million) By Regions (2023-2030)
Figure 29 North America OKR Software Revenue (USD Million) By Country (2023-2030)
Figure 30 North America OKR Software Revenue (USD Million) By Type (2023-2030)
Figure 31 North America OKR Software Revenue (USD Million) By Applications (2023-2030)
Figure 32 Europe OKR Software Revenue (USD Million) By Country (2023-2030)
Figure 33 Europe OKR Software Revenue (USD Million) By Type (2023-2030)
Figure 34 Europe OKR Software Revenue (USD Million) By Applications (2023-2030)
Figure 35 Asia Pacific OKR Software Revenue (USD Million) By Country (2023-2030)
Figure 36 Asia Pacific OKR Software Revenue (USD Million) By Type (2023-2030)
Figure 37 Asia Pacific OKR Software Revenue (USD Million) By Applications (2023-2030)
Figure 38 South America OKR Software Revenue (USD Million) By Country (2023-2030)
Figure 39 South America OKR Software Revenue (USD Million) By Type (2023-2030)
Figure 40 South America OKR Software Revenue (USD Million) By Applications (2023-2030)
Figure 41 Middle East and Africa OKR Software Revenue (USD Million) By Region (2023-2030)
Figure 42 Middle East and Africa OKR Software Revenue (USD Million) By Region (2023-2030)
Figure 43 Middle East and Africa OKR Software Revenue (USD Million) By Type (2023-2030)
Figure 44 Middle East and Africa OKR Software Revenue (USD Million) By Applications (2023-2030)
Figure 45 Bottom-Up and Top-Down Approaches for This Report
Figure 46 Data Triangulation
