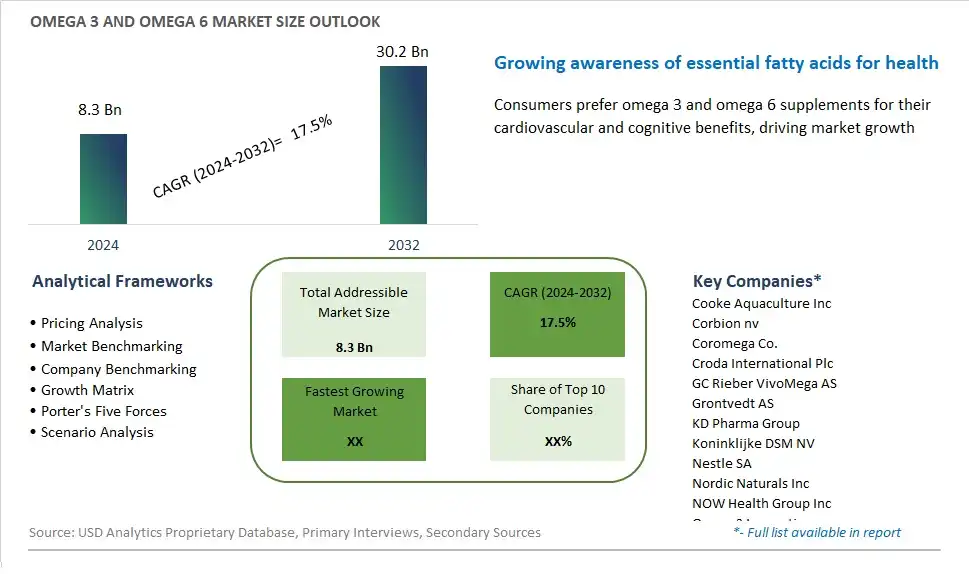
Global Omega 3 And Omega 6 Market Size is valued at $8.3 Billion in 2024 and is forecast to register a growth rate (CAGR) of 17.5% to reach $30.2 Billion by 2032.
The global Omega 3 And Omega 6 Market Comprehensive Study analyzes and forecasts the market size across 6 regions and 24 countries for diverse segments -By Type (Omega 6, Omega 3), By Application (Functional food and supplements, Infant nutrition, Pharmaceutical, Pet food and feed, Others)
An Introduction to Omega 3 And Omega 6 Market
In 2024, the market for omega-3 and omega-6 fatty acids continues to be essential in the nutrition and health sectors, as these polyunsaturated fats are crucial for maintaining various bodily functions. Omega-3 fatty acids, found in sources like fish, flaxseeds, and chia seeds, are renowned for their anti-inflammatory properties, cardiovascular benefits, and support for brain health and cognitive function. Meanwhile, omega-6 fatty acids, abundant in vegetable oils, nuts, and seeds, play a role in skin health, hormone production, and immune response regulation. Achieving the optimal balance of omega-3 to omega-6 fatty acids is essential for overall health, yet modern diets often contain an imbalance skewed towards omega-6. As a result, consumers are increasingly turning to supplements, functional foods, and fortified products to ensure they meet their omega-3 and omega-6 requirements. With rising awareness of the importance of fatty acids in health and wellness, the market is witnessing innovation in product formulations, sustainable sourcing practices, and targeted marketing strategies to meet the diverse needs of consumers seeking to optimize their nutritional intake and promote long-term well-being.
Omega 3 And Omega 6 Competitive Landscape
The market report analyses the leading companies in the industry including Cooke Aquaculture Inc, Corbion nv, Coromega Co., Croda International Plc, GC Rieber VivoMega AS, Grontvedt AS, KD Pharma Group, Koninklijke DSM NV, Nestle SA, Nordic Naturals Inc, NOW Health Group Inc, Omega3 Innovations, Orkla Health AS, Orlo Nutrition, Ornua Co-operative Ltd, Pharma Marine AS, Polaris, and Others.
Omega 3 And Omega 6 Market Dynamics
Omega 3 And Omega 6 Market Trend: Increasing Consumer Awareness of Essential Fatty Acids
A significant trend in the omega-3 and omega-6 market is the rising consumer awareness of the importance of essential fatty acids for overall health and well-being. Omega-3 and omega-6 fatty acids are essential nutrients that play crucial roles in various bodily functions, including brain health, cardiovascular health, inflammation regulation, and skin health. As consumers become more informed about the benefits of incorporating these essential fats into their diets, there's a growing demand for foods, supplements, and functional products enriched with omega-3 and omega-6 fatty acids. This trend is driven by a desire for preventive healthcare, personalized nutrition, and functional foods that offer targeted health benefits, contributing to the expansion of the omega-3 and omega-6 market.
Market Driver: Increasing Incidence of Chronic Diseases and Health Conditions
A key driver for the omega-3 and omega-6 market is the increasing incidence of chronic diseases and health conditions associated with inadequate intake of essential fatty acids. Research has linked deficiencies in omega-3 and omega-6 fatty acids to a range of health issues, including cardiovascular disease, cognitive decline, inflammatory disorders, and metabolic syndrome. This driver is reinforced by growing public health concerns related to sedentary lifestyles, poor dietary habits, and rising rates of obesity and metabolic disorders. As healthcare professionals and consumers recognize the importance of omega-3 and omega-6 fatty acids in disease prevention and management, there's a heightened demand for dietary interventions and supplementation strategies to optimize fatty acid intake and support overall health. This driver underscores the critical role of omega-3 and omega-6 fatty acids in promoting health and mitigating the risk of chronic diseases, driving growth in the market for products fortified with these essential nutrients.
Market Opportunity: Innovation in Product Formulations and Delivery Systems
An opportunity for the omega-3 and omega-6 market lies in innovation in product formulations and delivery systems to enhance bioavailability, efficacy, and consumer convenience. Companies can capitalize on this opportunity by developing novel formulations of omega-3 and omega-6 supplements, such as concentrated fish oil capsules, algae-based supplements, emulsified oils, and fortified foods and beverages. Additionally, there's potential to explore advanced delivery technologies, such as nanoemulsions, microencapsulation, and liposomal encapsulation, to improve the absorption and stability of omega-3 and omega-6 fatty acids in the body. Moreover, there's an opportunity to diversify product offerings to cater to specific consumer preferences and dietary needs, such as vegetarian and vegan-friendly options, sustainable and eco-friendly sourcing practices, and clean label formulations free from additives and artificial ingredients. By innovating with product formulations and delivery systems, companies can differentiate their omega-3 and omega-6 products, meet the evolving needs of health-conscious consumers, and drive growth in the market.
Omega 3 And Omega 6 Market Share Analysis: Omega 3 held the dominant market share in 2024
In the Omega 3 and Omega 6 Market segmented by type, Omega 3 is the largest segment, propelled by several crucial factors. Omega 3 fatty acids are essential nutrients with well-documented health benefits, including cardiovascular health, brain function, and inflammatory response modulation. The widespread recognition of these benefits has led to increased consumer awareness and demand for Omega 3-rich foods and supplements. Additionally, Omega 3 fatty acids are primarily obtained from marine sources such as fish oil, which is rich in EPA (eicosapentaenoic acid) and DHA (docosahexaenoic acid), further driving their popularity due to their superior bioavailability and efficacy compared to plant-derived sources of Omega 3. Further, scientific research supporting the role of Omega 3 in promoting overall health and well-being has contributed to its dominance in the market. As consumers increasingly prioritize preventive healthcare and seek out functional foods and supplements to support their health goals, the Omega 3 segment continues to hold a significant share of the Omega 3 and Omega 6 market.
Omega 3 And Omega 6 Market Share Analysis: Functional Food and Supplements market is poised to register the fastest growth rae over the forecast period to 2032
Within the Omega 3 and Omega 6 Market segmented by application, functional food and supplements emerge as the fastest-growing segment, propelled by several compelling factors. As consumers increasingly prioritize health and wellness, there is a growing demand for functional foods and dietary supplements enriched with Omega 3 and Omega 6 fatty acids, renowned for their numerous health benefits. The versatility of these essential fatty acids in supporting cardiovascular health, brain function, inflammation management, and overall well-being has fueled their incorporation into a wide range of functional food products such as fortified dairy, beverages, baked goods, and snacks, catering to diverse dietary preferences and lifestyles. Further, the rising prevalence of chronic diseases and lifestyle-related health concerns has further spurred the adoption of Omega 3 and Omega 6 supplements as a convenient and effective means of addressing nutritional deficiencies and supporting optimal health. Additionally, the growing awareness of the importance of early-life nutrition in infant development and the increasing use of Omega 3 and Omega 6 supplements in infant formulas contribute to the segment's rapid growth. As consumers continue to seek out proactive approaches to health maintenance and disease prevention, the functional food and supplements segment is poised to maintain its accelerated growth trajectory, driving innovation and expansion in the Omega 3 and Omega 6 market.
Omega 3 And Omega 6 Market Segmentation
By Type
Omega 6
Omega 3
By Application
Functional food and supplements
Infant nutrition
Pharmaceutical
Pet food and feed
Others
Countries Analyzed
North America (US, Canada, Mexico)
Europe (Germany, UK, France, Spain, Italy, Russia, Rest of Europe)
Asia Pacific (China, India, Japan, South Korea, Australia, South East Asia, Rest of Asia)
South America (Brazil, Argentina, Rest of South America)
Middle East and Africa (Saudi Arabia, UAE, Rest of Middle East, South Africa, Egypt, Rest of Africa)
Omega 3 And Omega 6 Companies Profiled in the Study
Cooke Aquaculture Inc
Corbion nv
Coromega Co.
Croda International Plc
GC Rieber VivoMega AS
Grontvedt AS
KD Pharma Group
Koninklijke DSM NV
Nestle SA
Nordic Naturals Inc
NOW Health Group Inc
Omega3 Innovations
Orkla Health AS
Orlo Nutrition
Ornua Co-operative Ltd
Pharma Marine AS
Polaris
*- List Not Exhaustive
Chapter 1. TABLE OF CONTENTS
Chapter 2. Introduction to Omega 3 And Omega 6 Market
2.1. Market Overview
2.2. Key Statistics and Report Highlights
2.3. Scope of the Comprehensive Study
2.3.1. Market Definition
2.3.2 Countries and Regions Covered
2.3.3 Research Objective
2.3.4 Units, Currency, and Conversions
2.3.5 Industry Value Chain
2.4. Key Market Segments
2.5. Key Companies
2.6. Study Period
Chapter 3. Strategic Analysis Review
3.1. Omega 3 And Omega 6 Pricing Analysis and Forecast
3.2. Porter’s Five Forces
3.3. Market Ecosystem
3.4. SWOT Analysis
3.5. Regulatory Scenario
3.3. Effects of Inflation, Russia-Ukraine War, moderating economic growth, and other macroeconomic factors
Chapter 4. Competitive Landscape
4.1. Market Share Analysis
4.1.1. Global Omega 3 And Omega 6 Market Share by Company, 2023
4.1.2. Product Offerings of Leading Omega 3 And Omega 6 Companies
4.2. Market Entropy
4.2.1. New Product Launches in the Industry
4.2.2. Mergers, Acquisitions, Joint ventures, and Partnerships
4.3. Key Strategies and Best Practices
Chapter 5. Global Market Projections: Best, Reference, and Low Case Scenarios
5.1. Growth Analysis- Case Scenario Definitions
5.2. Low Growth Case Scenario Forecasts
5.3. Reference Growth Case Scenario Forecasts
5.4. High Growth Case Scenario Forecasts
Chapter 6. Market Dynamics
6.1. Omega 3 And Omega 6 Market Drivers
6.2. Omega 3 And Omega 6 Market Challenges
6.6. Omega 3 And Omega 6 Market Opportunities
6.4. Omega 3 And Omega 6 Market Trends
Chapter 7. Global Omega 3 And Omega 6 Market Outlook Trends
7.1. Global Omega 3 And Omega 6 Revenue (USD Million) and CAGR (%) by Type (2021-2032)
7.2. Global Omega 3 And Omega 6 Revenue (USD Million) and CAGR (%) by Application (2021-2032)
7.3. Global Omega 3 And Omega 6 Revenue (USD Million) and CAGR (%) by Product (2021-2032)
By Type
Omega 6
Omega 3
By Application
Functional food and supplements
Infant nutrition
Pharmaceutical
Pet food and feed
Others
Chapter 8. Global Omega 3 And Omega 6 Regional Analysis and Outlook
8.1. Global Omega 3 And Omega 6 Revenue (USD Million) By Regions (2021- 2032)
8.2. North America Omega 3 And Omega 6 Revenue (USD Million) by Country (2021-2032)
8.2.1. United States Omega 3 And Omega 6 Regional Analysis and Outlook
8.2.2. Canada Omega 3 And Omega 6 Regional Analysis and Outlook
8.2.3. Mexico Omega 3 And Omega 6 Regional Analysis and Outlook
8.3. Europe Omega 3 And Omega 6 Revenue (USD Million), by Country (2021-2032)
8.3.1. Germany Omega 3 And Omega 6 Regional Analysis and Outlook
8.3.2. France Omega 3 And Omega 6 Regional Analysis and Outlook
8.3.3. United Kingdom Omega 3 And Omega 6 Regional Analysis and Outlook
8.3.4. Spain Omega 3 And Omega 6 Regional Analysis and Outlook
8.3.5. Italy Omega 3 And Omega 6 Regional Analysis and Outlook
8.3.6. Russia Omega 3 And Omega 6 Regional Analysis and Outlook
8.3.7. Rest of Europe Omega 3 And Omega 6 Regional Analysis and Outlook
8.4. Asia Pacific Omega 3 And Omega 6 Revenue (USD Million) by Country (2021-2032)
8.4.1. China Omega 3 And Omega 6 Regional Analysis and Outlook
8.4.2. Japan Omega 3 And Omega 6 Regional Analysis and Outlook
8.4.3. India Omega 3 And Omega 6 Regional Analysis and Outlook
8.4.4. South Korea Omega 3 And Omega 6 Regional Analysis and Outlook
8.4.5. Australia Omega 3 And Omega 6 Regional Analysis and Outlook
8.4.6. South East Asia Omega 3 And Omega 6 Regional Analysis and Outlook
8.4.7. Rest of Asia Pacific Omega 3 And Omega 6 Regional Analysis and Outlook
8.5. South America Omega 3 And Omega 6 Revenue (USD Million), by Country (2021-2032)
8.5.1. Brazil Omega 3 And Omega 6 Regional Analysis and Outlook
8.5.2. Argentina Omega 3 And Omega 6 Regional Analysis and Outlook
8.5.3. Rest of South America Omega 3 And Omega 6 Regional Analysis and Outlook
8.6. Middle East and Africa Omega 3 And Omega 6 Revenue (USD Million) by Country (2021-2032)
8.6.1. Middle East Omega 3 And Omega 6 Regional Analysis and Outlook
8.6.2. Africa Omega 3 And Omega 6 Regional Analysis and Outlook
Chapter 9. North America Omega 3 And Omega 6 Analysis and Outlook
9.1. North America Omega 3 And Omega 6 Revenue (USD Million) by Segments (2021-2032)
9.1.1. North America Omega 3 And Omega 6 Revenue (USD Million) by Type (2021-2032)
9.1.2. North America Omega 3 And Omega 6 Revenue (USD Million) by Application (2021-2032)
9.1.3. North America Omega 3 And Omega 6 Revenue (USD Million) by Product (2021-2032)
By Type
Omega 6
Omega 3
By Application
Functional food and supplements
Infant nutrition
Pharmaceutical
Pet food and feed
Others
Chapter 10. Europe Omega 3 And Omega 6 Analysis and Outlook
10.1. Europe Omega 3 And Omega 6 Revenue (USD Million), by Segments (USD Million) (2021-2032)
10.1.1. Europe Omega 3 And Omega 6 Revenue (USD Million) by Type (2021-2032)
10.1.2. Europe Omega 3 And Omega 6 Revenue (USD Million) by Application (2021-2032)
10.1.3. Europe Omega 3 And Omega 6 Revenue (USD Million) by Product (2021-2032)
By Type
Omega 6
Omega 3
By Application
Functional food and supplements
Infant nutrition
Pharmaceutical
Pet food and feed
Others
Chapter 11. Asia Pacific Omega 3 And Omega 6 Analysis and Outlook
11.1. Asia Pacific Omega 3 And Omega 6 Revenue (USD Million), and Revenue (USD Million) by Segments (2021-2032)
11.1.1. Asia Pacific Omega 3 And Omega 6 Revenue (USD Million) by Type (2021-2032)
11.1.2. Asia Pacific Omega 3 And Omega 6 Revenue (USD Million) by Application (2021-2032)
11.1.3. Asia Pacific Omega 3 And Omega 6 Revenue (USD Million) by Product (2021-2032)
By Type
Omega 6
Omega 3
By Application
Functional food and supplements
Infant nutrition
Pharmaceutical
Pet food and feed
Others
Chapter 12. South America Omega 3 And Omega 6 Analysis and Outlook
12.1. South America Omega 3 And Omega 6 Revenue (USD Million), by Segments (2021-2032)
12.1.1. South America Omega 3 And Omega 6 Revenue (USD Million) by Type (2021-2032)
12.1.2. South America Omega 3 And Omega 6 Revenue (USD Million) by Application (2021-2032)
12.1.3. South America Omega 3 And Omega 6 Revenue (USD Million) by Product (2021-2032)
By Type
Omega 6
Omega 3
By Application
Functional food and supplements
Infant nutrition
Pharmaceutical
Pet food and feed
Others
Chapter 13. Middle East and Africa Omega 3 And Omega 6 Analysis and Outlook
13.1. Middle East and Africa Omega 3 And Omega 6 Revenue (USD Million), by Segments (2021-2032)
13.1.1. Middle East and Africa Omega 3 And Omega 6 Revenue (USD Million) by Type (2021-2032)
13.1.2. Middle East and Africa Omega 3 And Omega 6 Revenue (USD Million) by Application (2021-2032)
13.1.3. Middle East and Africa Omega 3 And Omega 6 Revenue (USD Million) by Product (2021-2032)
By Type
Omega 6
Omega 3
By Application
Functional food and supplements
Infant nutrition
Pharmaceutical
Pet food and feed
Others
Chapter 14. Omega 3 And Omega 6 Company Profiles
14.1 Business Overview
14.2 Product Profiles
14.3 SWOT Profiles
14.5 Recent Developments
14.6 Financial Profile
List of Companies
Cooke Aquaculture Inc
Corbion nv
Coromega Co.
Croda International Plc
GC Rieber VivoMega AS
Grontvedt AS
KD Pharma Group
Koninklijke DSM NV
Nestle SA
Nordic Naturals Inc
NOW Health Group Inc
Omega3 Innovations
Orkla Health AS
Orlo Nutrition
Ornua Co-operative Ltd
Pharma Marine AS
Polaris
15. Methodology and Data Sources
15.1 Customization Offerings
15.2 Subscription Services
15.3 Related Reports
15.4 Publisher Expertise
LIST OF TABLES
Table 1 Market Segmentation Analysis
Table 2 Global Omega 3 And Omega 6 Market Share of Leading Companies, 2023
Table 3 Product Offerings of Leading Companies
Table 4 Low Growth Scenario Forecasts
Table 5 Reference Case Growth Scenario
Table 6 High Growth Case Scenario
Table 7 Global Omega 3 And Omega 6 Revenue (USD Million) And CAGR (%) By Type (2021-2032)
Table 8 Global Omega 3 And Omega 6 Revenue (USD Million) And CAGR (%) By Application (2021-2032)
Table 9 Global Omega 3 And Omega 6 Revenue (USD Million) And CAGR (%) By Product (2021-2032)
Table 10 Global Omega 3 And Omega 6 Market Revenue (USD Million) By Regions (2021-2032)
Table 11 Global Omega 3 And Omega 6 Market Share (%) By Regions (2021-2032)
Table 12 North America Omega 3 And Omega 6 Revenue (USD Million) By Country (2021-2032)
Table 13 Europe Omega 3 And Omega 6 Revenue (USD Million) By Country (2021-2032)
Table 14 Asia Pacific Omega 3 And Omega 6 Revenue (USD Million) By Country (2021-2032)
Table 15 South America Omega 3 And Omega 6 Revenue (USD Million) By Country (2021-2032)
Table 16 Middle East and Africa Omega 3 And Omega 6 Revenue (USD Million) By Region (2021-2032)
Table 17 North America Omega 3 And Omega 6 Revenue (USD Million) By Type (2021-2032)
Table 18 North America Omega 3 And Omega 6 Revenue (USD Million) By Application (2021-2032)
Table 19 North America Omega 3 And Omega 6 Revenue (USD Million) By Product (2021-2032)
Table 20 Europe Omega 3 And Omega 6 Revenue (USD Million) By Type (2021-2032)
Table 21 Europe Omega 3 And Omega 6 Revenue (USD Million) By Application (2021-2032)
Table 22 Europe Omega 3 And Omega 6 Revenue (USD Million) By Product (2021-2032)
Table 23 Asia Pacific Omega 3 And Omega 6 Revenue (USD Million) By Type (2021-2032)
Table 24 Asia Pacific Omega 3 And Omega 6 Revenue (USD Million) By Application (2021-2032)
Table 25 Asia Pacific Omega 3 And Omega 6 Revenue (USD Million) By Product (2021-2032)
Table 26 South America Omega 3 And Omega 6 Revenue (USD Million) By Type (2021-2032)
Table 27 South America Omega 3 And Omega 6 Revenue (USD Million) By Application (2021-2032)
Table 28 South America Omega 3 And Omega 6 Revenue (USD Million) By Product (2021-2032)
Table 29 Middle East and Africa Omega 3 And Omega 6 Revenue (USD Million) By Type (2021-2032)
Table 30 Middle East and Africa Omega 3 And Omega 6 Revenue (USD Million) By Application (2021-2032)
Table 31 Middle East and Africa Omega 3 And Omega 6 Revenue (USD Million) By Product (2021-2032)
LIST OF FIGURES
Figure 1. Market Scope
Figure 2. Pricing Forecasts Per Unit, 2023- 2032
Figure 3. Porter’s Five Forces
Figure 4. Global Omega 3 And Omega 6 Market Revenue (USD Million) By Regions (2021-2032)
Figure 5. Global Omega 3 And Omega 6 Market Share (%) By Regions (2023)
Figure 6. North America Omega 3 And Omega 6 Revenue (USD Million) By Country (2021-2032)
Figure 7. United States Omega 3 And Omega 6 Revenue (USD Million) By Country (2021-2032)
Figure 8. Canada Omega 3 And Omega 6 Revenue (USD Million) By Country (2021-2032)
Figure 9. Mexico Omega 3 And Omega 6 Revenue (USD Million) By Country (2021-2032)
Figure 10. Europe Omega 3 And Omega 6 Revenue (USD Million) By Country (2021-2032)
Figure 11. Germany Omega 3 And Omega 6 Revenue (USD Million) By Country (2021-2032)
Figure 12. France Omega 3 And Omega 6 Revenue (USD Million) By Country (2021-2032)
Figure 13. United Kingdom Omega 3 And Omega 6 Revenue (USD Million) By Country (2021-2032)
Figure 14. Spain Omega 3 And Omega 6 Revenue (USD Million) By Country (2021-2032)
Figure 15. Italy Omega 3 And Omega 6 Revenue (USD Million) By Country (2021-2032)
Figure 16. Russia Omega 3 And Omega 6 Revenue (USD Million) By Country (2021-2032)
Figure 17. Rest of Europe Omega 3 And Omega 6 Revenue (USD Million) By Country (2021-2032)
Figure 11. Asia Pacific Omega 3 And Omega 6 Revenue (USD Million) By Country (2021-2032)
Figure 12. China Omega 3 And Omega 6 Revenue (USD Million) By Country (2021-2032)
Figure 13. Japan Omega 3 And Omega 6 Revenue (USD Million) By Country (2021-2032)
Figure 14. India Omega 3 And Omega 6 Revenue (USD Million) By Country (2021-2032)
Figure 15. South Korea Omega 3 And Omega 6 Revenue (USD Million) By Country (2021-2032)
Figure 16. Australia Omega 3 And Omega 6 Revenue (USD Million) By Country (2021-2032)
Figure 17. South East Asia Omega 3 And Omega 6 Revenue (USD Million) By Country (2021-2032)
Figure 18. South America Omega 3 And Omega 6 Revenue (USD Million) By Country (2021-2032)
Figure 19. Brazil Omega 3 And Omega 6 Revenue (USD Million) By Country (2021-2032)
Figure 20. Argentina Omega 3 And Omega 6 Revenue (USD Million) By Country (2021-2032)
Figure 21. Rest of Asia Pacific Omega 3 And Omega 6 Revenue (USD Million) By Country (2021-2032)
Figure 22. Middle East and Africa Omega 3 And Omega 6 Revenue (USD Million) By Region (2021-2032)
Figure 23. Saudi Arabia Omega 3 And Omega 6 Revenue (USD Million) By Region (2021-2032)
Figure 24. The UAE Omega 3 And Omega 6 Revenue (USD Million) By Region (2021-2032)
Figure 25. Rest of Middle East Omega 3 And Omega 6 Revenue (USD Million) By Region (2021-2032)
Figure 26. South Africa Omega 3 And Omega 6 Revenue (USD Million) By Region (2021-2032)
Figure 27. Africa Omega 3 And Omega 6 Revenue (USD Million) By Region (2021-2032)
Figure 28. North America Omega 3 And Omega 6 Revenue (USD Million) By Type (2021-2032)
Figure 29. North America Omega 3 And Omega 6 Revenue (USD Million) By Application (2021-2032)
Figure 30. North America Omega 3 And Omega 6 Revenue (USD Million) By Product (2021-2032)
Figure 31. Europe Omega 3 And Omega 6 Revenue (USD Million) By Type (2021-2032)
Figure 32. Europe Omega 3 And Omega 6 Revenue (USD Million) By Application (2021-2032)
Figure 33. Europe Omega 3 And Omega 6 Revenue (USD Million) By Product (2021-2032)
Figure 34. Asia Pacific Omega 3 And Omega 6 Revenue (USD Million) By Type (2021-2032)
Figure 35. Asia Pacific Omega 3 And Omega 6 Revenue (USD Million) By Application (2021-2032)
Figure 36. Asia Pacific Omega 3 And Omega 6 Revenue (USD Million) By Product (2021-2032)
Figure 37. South America Omega 3 And Omega 6 Revenue (USD Million) By Type (2021-2032)
Figure 38. South America Omega 3 And Omega 6 Revenue (USD Million) By Application (2021-2032)
Figure 39. South America Omega 3 And Omega 6 Revenue (USD Million) By Product (2021-2032)
Figure 40. Middle East and Africa Omega 3 And Omega 6 Revenue (USD Million) By Type (2021-2032)
Figure 41. Middle East and Africa Omega 3 And Omega 6 Revenue (USD Million) By Application (2021-2032)
Figure 42. Middle East and Africa Omega 3 And Omega 6 Revenue (USD Million) By Product (2021-2032)
By Type
Omega 6
Omega 3
By Application
Functional food and supplements
Infant nutrition
Pharmaceutical
Pet food and feed
Others
Countries Analyzed
North America (US, Canada, Mexico)
Europe (Germany, UK, France, Spain, Italy, Russia, Rest of Europe)
Asia Pacific (China, India, Japan, South Korea, Australia, South East Asia, Rest of Asia)
South America (Brazil, Argentina, Rest of South America)
Middle East and Africa (Saudi Arabia, UAE, Rest of Middle East, South Africa, Egypt, Rest of Africa)
