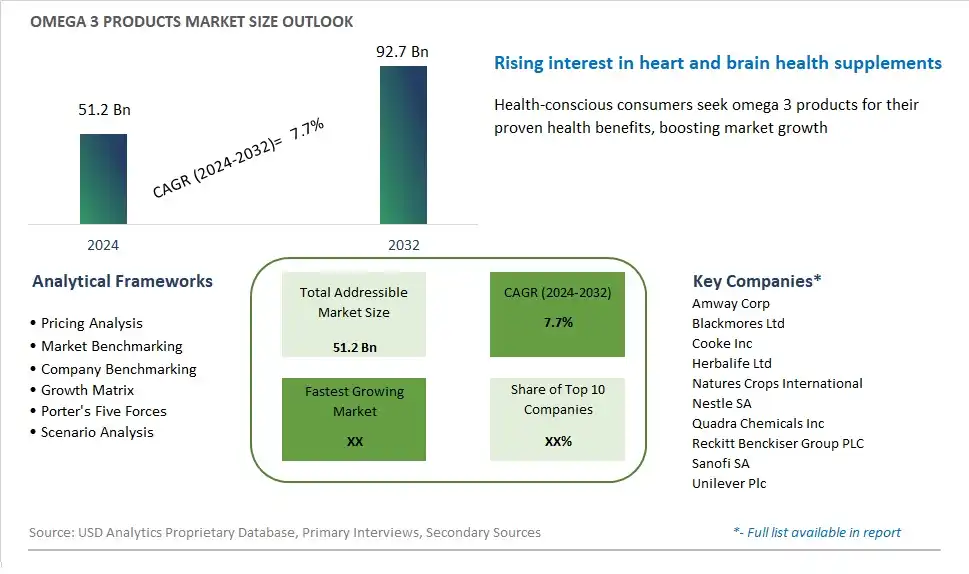
Global Omega 3 Products Market Size is valued at $51.2 Billion in 2024 and is forecast to register a growth rate (CAGR) of 7.7% to reach $92.7 Billion by 2032.
The global Omega 3 Products Market Comprehensive Study analyzes and forecasts the market size across 6 regions and 24 countries for diverse segments -By Product (Functional Food, Dietary Supplements, Infant Nutrition, Pet Food and Feed, Others), By Distribution Channel (Supermarkets/ Hypermarkets, Drug Stores, Online Retailers, Others)
An Introduction to Omega 3 Products Market
In 2024, the market for omega-3 products continues to expand, driven by growing consumer interest in health-conscious lifestyles and the recognition of omega-3 fatty acids' numerous health benefits. Omega-3 products encompass a wide range of supplements, functional foods, and fortified beverages designed to deliver essential fatty acids such as EPA (eicosapentaenoic acid) and DHA (docosahexaenoic acid). These nutrients are vital for cardiovascular health, cognitive function, eye health, and inflammation management. With hectic lifestyles and dietary gaps in omega-3 intake becoming increasingly common, consumers are turning to omega-3 products to bridge the nutritional shortfall. The market is witnessing innovation in delivery formats, including emulsions, softgels, gummies, and beverages, catering to diverse preferences and lifestyles. Moreover, sustainability and purity are becoming key factors influencing purchasing decisions, leading to the rise of eco-friendly sourcing practices and third-party certifications like Marine Stewardship Council (MSC) certification for fish oil-based products. As scientific research continues to uncover the health benefits of omega-3 fatty acids, the market for omega-3 products is poised for further growth, offering consumers convenient and effective solutions to support their health and well-being.
Omega 3 Products Competitive Landscape
The market report analyses the leading companies in the industry including Amway Corp, Blackmores Ltd, Cooke Inc, Herbalife Ltd, Natures Crops International, Nestle SA, Quadra Chemicals Inc, Reckitt Benckiser Group PLC, Sanofi SA, Unilever Plc, and Others.
Omega 3 Products Market Dynamics
Omega 3 Products Market Trend: Rising Demand for Plant-Based Omega-3 Alternatives
A significant trend in the omega-3 products market is the rising demand for plant-based alternatives to traditional marine sources of omega-3 fatty acids. With growing concerns about overfishing, environmental sustainability, and fish-derived contaminants such as mercury and PCBs, consumers are seeking out plant-based omega-3 options derived from sources such as algae, flaxseed, chia seeds, and hemp seeds. This trend is driven by a desire for sustainable and eco-friendly dietary choices, as well as the increasing popularity of vegetarian, vegan, and plant-based diets. As consumers prioritize health and environmental sustainability in their purchasing decisions, there's a growing opportunity for manufacturers to innovate with plant-based omega-3 products that offer comparable nutritional benefits to fish oil supplements.
Market Driver: Growing Awareness of Health Benefits and Functional Properties
A key driver for the omega-3 products market is the growing awareness of the health benefits and functional properties of omega-3 fatty acids. Omega-3s, particularly EPA (eicosapentaenoic acid) and DHA (docosahexaenoic acid), are essential nutrients that play crucial roles in brain health, heart health, inflammation regulation, and overall well-being. This driver is reinforced by extensive scientific research supporting the therapeutic effects of omega-3 fatty acids in reducing the risk of cardiovascular disease, supporting cognitive function, improving mood and mental health, and alleviating inflammatory conditions such as arthritis and autoimmune diseases. Moreover, there's a growing recognition of the importance of omega-3 supplementation during pregnancy and early childhood for fetal and infant development. As consumers seek out evidence-based dietary interventions to support their health goals, there's a continued demand for omega-3 products as essential components of a balanced and healthy lifestyle.
Market Opportunity: Expansion into Functional Foods and Beverages
An opportunity for the omega-3 products market lies in expansion into functional foods and beverages to offer consumers convenient and innovative ways to incorporate omega-3 fatty acids into their diets. Companies can capitalize on this opportunity by fortifying a wide range of food and beverage products, including dairy alternatives, plant-based milks, juices, yogurt, cereals, snacks, and bakery items, with omega-3-rich ingredients such as algae oil, flaxseed oil, and chia seeds. By incorporating omega-3s into everyday foods and beverages that consumers already enjoy, manufacturers can provide a seamless and palatable way for individuals to meet their nutritional needs and reap the health benefits of omega-3 fatty acids. Moreover, there's potential to target specific consumer segments such as children, athletes, and aging populations by offering functional foods and beverages tailored to their unique health and lifestyle needs. By leveraging the versatility and versatility of omega-3 ingredients, companies can differentiate their product portfolios, expand market reach, and drive growth in the omega-3 products market.
Omega 3 Products Market Share Analysis: Dietary Supplements held the dominant market share in 2024
In the Omega 3 Products Market segmented by product, dietary supplements emerge as the largest segment, driven by several pivotal factors. Dietary supplements enriched with Omega 3 fatty acids offer a convenient and efficient means for consumers to meet their nutritional needs and support overall health and well-being. With growing awareness of the health benefits associated with Omega 3, including cardiovascular support, cognitive function, and inflammatory response modulation, there has been a surge in demand for Omega 3 supplements among health-conscious individuals seeking preventive healthcare solutions. Further, dietary supplements provide a standardized dosage of Omega 3, ensuring consistent intake and efficacy compared to obtaining these nutrients through dietary sources alone. Additionally, the widespread availability and accessibility of Omega 3 supplements through various retail channels further contribute to their dominance in the market. As consumers continue to prioritize proactive approaches to health maintenance and seek out convenient and reliable sources of essential nutrients, the dietary supplements segment is expected to maintain its leadership position in the Omega 3 Products Market.
Omega 3 Products Market Share Analysis: Online Retailers market is poised to register the fastest growth rae over the forecast period to 2032
In the Omega 3 Products Market segmented by distribution channel, online retailers emerge as the fastest-growing segment, driven by several compelling factors. The exponential growth of e-commerce platforms and the increasing preference for online shopping have revolutionized the way consumers purchase Omega 3 products. Online retailers offer unparalleled convenience, allowing consumers to browse a wide selection of products, compare prices, and make purchases from the comfort of their homes. Further, the COVID-19 pandemic has accelerated the shift towards online shopping as consumers prioritize safety and social distancing measures. Additionally, the accessibility of online retailers eliminates geographical barriers, enabling consumers to access a diverse range of Omega 3 products from around the world. Furthermore, the digitalization of marketing and promotional efforts by Omega 3 manufacturers and retailers, coupled with the seamless integration of online payment gateways and doorstep delivery services, further enhances the appeal of purchasing Omega 3 products online. As consumer behavior continues to favor the convenience and flexibility offered by online shopping, the online retailers segment is poised to maintain its rapid growth trajectory, reshaping the distribution landscape of the Omega 3 Products Market.
Omega 3 Products Market Segmentation
By Product
Functional Food
Dietary Supplements
Infant Nutrition
Pet Food and Feed
Others
By Distribution Channel
Supermarkets/ Hypermarkets
Drug Stores
Online Retailers
Others
Countries Analyzed
North America (US, Canada, Mexico)
Europe (Germany, UK, France, Spain, Italy, Russia, Rest of Europe)
Asia Pacific (China, India, Japan, South Korea, Australia, South East Asia, Rest of Asia)
South America (Brazil, Argentina, Rest of South America)
Middle East and Africa (Saudi Arabia, UAE, Rest of Middle East, South Africa, Egypt, Rest of Africa)
Omega 3 Products Companies Profiled in the Study
Amway Corp
Blackmores Ltd
Cooke Inc
Herbalife Ltd
Natures Crops International
Nestle SA
Quadra Chemicals Inc
Reckitt Benckiser Group PLC
Sanofi SA
Unilever Plc
*- List Not Exhaustive
Chapter 1. TABLE OF CONTENTS
Chapter 2. Introduction to Omega 3 Products Market
2.1. Market Overview
2.2. Key Statistics and Report Highlights
2.3. Scope of the Comprehensive Study
2.3.1. Market Definition
2.3.2 Countries and Regions Covered
2.3.3 Research Objective
2.3.4 Units, Currency, and Conversions
2.3.5 Industry Value Chain
2.4. Key Market Segments
2.5. Key Companies
2.6. Study Period
Chapter 3. Strategic Analysis Review
3.1. Omega 3 Products Pricing Analysis and Forecast
3.2. Porter’s Five Forces
3.3. Market Ecosystem
3.4. SWOT Analysis
3.5. Regulatory Scenario
3.3. Effects of Inflation, Russia-Ukraine War, moderating economic growth, and other macroeconomic factors
Chapter 4. Competitive Landscape
4.1. Market Share Analysis
4.1.1. Global Omega 3 Products Market Share by Company, 2023
4.1.2. Product Offerings of Leading Omega 3 Products Companies
4.2. Market Entropy
4.2.1. New Product Launches in the Industry
4.2.2. Mergers, Acquisitions, Joint ventures, and Partnerships
4.3. Key Strategies and Best Practices
Chapter 5. Global Market Projections: Best, Reference, and Low Case Scenarios
5.1. Growth Analysis- Case Scenario Definitions
5.2. Low Growth Case Scenario Forecasts
5.3. Reference Growth Case Scenario Forecasts
5.4. High Growth Case Scenario Forecasts
Chapter 6. Market Dynamics
6.1. Omega 3 Products Market Drivers
6.2. Omega 3 Products Market Challenges
6.6. Omega 3 Products Market Opportunities
6.4. Omega 3 Products Market Trends
Chapter 7. Global Omega 3 Products Market Outlook Trends
7.1. Global Omega 3 Products Revenue (USD Million) and CAGR (%) by Type (2021-2032)
7.2. Global Omega 3 Products Revenue (USD Million) and CAGR (%) by Application (2021-2032)
7.3. Global Omega 3 Products Revenue (USD Million) and CAGR (%) by Product (2021-2032)
By Product
Functional Food
Dietary Supplements
Infant Nutrition
Pet Food and Feed
Others
By Distribution Channel
Supermarkets/ Hypermarkets
Drug Stores
Online Retailers
Others
Chapter 8. Global Omega 3 Products Regional Analysis and Outlook
8.1. Global Omega 3 Products Revenue (USD Million) By Regions (2021- 2032)
8.2. North America Omega 3 Products Revenue (USD Million) by Country (2021-2032)
8.2.1. United States Omega 3 Products Regional Analysis and Outlook
8.2.2. Canada Omega 3 Products Regional Analysis and Outlook
8.2.3. Mexico Omega 3 Products Regional Analysis and Outlook
8.3. Europe Omega 3 Products Revenue (USD Million), by Country (2021-2032)
8.3.1. Germany Omega 3 Products Regional Analysis and Outlook
8.3.2. France Omega 3 Products Regional Analysis and Outlook
8.3.3. United Kingdom Omega 3 Products Regional Analysis and Outlook
8.3.4. Spain Omega 3 Products Regional Analysis and Outlook
8.3.5. Italy Omega 3 Products Regional Analysis and Outlook
8.3.6. Russia Omega 3 Products Regional Analysis and Outlook
8.3.7. Rest of Europe Omega 3 Products Regional Analysis and Outlook
8.4. Asia Pacific Omega 3 Products Revenue (USD Million) by Country (2021-2032)
8.4.1. China Omega 3 Products Regional Analysis and Outlook
8.4.2. Japan Omega 3 Products Regional Analysis and Outlook
8.4.3. India Omega 3 Products Regional Analysis and Outlook
8.4.4. South Korea Omega 3 Products Regional Analysis and Outlook
8.4.5. Australia Omega 3 Products Regional Analysis and Outlook
8.4.6. South East Asia Omega 3 Products Regional Analysis and Outlook
8.4.7. Rest of Asia Pacific Omega 3 Products Regional Analysis and Outlook
8.5. South America Omega 3 Products Revenue (USD Million), by Country (2021-2032)
8.5.1. Brazil Omega 3 Products Regional Analysis and Outlook
8.5.2. Argentina Omega 3 Products Regional Analysis and Outlook
8.5.3. Rest of South America Omega 3 Products Regional Analysis and Outlook
8.6. Middle East and Africa Omega 3 Products Revenue (USD Million) by Country (2021-2032)
8.6.1. Middle East Omega 3 Products Regional Analysis and Outlook
8.6.2. Africa Omega 3 Products Regional Analysis and Outlook
Chapter 9. North America Omega 3 Products Analysis and Outlook
9.1. North America Omega 3 Products Revenue (USD Million) by Segments (2021-2032)
9.1.1. North America Omega 3 Products Revenue (USD Million) by Type (2021-2032)
9.1.2. North America Omega 3 Products Revenue (USD Million) by Application (2021-2032)
9.1.3. North America Omega 3 Products Revenue (USD Million) by Product (2021-2032)
By Product
Functional Food
Dietary Supplements
Infant Nutrition
Pet Food and Feed
Others
By Distribution Channel
Supermarkets/ Hypermarkets
Drug Stores
Online Retailers
Others
Chapter 10. Europe Omega 3 Products Analysis and Outlook
10.1. Europe Omega 3 Products Revenue (USD Million), by Segments (USD Million) (2021-2032)
10.1.1. Europe Omega 3 Products Revenue (USD Million) by Type (2021-2032)
10.1.2. Europe Omega 3 Products Revenue (USD Million) by Application (2021-2032)
10.1.3. Europe Omega 3 Products Revenue (USD Million) by Product (2021-2032)
By Product
Functional Food
Dietary Supplements
Infant Nutrition
Pet Food and Feed
Others
By Distribution Channel
Supermarkets/ Hypermarkets
Drug Stores
Online Retailers
Others
Chapter 11. Asia Pacific Omega 3 Products Analysis and Outlook
11.1. Asia Pacific Omega 3 Products Revenue (USD Million), and Revenue (USD Million) by Segments (2021-2032)
11.1.1. Asia Pacific Omega 3 Products Revenue (USD Million) by Type (2021-2032)
11.1.2. Asia Pacific Omega 3 Products Revenue (USD Million) by Application (2021-2032)
11.1.3. Asia Pacific Omega 3 Products Revenue (USD Million) by Product (2021-2032)
By Product
Functional Food
Dietary Supplements
Infant Nutrition
Pet Food and Feed
Others
By Distribution Channel
Supermarkets/ Hypermarkets
Drug Stores
Online Retailers
Others
Chapter 12. South America Omega 3 Products Analysis and Outlook
12.1. South America Omega 3 Products Revenue (USD Million), by Segments (2021-2032)
12.1.1. South America Omega 3 Products Revenue (USD Million) by Type (2021-2032)
12.1.2. South America Omega 3 Products Revenue (USD Million) by Application (2021-2032)
12.1.3. South America Omega 3 Products Revenue (USD Million) by Product (2021-2032)
By Product
Functional Food
Dietary Supplements
Infant Nutrition
Pet Food and Feed
Others
By Distribution Channel
Supermarkets/ Hypermarkets
Drug Stores
Online Retailers
Others
Chapter 13. Middle East and Africa Omega 3 Products Analysis and Outlook
13.1. Middle East and Africa Omega 3 Products Revenue (USD Million), by Segments (2021-2032)
13.1.1. Middle East and Africa Omega 3 Products Revenue (USD Million) by Type (2021-2032)
13.1.2. Middle East and Africa Omega 3 Products Revenue (USD Million) by Application (2021-2032)
13.1.3. Middle East and Africa Omega 3 Products Revenue (USD Million) by Product (2021-2032)
By Product
Functional Food
Dietary Supplements
Infant Nutrition
Pet Food and Feed
Others
By Distribution Channel
Supermarkets/ Hypermarkets
Drug Stores
Online Retailers
Others
Chapter 14. Omega 3 Products Company Profiles
14.1 Business Overview
14.2 Product Profiles
14.3 SWOT Profiles
14.5 Recent Developments
14.6 Financial Profile
List of Companies
Amway Corp
Blackmores Ltd
Cooke Inc
Herbalife Ltd
Natures Crops International
Nestle SA
Quadra Chemicals Inc
Reckitt Benckiser Group PLC
Sanofi SA
Unilever Plc
15. Methodology and Data Sources
15.1 Customization Offerings
15.2 Subscription Services
15.3 Related Reports
15.4 Publisher Expertise
LIST OF TABLES
Table 1 Market Segmentation Analysis
Table 2 Global Omega 3 Products Market Share of Leading Companies, 2023
Table 3 Product Offerings of Leading Companies
Table 4 Low Growth Scenario Forecasts
Table 5 Reference Case Growth Scenario
Table 6 High Growth Case Scenario
Table 7 Global Omega 3 Products Revenue (USD Million) And CAGR (%) By Type (2021-2032)
Table 8 Global Omega 3 Products Revenue (USD Million) And CAGR (%) By Application (2021-2032)
Table 9 Global Omega 3 Products Revenue (USD Million) And CAGR (%) By Product (2021-2032)
Table 10 Global Omega 3 Products Market Revenue (USD Million) By Regions (2021-2032)
Table 11 Global Omega 3 Products Market Share (%) By Regions (2021-2032)
Table 12 North America Omega 3 Products Revenue (USD Million) By Country (2021-2032)
Table 13 Europe Omega 3 Products Revenue (USD Million) By Country (2021-2032)
Table 14 Asia Pacific Omega 3 Products Revenue (USD Million) By Country (2021-2032)
Table 15 South America Omega 3 Products Revenue (USD Million) By Country (2021-2032)
Table 16 Middle East and Africa Omega 3 Products Revenue (USD Million) By Region (2021-2032)
Table 17 North America Omega 3 Products Revenue (USD Million) By Type (2021-2032)
Table 18 North America Omega 3 Products Revenue (USD Million) By Application (2021-2032)
Table 19 North America Omega 3 Products Revenue (USD Million) By Product (2021-2032)
Table 20 Europe Omega 3 Products Revenue (USD Million) By Type (2021-2032)
Table 21 Europe Omega 3 Products Revenue (USD Million) By Application (2021-2032)
Table 22 Europe Omega 3 Products Revenue (USD Million) By Product (2021-2032)
Table 23 Asia Pacific Omega 3 Products Revenue (USD Million) By Type (2021-2032)
Table 24 Asia Pacific Omega 3 Products Revenue (USD Million) By Application (2021-2032)
Table 25 Asia Pacific Omega 3 Products Revenue (USD Million) By Product (2021-2032)
Table 26 South America Omega 3 Products Revenue (USD Million) By Type (2021-2032)
Table 27 South America Omega 3 Products Revenue (USD Million) By Application (2021-2032)
Table 28 South America Omega 3 Products Revenue (USD Million) By Product (2021-2032)
Table 29 Middle East and Africa Omega 3 Products Revenue (USD Million) By Type (2021-2032)
Table 30 Middle East and Africa Omega 3 Products Revenue (USD Million) By Application (2021-2032)
Table 31 Middle East and Africa Omega 3 Products Revenue (USD Million) By Product (2021-2032)
LIST OF FIGURES
Figure 1. Market Scope
Figure 2. Pricing Forecasts Per Unit, 2023- 2032
Figure 3. Porter’s Five Forces
Figure 4. Global Omega 3 Products Market Revenue (USD Million) By Regions (2021-2032)
Figure 5. Global Omega 3 Products Market Share (%) By Regions (2023)
Figure 6. North America Omega 3 Products Revenue (USD Million) By Country (2021-2032)
Figure 7. United States Omega 3 Products Revenue (USD Million) By Country (2021-2032)
Figure 8. Canada Omega 3 Products Revenue (USD Million) By Country (2021-2032)
Figure 9. Mexico Omega 3 Products Revenue (USD Million) By Country (2021-2032)
Figure 10. Europe Omega 3 Products Revenue (USD Million) By Country (2021-2032)
Figure 11. Germany Omega 3 Products Revenue (USD Million) By Country (2021-2032)
Figure 12. France Omega 3 Products Revenue (USD Million) By Country (2021-2032)
Figure 13. United Kingdom Omega 3 Products Revenue (USD Million) By Country (2021-2032)
Figure 14. Spain Omega 3 Products Revenue (USD Million) By Country (2021-2032)
Figure 15. Italy Omega 3 Products Revenue (USD Million) By Country (2021-2032)
Figure 16. Russia Omega 3 Products Revenue (USD Million) By Country (2021-2032)
Figure 17. Rest of Europe Omega 3 Products Revenue (USD Million) By Country (2021-2032)
Figure 11. Asia Pacific Omega 3 Products Revenue (USD Million) By Country (2021-2032)
Figure 12. China Omega 3 Products Revenue (USD Million) By Country (2021-2032)
Figure 13. Japan Omega 3 Products Revenue (USD Million) By Country (2021-2032)
Figure 14. India Omega 3 Products Revenue (USD Million) By Country (2021-2032)
Figure 15. South Korea Omega 3 Products Revenue (USD Million) By Country (2021-2032)
Figure 16. Australia Omega 3 Products Revenue (USD Million) By Country (2021-2032)
Figure 17. South East Asia Omega 3 Products Revenue (USD Million) By Country (2021-2032)
Figure 18. South America Omega 3 Products Revenue (USD Million) By Country (2021-2032)
Figure 19. Brazil Omega 3 Products Revenue (USD Million) By Country (2021-2032)
Figure 20. Argentina Omega 3 Products Revenue (USD Million) By Country (2021-2032)
Figure 21. Rest of Asia Pacific Omega 3 Products Revenue (USD Million) By Country (2021-2032)
Figure 22. Middle East and Africa Omega 3 Products Revenue (USD Million) By Region (2021-2032)
Figure 23. Saudi Arabia Omega 3 Products Revenue (USD Million) By Region (2021-2032)
Figure 24. The UAE Omega 3 Products Revenue (USD Million) By Region (2021-2032)
Figure 25. Rest of Middle East Omega 3 Products Revenue (USD Million) By Region (2021-2032)
Figure 26. South Africa Omega 3 Products Revenue (USD Million) By Region (2021-2032)
Figure 27. Africa Omega 3 Products Revenue (USD Million) By Region (2021-2032)
Figure 28. North America Omega 3 Products Revenue (USD Million) By Type (2021-2032)
Figure 29. North America Omega 3 Products Revenue (USD Million) By Application (2021-2032)
Figure 30. North America Omega 3 Products Revenue (USD Million) By Product (2021-2032)
Figure 31. Europe Omega 3 Products Revenue (USD Million) By Type (2021-2032)
Figure 32. Europe Omega 3 Products Revenue (USD Million) By Application (2021-2032)
Figure 33. Europe Omega 3 Products Revenue (USD Million) By Product (2021-2032)
Figure 34. Asia Pacific Omega 3 Products Revenue (USD Million) By Type (2021-2032)
Figure 35. Asia Pacific Omega 3 Products Revenue (USD Million) By Application (2021-2032)
Figure 36. Asia Pacific Omega 3 Products Revenue (USD Million) By Product (2021-2032)
Figure 37. South America Omega 3 Products Revenue (USD Million) By Type (2021-2032)
Figure 38. South America Omega 3 Products Revenue (USD Million) By Application (2021-2032)
Figure 39. South America Omega 3 Products Revenue (USD Million) By Product (2021-2032)
Figure 40. Middle East and Africa Omega 3 Products Revenue (USD Million) By Type (2021-2032)
Figure 41. Middle East and Africa Omega 3 Products Revenue (USD Million) By Application (2021-2032)
Figure 42. Middle East and Africa Omega 3 Products Revenue (USD Million) By Product (2021-2032)
By Product
Functional Food
Dietary Supplements
Infant Nutrition
Pet Food and Feed
Others
By Distribution Channel
Supermarkets/ Hypermarkets
Drug Stores
Online Retailers
Others
Countries Analyzed
North America (US, Canada, Mexico)
Europe (Germany, UK, France, Spain, Italy, Russia, Rest of Europe)
Asia Pacific (China, India, Japan, South Korea, Australia, South East Asia, Rest of Asia)
South America (Brazil, Argentina, Rest of South America)
Middle East and Africa (Saudi Arabia, UAE, Rest of Middle East, South Africa, Egypt, Rest of Africa)
