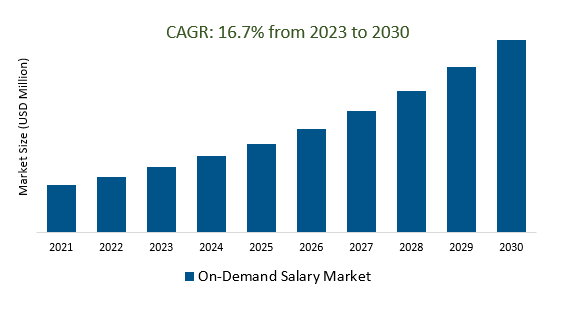
The global on-demand salary market size is poised to register a 16.7% CAGR over the forecast period from 2023 to 2030.
The growing on-demand economy, which is characterized by the prevalence of short-term contracts or freelance work supports the demand for on-demand salary industry. Companies are opting for on-demand salary services to pay their employees based on specific requests, rather than adhering to a fixed monthly pay schedule. The introduction of flexible compensation models and salary advance services to attract a wide employee base is observed across industrial verticals.
The fintech product is gaining wide popularity among both employers and employees owing to flexibility with respect to when they receive their salary. The trend toward technological advancements, emerging demographics, and changing work culture are fueling the market outlook. To cater to the challenges of skilled workforce availability and to manage the growing mismatch between demand for talent and the availability of workers, leading companies are extending employees access to their earned salary instantly.
Market Overview- An Introduction to Global On-Demand Salary in 2023
A large number of startups, in particular, in developing economies, are extending options such as on-demand pay, flexible wage access, and salary on-demand. Further, on-demand salary enables quick movement of funds from the payroll of employers to employee accounts. Having greater financial control via faster access to wages is considered a major motivator for employees to continue their jobs, resulting in lower attrition, lower hiring costs, and a boost in employee morale.
The post-pandemic period is accelerating the adoption of remote work and flexible work arrangements, fueling the market for on-demand salary services. Further, advancements in real-time earnings tracking technology platforms are enabling employees with real-time access to their earnings. Workers could see how much they had earned at any given moment, which can help with budgeting and financial planning.
Further, the rise of the gig economy was driving demand for on-demand salary solutions. Freelancers, gig workers, and independent contractors sought faster access to their earnings as opposed to waiting for invoicing and payment processing. Integration between on-demand salary platforms and human resources (HR) software assists in streamlining payroll processes and ensures accurate and timely payments.
Market Dynamics
Market Drivers- Gig Economy Growth Supports Proliferation of Flexible Work Arrangements
The $510 billion global gig economy comprising of short-term contracts and freelance work continues to grow robustly, at an estimated 15.6% CAGR over the forecast period to 2030. The industry is expanding rapidly from traditional freelancers to professionals who seek flexible payment options that align with their non-traditional work schedules.
On-demand salary services provide these workers with faster access to their earnings, helping them maintain financial stability. On the other hand, companies that leverage on-demand salary solutions tend to attract and retain gig workers more effectively by offering a competitive edge in compensation.
Market Trends- Technology Advancements Enabling Seamless and Instantaneous Payments
Technological advancements remain a key driving force behind the on-demand salary industry, transforming how employees access and manage their earnings. Innovative payment technologies, such as real-time payment networks and blockchain-based systems, enable immediate salary transfers.
The rapid proliferation of mobile Apps and digital wallets is set to shape the future of on-demand salary. Employees can access their earnings conveniently through these platforms, promoting financial empowerment. Further, advanced encryption techniques and secure authentication methods ensure the safety of sensitive financial data in on-demand salary platforms.
In addition, integration with existing human resources (HR) software streamlines payroll processes and reduces administrative burdens for employers, making it easier to adopt on-demand salary solutions.
Market Share Analysis- SMEs to register the fastest growth worldwide
The global on-demand salary market is categorized across small and medium-scale enterprises and large enterprises. Small and Medium-sized Enterprises (SMEs) are expected to spearhead rapid growth in the global on-demand salary market due to their inherent flexibility, adaptability, and resource-conscious attributes.
Small and medium-scale enterprises are increasingly opting for on-demand salary solutions to attract and retain employees. SMEs often seek cost-efficient payroll solutions, and on-demand salary services can significantly reduce administrative burdens and expenses. Furthermore, the employee-centric focus of the on-demand salary solutions and expanding global footprints align well with the advantages offered by on-demand salary platforms.
Market Segmentation
Type
- Basic Subscription Plan
- Premium Subscription Plan
Enterprise
Industry Vertical
- Retail
- Healthcare
- Technology
- Hospitality
- Others
By Region
- North America (United States, Canada, Mexico)
- Europe (Germany, France, United Kingdom, Spain, Italy, Others)
- Asia Pacific (China, India, Japan, South Korea, Australia, Others)
- Latin America (Brazil, Argentina, Others)
- Middle East and Africa (Saudi Arabia, UAE, Kuwait, Other Middle East, South Africa, Nigeria, Other Africa)
Leading Companies
- Gusto, Inc.
- Paychex, Inc.
- Paylocity Corporation
- OnPay, Inc.
- Automatic Data Processing, Inc.
- Rippling, Inc.
- Intuit Inc.
- Deluxe Corporation
- Square, Inc.
- Zenefits, Inc.
- Paycor, Inc.
*List Not Exhaustive
On Demand Salary Market Outlook 2023
1 Market Overview
1.1 Introduction to the On Demand Salary Market
1.2 Scope of the Study
1.3 Research Objective
1.3.1 Key Market Scope and Segments
1.3.2 Players Covered
1.3.3 Years Considered
2 Executive Summary
2.1 2023 On-Demand Salary Industry- Market Statistics
3 Market Dynamics
3.1 Market Drivers
3.2 Market Challenges
3.3 Market Opportunities
3.4 Market Trends
4 Market Factor Analysis
4.1 Porter’s Five Forces
4.2 Market Entropy
4.2.1 Global On Demand Salary Market Companies with Area Served
4.2.2 Products Offerings Global On Demand Salary Market
5 COVID-19 Impact Analysis and Outlook Scenarios
5.1.1 Covid-19 Impact Analysis
5.1.2 Post-COVID-19 Scenario- Low Growth Case
5.1.3 Post-COVID-19 Scenario- Reference Growth Case
5.1.4 Post-COVID-19 Scenario- Low Growth Case
6 Global On Demand Salary Market Trends
6.1 Global On Demand Salary Revenue (USD Million) and CAGR (%) by Type (2018-2030)
6.2 Global On Demand Salary Revenue (USD Million) and CAGR (%) by Applications (2018-2030)
6.3 Global On Demand Salary Revenue (USD Million) and CAGR (%) by Regions (2018-2030)
7 Global On Demand Salary Market Revenue (USD Million) by Type, and Applications (2018-2022)
7.1 Global On Demand Salary Revenue (USD Million) by Type (2018-2022)
7.1.1 Global On Demand Salary Revenue (USD Million), Market Share (%) by Type (2018-2022)
7.2 Global On Demand Salary Revenue (USD Million) by Applications (2018-2022)
7.2.1 Global On Demand Salary Revenue (USD Million), Market Share (%) by Applications (2018-2022)
8 Global On Demand Salary Development Regional Status and Outlook
8.1 Global On Demand Salary Revenue (USD Million) By Regions (2018-2022)
8.2 North America On Demand Salary Revenue (USD Million) by Type, and Application (2018-2022)
8.2.1 North America On Demand Salary Revenue (USD Million) by Country (2018-2022)
8.2.2 North America On Demand Salary Revenue (USD Million) by Type (2018-2022)
8.2.3 North America On Demand Salary Revenue (USD Million) by Applications (2018-2022)
8.3 Europe On Demand Salary Revenue (USD Million), by Type, and Applications (USD Million) (2018-2022)
8.3.1 Europe On Demand Salary Revenue (USD Million), by Country (2018-2022)
8.3.2 Europe On Demand Salary Revenue (USD Million) by Type (2018-2022)
8.3.3 Europe On Demand Salary Revenue (USD Million) by Applications (2018-2022)
8.4 Asia Pacific On Demand Salary Revenue (USD Million), and Revenue (USD Million) by Type, and Applications (2018-2022)
8.4.1 Asia Pacific On Demand Salary Revenue (USD Million) by Country (2018-2022)
8.4.2 Asia Pacific On Demand Salary Revenue (USD Million) by Type (2018-2022)
8.4.3 Asia Pacific On Demand Salary Revenue (USD Million) by Applications (2018-2022)
8.5 South America On Demand Salary Revenue (USD Million), by Type, and Applications (2018-2022)
8.5.1 South America On Demand Salary Revenue (USD Million), by Country (2018-2022)
8.5.2 South America On Demand Salary Revenue (USD Million) by Type (2018-2022)
8.5.3 South America On Demand Salary Revenue (USD Million) by Applications (2018-2022)
8.6 Middle East and Africa On Demand Salary Revenue (USD Million), by Type, Technology, Application, Thickness (2018-2022)
8.6.1 Middle East and Africa On Demand Salary Revenue (USD Million) by Country (2018-2022)
8.6.2 Middle East and Africa On Demand Salary Revenue (USD Million) by Type (2018-2022)
8.6.3 Middle East and Africa On Demand Salary Revenue (USD Million) by Applications (2018-2022)
9 Company Profiles
10 Global On Demand Salary Market Revenue (USD Million), by Type, and Applications (2023-2030)
10.1 Global On Demand Salary Revenue (USD Million) and Market Share (%) by Type (2023-2030)
10.1.1 Global On Demand Salary Revenue (USD Million), and Market Share (%) by Type (2023-2030)
10.2 Global On Demand Salary Revenue (USD Million) and Market Share (%) by Applications (2023-2030)
10.2.1 Global On Demand Salary Revenue (USD Million), and Market Share (%) by Applications (2023-2030)
11 Global On Demand Salary Development Regional Status and Outlook Forecast
11.1 Global On Demand Salary Revenue (USD Million) By Regions (2023-2030)
11.2 North America On Demand Salary Revenue (USD Million) by Type, and Applications (2023-2030)
11.2.1 North America On Demand Salary Revenue (USD) Million by Country (2023-2030)
11.2.2 North America On Demand Salary Revenue (USD Million), by Type (2023-2030)
11.2.3 North America On Demand Salary Revenue (USD Million), Market Share (%) by Applications (2023-2030)
11.3 Europe On Demand Salary Revenue (USD Million), by Type, and Applications (2023-2030)
11.3.1 Europe On Demand Salary Revenue (USD Million), by Country (2023-2030)
11.3.2 Europe On Demand Salary Revenue (USD Million), by Type (2023-2030)
11.3.3 Europe On Demand Salary Revenue (USD Million), by Applications (2023-2030)
11.4 Asia Pacific On Demand Salary Revenue (USD Million) by Type, and Applications (2023-2030)
11.4.1 Asia Pacific On Demand Salary Revenue (USD Million), by Country (2023-2030)
11.4.2 Asia Pacific On Demand Salary Revenue (USD Million), by Type (2023-2030)
11.4.3 Asia Pacific On Demand Salary Revenue (USD Million), by Applications (2023-2030)
11.5 South America On Demand Salary Revenue (USD Million), by Type, and Applications (2023-2030)
11.5.1 South America On Demand Salary Revenue (USD Million), by Country (2023-2030)
11.5.2 South America On Demand Salary Revenue (USD Million), by Type (2023-2030)
11.5.3 South America On Demand Salary Revenue (USD Million), by Applications (2023-2030)
11.6 Middle East and Africa On Demand Salary Revenue (USD Million), by Type, and Applications (2023-2030)
11.6.1 Middle East and Africa On Demand Salary Revenue (USD Million), by Region (2023-2030)
11.6.2 Middle East and Africa On Demand Salary Revenue (USD Million), by Type (2023-2030)
11.6.3 Middle East and Africa On Demand Salary Revenue (USD Million), by Applications (2023-2030)
12 Methodology and Data Sources
12.1 Methodology/Research Approach
12.1.1 Research Programs/Design
12.1.2 Market Size Estimation
12.1.3 Market Breakdown and Data Triangulation
12.2 Data Sources
12.2.1 Secondary Sources
12.2.2 Primary Sources
12.3 Disclaimer
List of Tables
Table 1 Market Segmentation Analysis
Table 2 Global On Demand Salary Market Companies with Areas Served
Table 3 Products Offerings Global On Demand Salary Market
Table 4 Low Growth Scenario Forecasts
Table 5 Reference Case Growth Scenario
Table 6 High Growth Case Scenario
Table 7 Global On Demand Salary Revenue (USD Million) And CAGR (%) By Type (2018-2030)
Table 8 Global On Demand Salary Revenue (USD Million) And CAGR (%) By Applications (2018-2030)
Table 9 Global On Demand Salary Revenue (USD Million) And CAGR (%) By Regions (2018-2030)
Table 10 Global On Demand Salary Revenue (USD Million) By Type (2018-2022)
Table 11 Global On Demand Salary Revenue Market Share (%) By Type (2018-2022)
Table 12 Global On Demand Salary Revenue (USD Million) By Applications (2018-2022)
Table 13 Global On Demand Salary Revenue Market Share (%) By Applications (2018-2022)
Table 14 Global On Demand Salary Market Revenue (USD Million) By Regions (2018-2022)
Table 15 Global On Demand Salary Market Share (%) By Regions (2018-2022)
Table 16 North America On Demand Salary Revenue (USD Million) By Country (2018-2022)
Table 17 North America On Demand Salary Revenue (USD Million) By Type (2018-2022)
Table 18 North America On Demand Salary Revenue (USD Million) By Applications (2018-2022)
Table 19 Europe On Demand Salary Revenue (USD Million) By Country (2018-2022)
Table 20 Europe On Demand Salary Revenue (USD Million) By Type (2018-2022)
Table 21 Europe On Demand Salary Revenue (USD Million) By Applications (2018-2022)
Table 22 Asia Pacific On Demand Salary Revenue (USD Million) By Country (2018-2022)
Table 23 Asia Pacific On Demand Salary Revenue (USD Million) By Type (2018-2022)
Table 24 Asia Pacific On Demand Salary Revenue (USD Million) By Applications (2018-2022)
Table 25 South America On Demand Salary Revenue (USD Million) By Country (2018-2022)
Table 26 South America On Demand Salary Revenue (USD Million) By Type (2018-2022)
Table 27 South America On Demand Salary Revenue (USD Million) By Applications (2018-2022)
Table 28 Middle East and Africa On Demand Salary Revenue (USD Million) By Region (2018-2022)
Table 29 Middle East and Africa On Demand Salary Revenue (USD Million) By Type (2018-2022)
Table 30 Middle East and Africa On Demand Salary Revenue (USD Million) By Applications (2018-2022)
Table 31 Financial Analysis
Table 32 Global On Demand Salary Revenue (USD Million) By Type (2023-2030)
Table 33 Global On Demand Salary Revenue Market Share (%) By Type (2023-2030)
Table 34 Global On Demand Salary Revenue (USD Million) By Applications (2023-2030)
Table 35 Global On Demand Salary Revenue Market Share (%) By Applications (2023-2030)
Table 36 Global On Demand Salary Market Revenue (USD Million), And Revenue (USD Million) By Regions (2023-2030)
Table 37 North America On Demand Salary Revenue (USD)By Country (2023-2030)
Table 38 North America On Demand Salary Revenue (USD Million) By Type (2023-2030)
Table 39 North America On Demand Salary Revenue (USD Million) By Applications (2023-2030)
Table 40 Europe On Demand Salary Revenue (USD Million) By Country (2023-2030)
Table 41 Europe On Demand Salary Revenue (USD Million) By Type (2023-2030)
Table 42 Europe On Demand Salary Revenue (USD Million) By Applications (2023-2030)
Table 43 Asia Pacific On Demand Salary Revenue (USD Million) By Country (2023-2030)
Table 44 Asia Pacific On Demand Salary Revenue (USD Million) By Type (2023-2030)
Table 45 Asia Pacific On Demand Salary Revenue (USD Million) By Applications (2023-2030)
Table 46 South America On Demand Salary Revenue (USD Million) By Country (2023-2030)
Table 47 South America On Demand Salary Revenue (USD Million) By Type (2023-2030)
Table 48 South America On Demand Salary Revenue (USD Million) By Applications (2023-2030)
Table 49 Middle East and Africa On Demand Salary Revenue (USD Million) By Region (2023-2030)
Table 50 Middle East and Africa On Demand Salary Revenue (USD Million) By Region (2023-2030)
Table 51 Middle East and Africa On Demand Salary Revenue (USD Million) By Type (2023-2030)
Table 52 Middle East and Africa On Demand Salary Revenue (USD Million) By Applications (2023-2030)
Table 53 Research Programs/Design for This Report
Table 54 Key Data Information from Secondary Sources
Table 55 Key Data Information from Primary Sources
List of Figures
Figure 1 Market Scope
Figure 2 Porter’s Five Forces
Figure 3 Global On Demand Salary Revenue (USD Million) By Type (2018-2022)
Figure 4 Global On Demand Salary Revenue Market Share (%) By Type (2022)
Figure 5 Global On Demand Salary Revenue (USD Million) By Applications (2018-2022)
Figure 6 Global On Demand Salary Revenue Market Share (%) By Applications (2022)
Figure 7 Global On Demand Salary Market Revenue (USD Million) By Regions (2018-2022)
Figure 8 Global On Demand Salary Market Share (%) By Regions (2022)
Figure 9 North America On Demand Salary Revenue (USD Million) By Country (2018-2022)
Figure 10 North America On Demand Salary Revenue (USD Million) By Type (2018-2022)
Figure 11 North America On Demand Salary Revenue (USD Million) By Applications (2018-2022)
Figure 12 Europe On Demand Salary Revenue (USD Million) By Country (2018-2022)
Figure 13 Europe On Demand Salary Revenue (USD Million) By Type (2018-2022)
Figure 14 Europe On Demand Salary Revenue (USD Million) By Applications (2018-2022)
Figure 15 Asia Pacific On Demand Salary Revenue (USD Million) By Country (2018-2022)
Figure 16 Asia Pacific On Demand Salary Revenue (USD Million) By Type (2018-2022)
Figure 17 Asia Pacific On Demand Salary Revenue (USD Million) By Applications (2018-2022)
Figure 18 South America On Demand Salary Revenue (USD Million) By Country (2018-2022)
Figure 19 South America On Demand Salary Revenue (USD Million) By Type (2018-2022)
Figure 20 South America On Demand Salary Revenue (USD Million) By Applications (2018-2022)
Figure 21 Middle East and Africa On Demand Salary Revenue (USD Million) By Region (2018-2022)
Figure 22 Middle East and Africa On Demand Salary Revenue (USD Million) By Type (2018-2022)
Figure 23 Middle East and Africa On Demand Salary Revenue (USD Million) By Applications (2018-2022)
Figure 24 Global On Demand Salary Revenue (USD Million) By Type (2023-2030)
Figure 25 Global On Demand Salary Revenue Market Share (%) By Type (2030)
Figure 26 Global On Demand Salary Revenue (USD Million) By Applications (2023-2030)
Figure 27 Global On Demand Salary Revenue Market Share (%) By Applications (2030)
Figure 28 Global On Demand Salary Market Revenue (USD Million) By Regions (2023-2030)
Figure 29 North America On Demand Salary Revenue (USD Million) By Country (2023-2030)
Figure 30 North America On Demand Salary Revenue (USD Million) By Type (2023-2030)
Figure 31 North America On Demand Salary Revenue (USD Million) By Applications (2023-2030)
Figure 32 Europe On Demand Salary Revenue (USD Million) By Country (2023-2030)
Figure 33 Europe On Demand Salary Revenue (USD Million) By Type (2023-2030)
Figure 34 Europe On Demand Salary Revenue (USD Million) By Applications (2023-2030)
Figure 35 Asia Pacific On Demand Salary Revenue (USD Million) By Country (2023-2030)
Figure 36 Asia Pacific On Demand Salary Revenue (USD Million) By Type (2023-2030)
Figure 37 Asia Pacific On Demand Salary Revenue (USD Million) By Applications (2023-2030)
Figure 38 South America On Demand Salary Revenue (USD Million) By Country (2023-2030)
Figure 39 South America On Demand Salary Revenue (USD Million) By Type (2023-2030)
Figure 40 South America On Demand Salary Revenue (USD Million) By Applications (2023-2030)
Figure 41 Middle East and Africa On Demand Salary Revenue (USD Million) By Region (2023-2030)
Figure 42 Middle East and Africa On Demand Salary Revenue (USD Million) By Region (2023-2030)
Figure 43 Middle East and Africa On Demand Salary Revenue (USD Million) By Type (2023-2030)
Figure 44 Middle East and Africa On Demand Salary Revenue (USD Million) By Applications (2023-2030)
Figure 45 Bottom-Up and Top-Down Approaches For This Report
Figure 46 Data Triangulation
