
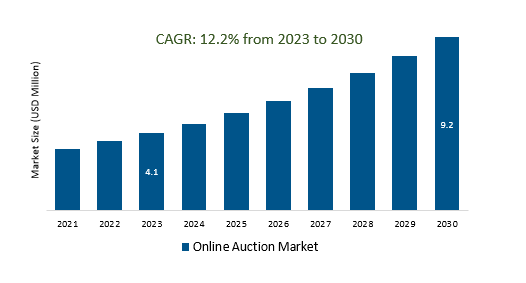
The Global Online Auction Market Size is estimated to be US 4.1 Billion in 2023 and is poised to register 12.2% growth over the forecast period from 2023 to 2030 to reach US $ 9.2 billion in 2030.
The market growth is driven by the increasing use of smartphones and mobile apps, more users are participating in online auctions through their mobile devices. Auction platforms are optimizing their interfaces for mobile use. Leading companies that are focused on E-commerce Integration, Virtual Reality (VR) Global Expansion, Live Streaming and Interactive Auctions, Enhanced Security, Augmented Reality (AR), User Education, and others to boost market shares in the industry.
The online auction market is a digital platform for buying and selling a diverse range of products through competitive bidding. Major players like eBay, Christie's, and Amazon Auctions have a global reach, offering convenience and accessibility. Shifts towards online auctions from traditional in-person formats, mobile accessibility, diverse product offerings, trust-building measures, and the potential integration of emerging technologies like blockchain and AI are key market dynamics. Niche markets and regulatory compliance are also significant considerations in this rapidly evolving market.
Utilizing AI and data analytics in the online auction market offers benefits such as personalized recommendations, improved pricing strategies, fraud detection, real-time market insights, enhanced bidder engagement, inventory management, predictive analytics, user retention, cost efficiency, and marketplace growth, contributing to a more efficient and user-friendly platform for buyers and sellers.
The demand for the cryptocurrency exchange market has increased significantly due to the emergence of blockchain technology and Non-Fungible Tokens (NFTs). Blockchain's role in securing and verifying transactions has boosted confidence in cryptocurrencies, leading to a surge in trading volumes on cryptocurrency exchanges. NFTs, which are often bought and sold using cryptocurrencies, have become a major driver of crypto trading activity as they represent ownership of unique digital assets.
Sustainability is gaining significance in the cryptocurrency exchange market, driven by concerns about energy consumption, carbon emissions, and regulatory compliance. Exchanges are adopting eco-friendly practices, transitioning to energy-efficient consensus mechanisms, and investing in carbon offset initiatives to mitigate their environmental impact amid growing stakeholder pressure and the need to align with sustainability standards.
The Global Online Auction Market is analyzed across Collectibles, Electronics, Artistic goods, Jewellery, and others. Collectibles are poised to register the fastest growth. Collectibles, including rare coins, stamps, vintage toys, sports memorabilia, art, and antiques, play a significant role in the online auction market. These items attract passionate collectors, and online auctions offer a global platform for buying and selling, fostering broad participation and competitive bidding. Collectibles are a vital and dynamic segment within the online auction market, facilitating access to a diverse collector's market.
The Global Online Auction Market is analyzed across various Platforms including Web-based, Application-based, and others. Of these, Application-based held a significant market share in 2023. Developing an online auction market application entails building a user-friendly platform with features like user registration, detailed item listings, real-time bidding, secure payment processing, messaging, advanced search, and admin tools. Prioritize security, trust-building mechanisms, and legal compliance while also considering mobile responsiveness, marketing strategies, analytics, and scalability. A feedback system, customer support, and mobile apps for broader accessibility are essential, with features like payment for featured listings and social sharing adding value. Ultimately, the success of the application hinges on creating a seamless, secure, and engaging environment for users to buy and sell items through auctions.
By Product
By Platform
By Region
*List not exhaustive
Online Auction Market Outlook 2023
1 Market Overview
1.1 Introduction to the Online Auction Market
1.2 Scope of the Study
1.3 Research Objective
1.3.1 Key Market Scope and Segments
1.3.2 Players Covered
1.3.3 Years Considered
2 Executive Summary
2.1 2023 Online Auction - Market Statistics
3 Market Dynamics
3.1 Market Drivers
3.2 Market Challenges
3.3 Market Opportunities
3.4 Market Trends
4 Market Factor Analysis
4.1 Porter’s Five Forces
4.2 Market Entropy
4.2.1 Global Online Auction Market Companies with Area Served
4.2.2 Products Offerings Global Online Auction Market
5 COVID-19 Impact Analysis and Outlook Scenarios
5.1.1 Covid-19 Impact Analysis
5.1.2 post-COVID-19 Scenario- Low Growth Case
5.1.3 post-COVID-19 Scenario- Reference Growth Case
5.1.4 post-COVID-19 Scenario- Low Growth Case
6 Global Online Auction Market Trends
6.1 Global Online Auction Revenue (USD Million) and CAGR (%) by Type (2018-2030)
6.2 Global Online Auction Revenue (USD Million) and CAGR (%) by Applications (2018-2030)
6.3 Global Online Auction Revenue (USD Million) and CAGR (%) by regions (2018-2030)
7 Global Online Auction Market Revenue (USD Million) by Type, and Applications (2018-2022)
7.1 Global Online Auction Revenue (USD Million) by Type (2018-2022)
7.1.1 Global Online Auction Revenue (USD Million), Market Share (%) by Type (2018-2022)
7.2 Global Online Auction Revenue (USD Million) by Applications (2018-2022)
7.2.1 Global Online Auction Revenue (USD Million), Market Share (%) by Applications (2018-2022)
8 Global Online Auction Development Regional Status and Outlook
8.1 Global Online Auction Revenue (USD Million) By Regions (2018-2022)
8.2 North America Online Auction Revenue (USD Million) by Type, and Application (2018-2022)
8.2.1 North America Online Auction Revenue (USD Million) by Country (2018-2022)
8.2.2 North America Online Auction Revenue (USD Million) by Type (2018-2022)
8.2.3 North America Online Auction Revenue (USD Million) by Applications (2018-2022)
8.3 Europe Online Auction Revenue (USD Million), by Type, and Applications (USD Million) (2018-2022)
8.3.1 Europe Online Auction Revenue (USD Million), by Country (2018-2022)
8.3.2 Europe Online Auction Revenue (USD Million) by Type (2018-2022)
8.3.3 Europe Online Auction Revenue (USD Million) by Applications (2018-2022)
8.4 Asia Pacific Online Auction Revenue (USD Million), and Revenue (USD Million) by Type, and Applications (2018-2022)
8.4.1 Asia Pacific Online Auction Revenue (USD Million) by Country (2018-2022)
8.4.2 Asia Pacific Online Auction Revenue (USD Million) by Type (2018-2022)
8.4.3 Asia Pacific Online Auction Revenue (USD Million) by Applications (2018-2022)
8.5 South America Online Auction Revenue (USD Million), by Type, and Applications (2018-2022)
8.5.1 South America Online Auction Revenue (USD Million), by Country (2018-2022)
8.5.2 South America Online Auction Revenue (USD Million) by Type (2018-2022)
8.5.3 South America Online Auction Revenue (USD Million) by Applications (2018-2022)
8.6 Middle East and Africa Online Auction Revenue (USD Million), by Type, Technology, Application, Thickness (2018-2022)
8.6.1 Middle East and Africa Online Auction Revenue (USD Million) by Country (2018-2022)
8.6.2 Middle East and Africa Online Auction Revenue (USD Million) by Type (2018-2022)
8.6.3 Middle East and Africa Online Auction Revenue (USD Million) by Applications (2018-2022)
9 Company Profiles
10 Global Online Auction Market Revenue (USD Million), by Type, and Applications (2023-2030)
10.1 Global Online Auction Revenue (USD Million) and Market Share (%) by Type (2023-2030)
10.1.1 Global Online Auction Revenue (USD Million), and Market Share (%) by Type (2023-2030)
10.2 Global Online Auction Revenue (USD Million) and Market Share (%) by Applications (2023-2030)
10.2.1 Global Online Auction Revenue (USD Million), and Market Share (%) by Applications (2023-2030)
11 Global Online Auction Development Regional Status and Outlook Forecast
11.1 Global Online Auction Revenue (USD Million) By Regions (2023-2030)
11.2 North America Online Auction Revenue (USD Million) by Type, and Applications (2023-2030)
11.2.1 North America Online Auction Revenue (USD) Million by Country (2023-2030)
11.2.2 North America Online Auction Revenue (USD Million), by Type (2023-2030)
11.2.3 North America Online Auction Revenue (USD Million), Market Share (%) by Applications (2023-2030)
11.3 Europe Online Auction Revenue (USD Million), by Type, and Applications (2023-2030)
11.3.1 Europe Online Auction Revenue (USD Million), by Country (2023-2030)
11.3.2 Europe Online Auction Revenue (USD Million), by Type (2023-2030)
11.3.3 Europe Online Auction Revenue (USD Million), by Applications (2023-2030)
11.4 Asia Pacific Online Auction Revenue (USD Million) by Type, and Applications (2023-2030)
11.4.1 Asia Pacific Online Auction Revenue (USD Million), by Country (2023-2030)
11.4.2 Asia Pacific Online Auction Revenue (USD Million), by Type (2023-2030)
11.4.3 Asia Pacific Online Auction Revenue (USD Million), by Applications (2023-2030)
11.5 South America Online Auction Revenue (USD Million), by Type, and Applications (2023-2030)
11.5.1 South America Online Auction Revenue (USD Million), by Country (2023-2030)
11.5.2 South America Online Auction Revenue (USD Million), by Type (2023-2030)
11.5.3 South America Online Auction Revenue (USD Million), by Applications (2023-2030)
11.6 Middle East and Africa Online Auction Revenue (USD Million), by Type, and Applications (2023-2030)
11.6.1 Middle East and Africa Online Auction Revenue (USD Million), by region (2023-2030)
11.6.2 Middle East and Africa Online Auction Revenue (USD Million), by Type (2023-2030)
11.6.3 Middle East and Africa Online Auction Revenue (USD Million), by Applications (2023-2030)
12 Methodology and Data Sources
12.1 Methodology/Research Approach
12.1.1 Research Programs/Design
12.1.2 Market Size Estimation
12.1.3 Market Breakdown and Data Triangulation
12.2 Data Sources
12.2.1 Secondary Sources
12.2.2 Primary Sources
12.3 Disclaimer
List of Tables
Table 1 Market Segmentation Analysis
Table 2 Global Online Auction Market Companies with Areas Served
Table 3 Products Offerings Global Online Auction Market
Table 4 Low Growth Scenario Forecasts
Table 5 Reference Case Growth Scenario
Table 6 High Growth Case Scenario
Table 7 Global Online Auction Revenue (USD Million) And CAGR (%) By Type (2018-2030)
Table 8 Global Online Auction Revenue (USD Million) And CAGR (%) By Applications (2018-2030)
Table 9 Global Online Auction Revenue (USD Million) And CAGR (%) By Regions (2018-2030)
Table 10 Global Online Auction Revenue (USD Million) By Type (2018-2022)
Table 11 Global Online Auction Revenue Market Share (%) By Type (2018-2022)
Table 12 Global Online Auction Revenue (USD Million) By Applications (2018-2022)
Table 13 Global Online Auction Revenue Market Share (%) By Applications (2018-2022)
Table 14 Global Online Auction Market Revenue (USD Million) By Regions (2018-2022)
Table 15 Global Online Auction Market Share (%) By Regions (2018-2022)
Table 16 North America Online Auction Revenue (USD Million) By Country (2018-2022)
Table 17 North America Online Auction Revenue (USD Million) By Type (2018-2022)
Table 18 North America Online Auction Revenue (USD Million) By Applications (2018-2022)
Table 19 Europe Online Auction Revenue (USD Million) By Country (2018-2022)
Table 20 Europe Online Auction Revenue (USD Million) By Type (2018-2022)
Table 21 Europe Online Auction Revenue (USD Million) By Applications (2018-2022)
Table 22 Asia Pacific Online Auction Revenue (USD Million) By Country (2018-2022)
Table 23 Asia Pacific Online Auction Revenue (USD Million) By Type (2018-2022)
Table 24 Asia Pacific Online Auction Revenue (USD Million) By Applications (2018-2022)
Table 25 South America Online Auction Revenue (USD Million) By Country (2018-2022)
Table 26 South America Online Auction Revenue (USD Million) By Type (2018-2022)
Table 27 South America Online Auction Revenue (USD Million) By Applications (2018-2022)
Table 28 Middle East and Africa Online Auction Revenue (USD Million) By Region (2018-2022)
Table 29 Middle East and Africa Online Auction Revenue (USD Million) By Type (2018-2022)
Table 30 Middle East and Africa Online Auction Revenue (USD Million) By Applications (2018-2022)
Table 31 Financial Analysis
Table 32 Global Online Auction Revenue (USD Million) By Type (2023-2030)
Table 33 Global Online Auction Revenue Market Share (%) By Type (2023-2030)
Table 34 Global Online Auction Revenue (USD Million) By Applications (2023-2030)
Table 35 Global Online Auction Revenue Market Share (%) By Applications (2023-2030)
Table 36 Global Online Auction Market Revenue (USD Million), And Revenue (USD Million) By Regions (2023-2030)
Table 37 North America Online Auction Revenue (USD)By Country (2023-2030)
Table 38 North America Online Auction Revenue (USD Million) By Type (2023-2030)
Table 39 North America Online Auction Revenue (USD Million) By Applications (2023-2030)
Table 40 Europe Online Auction Revenue (USD Million) By Country (2023-2030)
Table 41 Europe Online Auction Revenue (USD Million) By Type (2023-2030)
Table 42 Europe Online Auction Revenue (USD Million) By Applications (2023-2030)
Table 43 Asia Pacific Online Auction Revenue (USD Million) By Country (2023-2030)
Table 44 Asia Pacific Online Auction Revenue (USD Million) By Type (2023-2030)
Table 45 Asia Pacific Online Auction Revenue (USD Million) By Applications (2023-2030)
Table 46 South America Online Auction Revenue (USD Million) By Country (2023-2030)
Table 47 South America Online Auction Revenue (USD Million) By Type (2023-2030)
Table 48 South America Online Auction Revenue (USD Million) By Applications (2023-2030)
Table 49 Middle East and Africa Online Auction Revenue (USD Million) By Region (2023-2030)
Table 50 Middle East and Africa Online Auction Revenue (USD Million) By Region (2023-2030)
Table 51 Middle East and Africa Online Auction Revenue (USD Million) By Type (2023-2030)
Table 52 Middle East and Africa Online Auction Revenue (USD Million) By Applications (2023-2030)
Table 53 Research Programs/Design for This Report
Table 54 Key Data Information from Secondary Sources
Table 55 Key Data Information from Primary Sources
List of Figures
Figure 1 Market Scope
Figure 2 Porter’s Five Forces
Figure 3 Global Online Auction Revenue (USD Million) By Type (2018-2022)
Figure 4 Global Online Auction Revenue Market Share (%) By Type (2022)
Figure 5 Global Online Auction Revenue (USD Million) By Applications (2018-2022)
Figure 6 Global Online Auction Revenue Market Share (%) By Applications (2022)
Figure 7 Global Online Auction Market Revenue (USD Million) By Regions (2018-2022)
Figure 8 Global Online Auction Market Share (%) By Regions (2022)
Figure 9 North America Online Auction Revenue (USD Million) By Country (2018-2022)
Figure 10 North America Online Auction Revenue (USD Million) By Type (2018-2022)
Figure 11 North America Online Auction Revenue (USD Million) By Applications (2018-2022)
Figure 12 Europe Online Auction Revenue (USD Million) By Country (2018-2022)
Figure 13 Europe Online Auction Revenue (USD Million) By Type (2018-2022)
Figure 14 Europe Online Auction Revenue (USD Million) By Applications (2018-2022)
Figure 15 Asia Pacific Online Auction Revenue (USD Million) By Country (2018-2022)
Figure 16 Asia Pacific Online Auction Revenue (USD Million) By Type (2018-2022)
Figure 17 Asia Pacific Online Auction Revenue (USD Million) By Applications (2018-2022)
Figure 18 South America Online Auction Revenue (USD Million) By Country (2018-2022)
Figure 19 South America Online Auction Revenue (USD Million) By Type (2018-2022)
Figure 20 South America Online Auction Revenue (USD Million) By Applications (2018-2022)
Figure 21 Middle East and Africa Online Auction Revenue (USD Million) By Region (2018-2022)
Figure 22 Middle East and Africa Online Auction Revenue (USD Million) By Type (2018-2022)
Figure 23 Middle East and Africa Online Auction Revenue (USD Million) By Applications (2018-2022)
Figure 24 Global Online Auction Revenue (USD Million) By Type (2023-2030)
Figure 25 Global Online Auction Revenue Market Share (%) By Type (2030)
Figure 26 Global Online Auction Revenue (USD Million) By Applications (2023-2030)
Figure 27 Global Online Auction Revenue Market Share (%) By Applications (2030)
Figure 28 Global Online Auction Market Revenue (USD Million) By Regions (2023-2030)
Figure 29 North America Online Auction Revenue (USD Million) By Country (2023-2030)
Figure 30 North America Online Auction Revenue (USD Million) By Type (2023-2030)
Figure 31 North America Online Auction Revenue (USD Million) By Applications (2023-2030)
Figure 32 Europe Online Auction Revenue (USD Million) By Country (2023-2030)
Figure 33 Europe Online Auction Revenue (USD Million) By Type (2023-2030)
Figure 34 Europe Online Auction Revenue (USD Million) By Applications (2023-2030)
Figure 35 Asia Pacific Online Auction Revenue (USD Million) By Country (2023-2030)
Figure 36 Asia Pacific Online Auction Revenue (USD Million) By Type (2023-2030)
Figure 37 Asia Pacific Online Auction Revenue (USD Million) By Applications (2023-2030)
Figure 38 South America Online Auction Revenue (USD Million) By Country (2023-2030)
Figure 39 South America Online Auction Revenue (USD Million) By Type (2023-2030)
Figure 40 South America Online Auction Revenue (USD Million) By Applications (2023-2030)
Figure 41 Middle East and Africa Online Auction Revenue (USD Million) By Region (2023-2030)
Figure 42 Middle East and Africa Online Auction Revenue (USD Million) By Region (2023-2030)
Figure 43 Middle East and Africa Online Auction Revenue (USD Million) By Type (2023-2030)
Figure 44 Middle East and Africa Online Auction Revenue (USD Million) By Applications (2023-2030)
Figure 45 Bottom-Up and Top-Down Approaches for This Report
Figure 46 Data Triangulation
By Product
By Platform
By Region