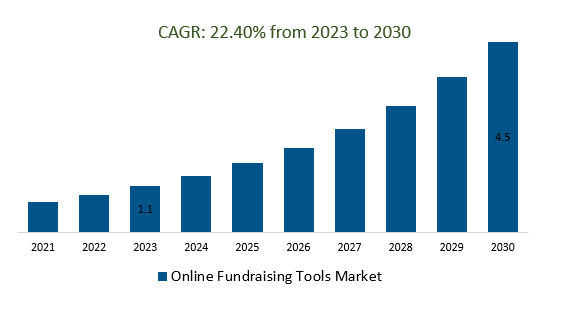
The global Online Fundraising Tools Market Size is estimated to be US$ 1.1 Billion in 2023 and is poised to register 22.4% growth over the forecast period from 2023 to 2030. To reach US $ 4.5 billion in 2030.
The market growth is driven predominantly by the increasing use of smartphones and tablets, online fundraising tools that offer seamless mobile experiences have become essential to capture donations from mobile users. and others to boost market shares in the industry. Leading companies are focusing on the Integration of AI and Machine Learning, Blockchain for Transparency, Global Accessibility, Integration with Ecosystems, Environmental and Humanitarian Crises, and others to boost market shares in the industry.
Market Overview
The online fundraising tools market encompasses digital platforms and software that streamline fundraising efforts for individuals and organizations. It includes crowdfunding platforms, peer-to-peer fundraising software, donation management systems, event fundraising platforms, and mobile apps. Key features comprise customizable campaign pages, secure payment processing, donor management, analytics, and communication tools. Market trends involve digital transformation, mobile accessibility, virtual fundraising, personalization, social media engagement, data-driven decision-making, and global reach.
Market Trends- Companies are launching Digital Transformation to attract a consumer base
Digital transformation in the Online Fundraising Tools Market refers to the significant shift towards using technology-driven solutions to revolutionize how fundraising is conducted. This involves adopting digital platforms, software, and strategies to optimize fundraising efforts for individuals, non-profits, and organizations. Digital transformation encompasses integrating online payment systems, mobile apps, social media engagement, data analytics, and virtual fundraising events, allowing fundraisers to reach a wider audience, enhance donor experiences, and make data-driven decisions for more effective campaigns.
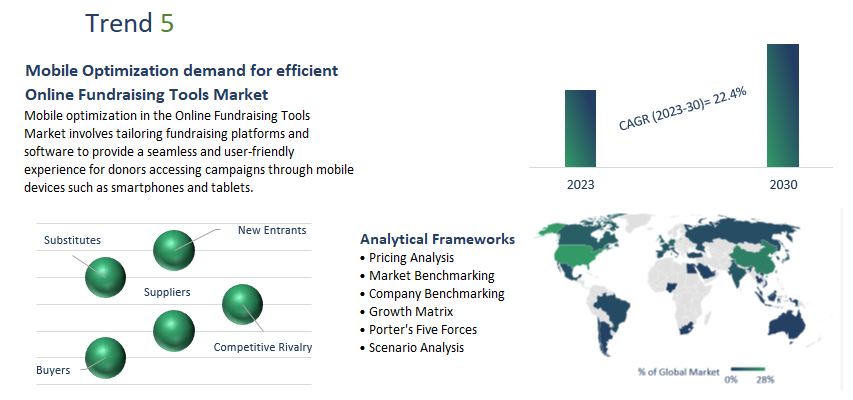
Mobile optimization in the Online Fundraising Tools Market involves tailoring fundraising platforms and software to provide a seamless and user-friendly experience for donors accessing campaigns through mobile devices such as smartphones and tablets. This optimization includes responsive design, intuitive navigation, secure mobile payments, and streamlined donation processes. By catering to the increasing mobile usage trend, fundraisers can tap into a broader audience and enable donors to conveniently contribute enhancing engagement and accessibility in the fundraising process.
Market Opportunity-Introduction of Data Analytics
Data analytics in the Online Fundraising Tools Market refers to using advanced tools and techniques to collect, analyze, and interpret data generated by fundraising campaigns and donor interactions. This process involves tracking donor behaviors, campaign performance, engagement metrics, and donation trends. By harnessing these insights, fundraisers can make informed decisions, optimize strategies, personalize communication, and identify improvement areas, ultimately enhancing fundraising efforts' effectiveness and strengthening donor relationships in a data-driven manner.
Market Share Analysis- Cloud based Online fundraising tools will register fastest growth
The global online fundraising tools market is analyzed across cloud-based and on-premise types. Of these, cloud-based is poised to register the fastest growth. The cloud-based online fundraising tools market encompasses software platforms that facilitate internet-based fundraising activities for organizations, offering features like donation processing, campaign management, donor engagement, and event coordination. Leveraging cloud technology, these tools provide scalability, accessibility, and cost-efficiency advantages.
Market Share Analysis- Individuals held a significant market share in 2023
The global online fundraising tools market is analyzed across a wide range of applications including Individuals, Non-profit Organizations, SMEs, and Large Enterprises. Of these, individuals held a significant market share in 2023. The online fundraising tools market for individuals provides software solutions enabling personal fundraising efforts, offering features such as campaign creation, sharing, and donation processing. These tools, often cloud-based, allow individuals to raise funds for personal causes, events, or emergencies. Platforms like GoFundMe, Kickstarter, and Indiegogo exemplify this market, empowering individuals to easily engage their networks for financial support.
Online fundraising tools Market Segmentation
By Type
By Application
- Individuals
- Non-profit Organizations
- SMEs
- Large Enterprises
By Deployment
By Sales Channel
- Direct Sales
- Distributors
By Region
- North America (United States, Canada, Mexico)
- Europe (Germany, France, United Kingdom, Spain, Italy, Others)
- Asia Pacific (China, India, Japan, South Korea, Australia, Others)
- Latin America (Brazil, Argentina, Others)
- Middle East and Africa (Saudi Arabia, UAE, Kuwait, Other Middle East, South Africa, Nigeria, Other Africa)
Online Fundraising Tools Market Companies
- Qgiv Inc
- Wefunder Advisors LLC
- Double the Donation
- Fundly
- Salsa Labs Inc
- Kickstarter
- Kiva
- NeonCRM
- CiviCRM LLC
- 360 MatchPro
- Aplos Software
- List not exhaustive
Online FundraisingTools Market Outlook 2023
1 Market Overview
1.1 Introduction to the Online FundraisingTools Market
1.2 Scope of the Study
1.3 Research Objective
1.3.1 Key Market Scope and Segments
1.3.2 Players Covered
1.3.3 Years Considered
2 Executive Summary
2.1 2023 Online FundraisingTools Industry- Market Statistics
3 Market Dynamics
3.1 Market Drivers
3.2 Market Challenges
3.3 Market Opportunities
3.4 Market Trends
4 Market Factor Analysis
4.1 Porter’s Five Forces
4.2 Market Entropy
4.2.1 Global Online FundraisingTools Market Companies with Area Served
4.2.2 Products Offerings Global Online FundraisingTools Market
5 COVID-19 Impact Analysis and Outlook Scenarios
5.1.1 Covid-19 Impact Analysis
5.1.2 Post-COVID-19 Scenario- Low Growth Case
5.1.3 Post-COVID-19 Scenario- Reference Growth Case
5.1.4 Post-COVID-19 Scenario- Low Growth Case
6 Global Online FundraisingTools Market Trends
6.1 Global Online FundraisingTools Revenue (USD Million) and CAGR (%) by Type (2018-2030)
6.2 Global Online FundraisingTools Revenue (USD Million) and CAGR (%) by Applications (2018-2030)
6.3 Global Online FundraisingTools Revenue (USD Million) and CAGR (%) by Regions (2018-2030)
7 Global Online FundraisingTools Market Revenue (USD Million) by Type, and Applications (2018-2022)
7.1 Global Online FundraisingTools Revenue (USD Million) by Type (2018-2022)
7.1.1 Global Online FundraisingTools Revenue (USD Million), Market Share (%) by Type (2018-2022)
7.2 Global Online FundraisingTools Revenue (USD Million) by Applications (2018-2022)
7.2.1 Global Online FundraisingTools Revenue (USD Million), Market Share (%) by Applications (2018-2022)
8 Global Online FundraisingTools Development Regional Status and Outlook
8.1 Global Online FundraisingTools Revenue (USD Million) By Regions (2018-2022)
8.2 North America Online FundraisingTools Revenue (USD Million) by Type, and Application (2018-2022)
8.2.1 North America Online FundraisingTools Revenue (USD Million) by Country (2018-2022)
8.2.2 North America Online FundraisingTools Revenue (USD Million) by Type (2018-2022)
8.2.3 North America Online FundraisingTools Revenue (USD Million) by Applications (2018-2022)
8.3 Europe Online FundraisingTools Revenue (USD Million), by Type, and Applications (USD Million) (2018-2022)
8.3.1 Europe Online FundraisingTools Revenue (USD Million), by Country (2018-2022)
8.3.2 Europe Online FundraisingTools Revenue (USD Million) by Type (2018-2022)
8.3.3 Europe Online FundraisingTools Revenue (USD Million) by Applications (2018-2022)
8.4 Asia Pacific Online FundraisingTools Revenue (USD Million), and Revenue (USD Million) by Type, and Applications (2018-2022)
8.4.1 Asia Pacific Online FundraisingTools Revenue (USD Million) by Country (2018-2022)
8.4.2 Asia Pacific Online FundraisingTools Revenue (USD Million) by Type (2018-2022)
8.4.3 Asia Pacific Online FundraisingTools Revenue (USD Million) by Applications (2018-2022)
8.5 South America Online FundraisingTools Revenue (USD Million), by Type, and Applications (2018-2022)
8.5.1 South America Online FundraisingTools Revenue (USD Million), by Country (2018-2022)
8.5.2 South America Online FundraisingTools Revenue (USD Million) by Type (2018-2022)
8.5.3 South America Online FundraisingTools Revenue (USD Million) by Applications (2018-2022)
8.6 Middle East and Africa Online FundraisingTools Revenue (USD Million), by Type, Technology, Application, Thickness (2018-2022)
8.6.1 Middle East and Africa Online FundraisingTools Revenue (USD Million) by Country (2018-2022)
8.6.2 Middle East and Africa Online FundraisingTools Revenue (USD Million) by Type (2018-2022)
8.6.3 Middle East and Africa Online FundraisingTools Revenue (USD Million) by Applications (2018-2022)
9 Company Profiles
10 Global Online FundraisingTools Market Revenue (USD Million), by Type, and Applications (2023-2030)
10.1 Global Online FundraisingTools Revenue (USD Million) and Market Share (%) by Type (2023-2030)
10.1.1 Global Online FundraisingTools Revenue (USD Million), and Market Share (%) by Type (2023-2030)
10.2 Global Online FundraisingTools Revenue (USD Million) and Market Share (%) by Applications (2023-2030)
10.2.1 Global Online FundraisingTools Revenue (USD Million), and Market Share (%) by Applications (2023-2030)
11 Global Online FundraisingTools Development Regional Status and Outlook Forecast
11.1 Global Online FundraisingTools Revenue (USD Million) By Regions (2023-2030)
11.2 North America Online FundraisingTools Revenue (USD Million) by Type, and Applications (2023-2030)
11.2.1 North America Online FundraisingTools Revenue (USD) Million by Country (2023-2030)
11.2.2 North America Online FundraisingTools Revenue (USD Million), by Type (2023-2030)
11.2.3 North America Online FundraisingTools Revenue (USD Million), Market Share (%) by Applications (2023-2030)
11.3 Europe Online FundraisingTools Revenue (USD Million), by Type, and Applications (2023-2030)
11.3.1 Europe Online FundraisingTools Revenue (USD Million), by Country (2023-2030)
11.3.2 Europe Online FundraisingTools Revenue (USD Million), by Type (2023-2030)
11.3.3 Europe Online FundraisingTools Revenue (USD Million), by Applications (2023-2030)
11.4 Asia Pacific Online FundraisingTools Revenue (USD Million) by Type, and Applications (2023-2030)
11.4.1 Asia Pacific Online FundraisingTools Revenue (USD Million), by Country (2023-2030)
11.4.2 Asia Pacific Online FundraisingTools Revenue (USD Million), by Type (2023-2030)
11.4.3 Asia Pacific Online FundraisingTools Revenue (USD Million), by Applications (2023-2030)
11.5 South America Online FundraisingTools Revenue (USD Million), by Type, and Applications (2023-2030)
11.5.1 South America Online FundraisingTools Revenue (USD Million), by Country (2023-2030)
11.5.2 South America Online FundraisingTools Revenue (USD Million), by Type (2023-2030)
11.5.3 South America Online FundraisingTools Revenue (USD Million), by Applications (2023-2030)
11.6 Middle East and Africa Online FundraisingTools Revenue (USD Million), by Type, and Applications (2023-2030)
11.6.1 Middle East and Africa Online FundraisingTools Revenue (USD Million), by Region (2023-2030)
11.6.2 Middle East and Africa Online FundraisingTools Revenue (USD Million), by Type (2023-2030)
11.6.3 Middle East and Africa Online FundraisingTools Revenue (USD Million), by Applications (2023-2030)
12 Methodology and Data Sources
12.1 Methodology/Research Approach
12.1.1 Research Programs/Design
12.1.2 Market Size Estimation
12.1.3 Market Breakdown and Data Triangulation
12.2 Data Sources
12.2.1 Secondary Sources
12.2.2 Primary Sources
12.3 Disclaimer
List Of Tables
Table 1 Market Segmentation Analysis
Table 2 Global Online FundraisingTools Market Companies with Areas Served
Table 3 Products Offerings Global Online FundraisingTools Market
Table 4 Low Growth Scenario Forecasts
Table 5 Reference Case Growth Scenario
Table 6 High Growth Case Scenario
Table 7 Global Online FundraisingTools Revenue (USD Million) And CAGR (%) By Type (2018-2030)
Table 8 Global Online FundraisingTools Revenue (USD Million) And CAGR (%) By Applications (2018-2030)
Table 9 Global Online FundraisingTools Revenue (USD Million) And CAGR (%) By Regions (2018-2030)
Table 10 Global Online FundraisingTools Revenue (USD Million) By Type (2018-2022)
Table 11 Global Online FundraisingTools Revenue Market Share (%) By Type (2018-2022)
Table 12 Global Online FundraisingTools Revenue (USD Million) By Applications (2018-2022)
Table 13 Global Online FundraisingTools Revenue Market Share (%) By Applications (2018-2022)
Table 14 Global Online FundraisingTools Market Revenue (USD Million) By Regions (2018-2022)
Table 15 Global Online FundraisingTools Market Share (%) By Regions (2018-2022)
Table 16 North America Online FundraisingTools Revenue (USD Million) By Country (2018-2022)
Table 17 North America Online FundraisingTools Revenue (USD Million) By Type (2018-2022)
Table 18 North America Online FundraisingTools Revenue (USD Million) By Applications (2018-2022)
Table 19 Europe Online FundraisingTools Revenue (USD Million) By Country (2018-2022)
Table 20 Europe Online FundraisingTools Revenue (USD Million) By Type (2018-2022)
Table 21 Europe Online FundraisingTools Revenue (USD Million) By Applications (2018-2022)
Table 22 Asia Pacific Online FundraisingTools Revenue (USD Million) By Country (2018-2022)
Table 23 Asia Pacific Online FundraisingTools Revenue (USD Million) By Type (2018-2022)
Table 24 Asia Pacific Online FundraisingTools Revenue (USD Million) By Applications (2018-2022)
Table 25 South America Online FundraisingTools Revenue (USD Million) By Country (2018-2022)
Table 26 South America Online FundraisingTools Revenue (USD Million) By Type (2018-2022)
Table 27 South America Online FundraisingTools Revenue (USD Million) By Applications (2018-2022)
Table 28 Middle East and Africa Online FundraisingTools Revenue (USD Million) By Region (2018-2022)
Table 29 Middle East and Africa Online FundraisingTools Revenue (USD Million) By Type (2018-2022)
Table 30 Middle East and Africa Online FundraisingTools Revenue (USD Million) By Applications (2018-2022)
Table 31 Financial Analysis
Table 32 Global Online FundraisingTools Revenue (USD Million) By Type (2023-2030)
Table 33 Global Online FundraisingTools Revenue Market Share (%) By Type (2023-2030)
Table 34 Global Online FundraisingTools Revenue (USD Million) By Applications (2023-2030)
Table 35 Global Online FundraisingTools Revenue Market Share (%) By Applications (2023-2030)
Table 36 Global Online FundraisingTools Market Revenue (USD Million), And Revenue (USD Million) By Regions (2023-2030)
Table 37 North America Online FundraisingTools Revenue (USD)By Country (2023-2030)
Table 38 North America Online FundraisingTools Revenue (USD Million) By Type (2023-2030)
Table 39 North America Online FundraisingTools Revenue (USD Million) By Applications (2023-2030)
Table 40 Europe Online FundraisingTools Revenue (USD Million) By Country (2023-2030)
Table 41 Europe Online FundraisingTools Revenue (USD Million) By Type (2023-2030)
Table 42 Europe Online FundraisingTools Revenue (USD Million) By Applications (2023-2030)
Table 43 Asia Pacific Online FundraisingTools Revenue (USD Million) By Country (2023-2030)
Table 44 Asia Pacific Online FundraisingTools Revenue (USD Million) By Type (2023-2030)
Table 45 Asia Pacific Online FundraisingTools Revenue (USD Million) By Applications (2023-2030)
Table 46 South America Online FundraisingTools Revenue (USD Million) By Country (2023-2030)
Table 47 South America Online FundraisingTools Revenue (USD Million) By Type (2023-2030)
Table 48 South America Online FundraisingTools Revenue (USD Million) By Applications (2023-2030)
Table 49 Middle East and Africa Online FundraisingTools Revenue (USD Million) By Region (2023-2030)
Table 50 Middle East and Africa Online FundraisingTools Revenue (USD Million) By Region (2023-2030)
Table 51 Middle East and Africa Online FundraisingTools Revenue (USD Million) By Type (2023-2030)
Table 52 Middle East and Africa Online FundraisingTools Revenue (USD Million) By Applications (2023-2030)
Table 53 Research Programs/Design for This Report
Table 54 Key Data Information from Secondary Sources
Table 55 Key Data Information from Primary Sources
List Of Figures
Figure 1 Market Scope
Figure 2 Porter’s Five Forces
Figure 3 Global Online FundraisingTools Revenue (USD Million) By Type (2018-2022)
Figure 4 Global Online FundraisingTools Revenue Market Share (%) By Type (2022)
Figure 5 Global Online FundraisingTools Revenue (USD Million) By Applications (2018-2022)
Figure 6 Global Online FundraisingTools Revenue Market Share (%) By Applications (2022)
Figure 7 Global Online FundraisingTools Market Revenue (USD Million) By Regions (2018-2022)
Figure 8 Global Online FundraisingTools Market Share (%) By Regions (2022)
Figure 9 North America Online FundraisingTools Revenue (USD Million) By Country (2018-2022)
Figure 10 North America Online FundraisingTools Revenue (USD Million) By Type (2018-2022)
Figure 11 North America Online FundraisingTools Revenue (USD Million) By Applications (2018-2022)
Figure 12 Europe Online FundraisingTools Revenue (USD Million) By Country (2018-2022)
Figure 13 Europe Online FundraisingTools Revenue (USD Million) By Type (2018-2022)
Figure 14 Europe Online FundraisingTools Revenue (USD Million) By Applications (2018-2022)
Figure 15 Asia Pacific Online FundraisingTools Revenue (USD Million) By Country (2018-2022)
Figure 16 Asia Pacific Online FundraisingTools Revenue (USD Million) By Type (2018-2022)
Figure 17 Asia Pacific Online FundraisingTools Revenue (USD Million) By Applications (2018-2022)
Figure 18 South America Online FundraisingTools Revenue (USD Million) By Country (2018-2022)
Figure 19 South America Online FundraisingTools Revenue (USD Million) By Type (2018-2022)
Figure 20 South America Online FundraisingTools Revenue (USD Million) By Applications (2018-2022)
Figure 21 Middle East and Africa Online FundraisingTools Revenue (USD Million) By Region (2018-2022)
Figure 22 Middle East and Africa Online FundraisingTools Revenue (USD Million) By Type (2018-2022)
Figure 23 Middle East and Africa Online FundraisingTools Revenue (USD Million) By Applications (2018-2022)
Figure 24 Global Online FundraisingTools Revenue (USD Million) By Type (2023-2030)
Figure 25 Global Online FundraisingTools Revenue Market Share (%) By Type (2030)
Figure 26 Global Online FundraisingTools Revenue (USD Million) By Applications (2023-2030)
Figure 27 Global Online FundraisingTools Revenue Market Share (%) By Applications (2030)
Figure 28 Global Online FundraisingTools Market Revenue (USD Million) By Regions (2023-2030)
Figure 29 North America Online FundraisingTools Revenue (USD Million) By Country (2023-2030)
Figure 30 North America Online FundraisingTools Revenue (USD Million) By Type (2023-2030)
Figure 31 North America Online FundraisingTools Revenue (USD Million) By Applications (2023-2030)
Figure 32 Europe Online FundraisingTools Revenue (USD Million) By Country (2023-2030)
Figure 33 Europe Online FundraisingTools Revenue (USD Million) By Type (2023-2030)
Figure 34 Europe Online FundraisingTools Revenue (USD Million) By Applications (2023-2030)
Figure 35 Asia Pacific Online FundraisingTools Revenue (USD Million) By Country (2023-2030)
Figure 36 Asia Pacific Online FundraisingTools Revenue (USD Million) By Type (2023-2030)
Figure 37 Asia Pacific Online FundraisingTools Revenue (USD Million) By Applications (2023-2030)
Figure 38 South America Online FundraisingTools Revenue (USD Million) By Country (2023-2030)
Figure 39 South America Online FundraisingTools Revenue (USD Million) By Type (2023-2030)
Figure 40 South America Online FundraisingTools Revenue (USD Million) By Applications (2023-2030)
Figure 41 Middle East and Africa Online FundraisingTools Revenue (USD Million) By Region (2023-2030)
Figure 42 Middle East and Africa Online FundraisingTools Revenue (USD Million) By Region (2023-2030)
Figure 43 Middle East and Africa Online FundraisingTools Revenue (USD Million) By Type (2023-2030)
Figure 44 Middle East and Africa Online FundraisingTools Revenue (USD Million) By Applications (2023-2030)
Figure 45 Bottom-Up and Top-Down Approaches For This Report
Figure 46 Data Triangulation
