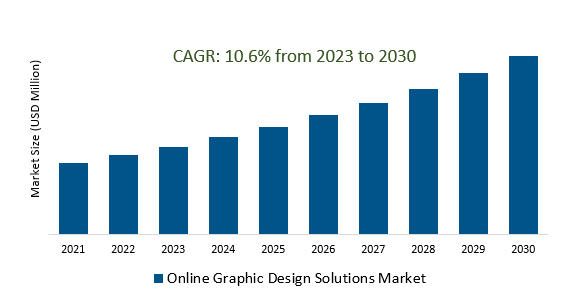
The Global Online Graphic Design Solutions Market Size is estimated to register 10.6% growth over the forecast period from 2023 to 2030.
The market growth is driven by an increasing integration of augmented reality in graphic design solutions is emerging as a trend. AR allows designers to overlay digital graphics onto the real world, providing unique and interactive user experiences. This trend is driven by the desire to create immersive and engaging visual content that goes beyond traditional 2D design. Leading Companies focusing on Virtual Reality (VR) Integration for Design Creation, Blockchain for Design Asset Management, AI-Powered Predictive Design, and others to boost market shares in the industry.
Market Overview
The Online Graphic Design Solutions Market has witnessed substantial growth, driven by the increasing demand for visual content across diverse sectors. User-friendly platforms with cloud-based capabilities have become prevalent, fostering accessibility and collaboration. The integration of artificial intelligence enhances design efficiency, while customization options cater to the rising demand for unique visuals. Collaborative workflows, mobile-friendly designs, and the emergence of niche solutions further characterize this dynamic market.
Market Dynamics
Market Trends- Online graphic design solutions emerge as a powerful tool for visual storytelling, enabling effective communication and engagement in the digital age.
Online graphic design solutions serve as a vital tool for effective visual storytelling, playing a crucial role in enhancing brand identity, driving social media engagement, and empowering content creators. In the digital age, these tools enable individuals and businesses to craft compelling visuals that capture attention in crowded online spaces, adapt to evolving consumer preferences, and catalyze success in e-commerce through eye-catching product representations and marketing materials. The rise of infographics further underscores the significance of these solutions in transforming complex information into shareable narratives, contributing to heightened communication effectiveness across various online platforms.
Market Driver- Cloud-based design solutions democratize graphic design, empowering users to create professional-looking visuals without the need for specialized software or hardware.
Cloud-based design solutions revolutionize graphic design by democratizing access and empowering users to create professional visuals without the constraints of specialized software or hardware. This accessibility not only reduces entry barriers for enthusiasts and small businesses but also enables real-time collaboration, fostering a diverse and inclusive design community. The flexibility offered is particularly advantageous for freelancers and remote workers, ensuring that talent can contribute seamlessly to collaborative projects from anywhere, thereby reshaping the landscape of graphic design to be more accessible, cost-effective, and globally interconnected.
Market Opportunity- AI integration revolutionizes the food delivery app landscape, enhancing personalization, efficiency, and decision-making.
AI integration is reshaping the food delivery app landscape, revolutionizing personalized recommendations for users based on preferences and ordering history. The efficiency of these apps has surged with AI optimizing delivery routes and predicting peak demand times, reducing delivery times and enhancing overall operational efficiency. Real-time data analysis empowers smart decision-making, facilitating dynamic pricing adjustments and improved inventory management. Additionally, AI contributes to enhanced security through continuous monitoring and detection of fraudulent activities. The introduction of AI-powered voice and chatbot assistance further streamlines the ordering process, providing a seamless and interactive user experience, and ultimately transforming the dynamics of the food delivery app market.
Market Share Analysis- Individuals Online Graphic Design Solutions Market will register the fastest growth
The Global Online Graphic Design Solutions Market is analyzed across Enterprises, Individuals, and others. Individuals are poised to register the fastest growth. Individuals play a significant role in the Online Graphic Design Solutions Market, utilizing accessible and user-friendly platforms for personal and professional creative endeavors. These tools empower users, from freelancers to hobbyists, by providing diverse templates, customization options, and collaboration features, democratizing graphic design and eliminating the need for extensive training or expensive software. The market reflects a trend of enabling individuals to express creativity, engage in social media content creation, and pursue entrepreneurial ventures through graphic design.
Market Share Analysis- Cloud-based held a significant market share in 2023
The Global Online Graphic Design Solutions Market is analyzed across various Deployments including On-premises, Cloud-based, and others. Of these, Cloud-based held a significant market share in 2023. The Cloud-based Online Graphic Design Solutions Market signifies a transformative shift in design workflows, offering universal accessibility and real-time collaboration. Users can create and access design tools seamlessly from any location or device, eliminating the need for specialized hardware or software. This approach not only streamlines design processes but also caters to a diverse user base, from individuals to businesses, emphasizing flexibility, scalability, and cost-effectiveness. The market reflects a trend towards more collaborative, accessible, and adaptable graphic design solutions.
Online Graphic Design Solutions Market Segmentation
By Application
- Enterprises
- Individuals
- Others
By Deployment
By Region
- North America (United States, Canada, Mexico)
- Europe (Germany, France, United Kingdom, Spain, Italy, Others)
- Asia Pacific (China, India, Japan, South Korea, Australia, Others)
- Latin America (Brazil, Argentina, Others)
- Middle East and Africa (Saudi Arabia, UAE, Kuwait, Other Middle East, South Africa, Nigeria, Other Africa)
Online Graphic Design Solutions Market Companies
- Adobe
- Design Pickle
- Creatopy
- Snappa
- Designmodo
- Coreldraw
- Pixteller
- Canva
- Crello
- Visme
- Design Wizard
- BeFunky
- Tinkercad
- Gravit Designer
- Vectr
- Sketch
- Vectornator
- Affinity Designer
- Xara
- Pixlr
- Infogram
*List not exhaustive
Online Graphic Design Solutions Market Outlook 2023
1 Market Overview
1.1 Introduction to the Online Graphic Design Solutions Market
1.2 Scope of the Study
1.3 Research Objective
1.3.1 Key Market Scope and Segments
1.3.2 Players Covered
1.3.3 Years Considered
2 Executive Summary
2.1 2023 Online Graphic Design Solutions Industry- Market Statistics
3 Market Dynamics
3.1 Market Drivers
3.2 Market Challenges
3.3 Market Opportunities
3.4 Market Trends
4 Market Factor Analysis
4.1 Porter’s Five Forces
4.2 Market Entropy
4.2.1 Global Online Graphic Design Solutions Market Companies with Area Served
4.2.2 Products Offerings Global Online Graphic Design Solutions Market
5 COVID-19 Impact Analysis and Outlook Scenarios
5.1.1 Covid-19 Impact Analysis
5.1.2 post-COVID-19 Scenario- Low Growth Case
5.1.3 post-COVID-19 Scenario- Reference Growth Case
5.1.4 post-COVID-19 Scenario- Low Growth Case
6 Global Online Graphic Design Solutions Market Trends
6.1 Global Online Graphic Design Solutions Revenue (USD Million) and CAGR (%) by Type (2018-2030)
6.2 Global Online Graphic Design Solutions Revenue (USD Million) and CAGR (%) by Applications (2018-2030)
6.3 Global Online Graphic Design Solutions Revenue (USD Million) and CAGR (%) by regions (2018-2030)
7 Global Online Graphic Design Solutions Market Revenue (USD Million) by Type, and Applications (2018-2022)
7.1 Global Online Graphic Design Solutions Revenue (USD Million) by Type (2018-2022)
7.1.1 Global Online Graphic Design Solutions Revenue (USD Million), Market Share (%) by Type (2018-2022)
7.2 Global Online Graphic Design Solutions Revenue (USD Million) by Applications (2018-2022)
7.2.1 Global Online Graphic Design Solutions Revenue (USD Million), Market Share (%) by Applications (2018-2022)
8 Global Online Graphic Design Solutions Development Regional Status and Outlook
8.1 Global Online Graphic Design Solutions Revenue (USD Million) By Regions (2018-2022)
8.2 North America Online Graphic Design Solutions Revenue (USD Million) by Type, and Application (2018-2022)
8.2.1 North America Online Graphic Design Solutions Revenue (USD Million) by Country (2018-2022)
8.2.2 North America Online Graphic Design Solutions Revenue (USD Million) by Type (2018-2022)
8.2.3 North America Online Graphic Design Solutions Revenue (USD Million) by Applications (2018-2022)
8.3 Europe Online Graphic Design Solutions Revenue (USD Million), by Type, and Applications (USD Million) (2018-2022)
8.3.1 Europe Online Graphic Design Solutions Revenue (USD Million), by Country (2018-2022)
8.3.2 Europe Online Graphic Design Solutions Revenue (USD Million) by Type (2018-2022)
8.3.3 Europe Online Graphic Design Solutions Revenue (USD Million) by Applications (2018-2022)
8.4 Asia Pacific Online Graphic Design Solutions Revenue (USD Million), and Revenue (USD Million) by Type, and Applications (2018-2022)
8.4.1 Asia Pacific Online Graphic Design Solutions Revenue (USD Million) by Country (2018-2022)
8.4.2 Asia Pacific Online Graphic Design Solutions Revenue (USD Million) by Type (2018-2022)
8.4.3 Asia Pacific Online Graphic Design Solutions Revenue (USD Million) by Applications (2018-2022)
8.5 South America Online Graphic Design Solutions Revenue (USD Million), by Type, and Applications (2018-2022)
8.5.1 South America Online Graphic Design Solutions Revenue (USD Million), by Country (2018-2022)
8.5.2 South America Online Graphic Design Solutions Revenue (USD Million) by Type (2018-2022)
8.5.3 South America Online Graphic Design Solutions Revenue (USD Million) by Applications (2018-2022)
8.6 Middle East and Africa Online Graphic Design Solutions Revenue (USD Million), by Type, Technology, Application, Thickness (2018-2022)
8.6.1 Middle East and Africa Online Graphic Design Solutions Revenue (USD Million) by Country (2018-2022)
8.6.2 Middle East and Africa Online Graphic Design Solutions Revenue (USD Million) by Type (2018-2022)
8.6.3 Middle East and Africa Online Graphic Design Solutions Revenue (USD Million) by Applications (2018-2022)
9 Company Profiles
10 Global Online Graphic Design Solutions Market Revenue (USD Million), by Type, and Applications (2023-2030)
10.1 Global Online Graphic Design Solutions Revenue (USD Million) and Market Share (%) by Type (2023-2030)
10.1.1 Global Online Graphic Design Solutions Revenue (USD Million), and Market Share (%) by Type (2023-2030)
10.2 Global Online Graphic Design Solutions Revenue (USD Million) and Market Share (%) by Applications (2023-2030)
10.2.1 Global Online Graphic Design Solutions Revenue (USD Million), and Market Share (%) by Applications (2023-2030)
11 Global Online Graphic Design Solutions Development Regional Status and Outlook Forecast
11.1 Global Online Graphic Design Solutions Revenue (USD Million) By Regions (2023-2030)
11.2 North America Online Graphic Design Solutions Revenue (USD Million) by Type, and Applications (2023-2030)
11.2.1 North America Online Graphic Design Solutions Revenue (USD) Million by Country (2023-2030)
11.2.2 North America Online Graphic Design Solutions Revenue (USD Million), by Type (2023-2030)
11.2.3 North America Online Graphic Design Solutions Revenue (USD Million), Market Share (%) by Applications (2023-2030)
11.3 Europe Online Graphic Design Solutions Revenue (USD Million), by Type, and Applications (2023-2030)
11.3.1 Europe Online Graphic Design Solutions Revenue (USD Million), by Country (2023-2030)
11.3.2 Europe Online Graphic Design Solutions Revenue (USD Million), by Type (2023-2030)
11.3.3 Europe Online Graphic Design Solutions Revenue (USD Million), by Applications (2023-2030)
11.4 Asia Pacific Online Graphic Design Solutions Revenue (USD Million) by Type, and Applications (2023-2030)
11.4.1 Asia Pacific Online Graphic Design Solutions Revenue (USD Million), by Country (2023-2030)
11.4.2 Asia Pacific Online Graphic Design Solutions Revenue (USD Million), by Type (2023-2030)
11.4.3 Asia Pacific Online Graphic Design Solutions Revenue (USD Million), by Applications (2023-2030)
11.5 South America Online Graphic Design Solutions Revenue (USD Million), by Type, and Applications (2023-2030)
11.5.1 South America Online Graphic Design Solutions Revenue (USD Million), by Country (2023-2030)
11.5.2 South America Online Graphic Design Solutions Revenue (USD Million), by Type (2023-2030)
11.5.3 South America Online Graphic Design Solutions Revenue (USD Million), by Applications (2023-2030)
11.6 Middle East and Africa Online Graphic Design Solutions Revenue (USD Million), by Type, and Applications (2023-2030)
11.6.1 Middle East and Africa Online Graphic Design Solutions Revenue (USD Million), by region (2023-2030)
11.6.2 Middle East and Africa Online Graphic Design Solutions Revenue (USD Million), by Type (2023-2030)
11.6.3 Middle East and Africa Online Graphic Design Solutions Revenue (USD Million), by Applications (2023-2030)
12 Methodology and Data Sources
12.1 Methodology/Research Approach
12.1.1 Research Programs/Design
12.1.2 Market Size Estimation
12.1.3 Market Breakdown and Data Triangulation
12.2 Data Sources
12.2.1 Secondary Sources
12.2.2 Primary Sources
12.3 Disclaimer
List of Tables
Table 1 Market Segmentation Analysis
Table 2 Global Online Graphic Design Solutions Market Companies with Areas Served
Table 3 Products Offerings Global Online Graphic Design Solutions Market
Table 4 Low Growth Scenario Forecasts
Table 5 Reference Case Growth Scenario
Table 6 High Growth Case Scenario
Table 7 Global Online Graphic Design Solutions Revenue (USD Million) And CAGR (%) By Type (2018-2030)
Table 8 Global Online Graphic Design Solutions Revenue (USD Million) And CAGR (%) By Applications (2018-2030)
Table 9 Global Online Graphic Design Solutions Revenue (USD Million) And CAGR (%) By Regions (2018-2030)
Table 10 Global Online Graphic Design Solutions Revenue (USD Million) By Type (2018-2022)
Table 11 Global Online Graphic Design Solutions Revenue Market Share (%) By Type (2018-2022)
Table 12 Global Online Graphic Design Solutions Revenue (USD Million) By Applications (2018-2022)
Table 13 Global Online Graphic Design Solutions Revenue Market Share (%) By Applications (2018-2022)
Table 14 Global Online Graphic Design Solutions Market Revenue (USD Million) By Regions (2018-2022)
Table 15 Global Online Graphic Design Solutions Market Share (%) By Regions (2018-2022)
Table 16 North America Online Graphic Design Solutions Revenue (USD Million) By Country (2018-2022)
Table 17 North America Online Graphic Design Solutions Revenue (USD Million) By Type (2018-2022)
Table 18 North America Online Graphic Design Solutions Revenue (USD Million) By Applications (2018-2022)
Table 19 Europe Online Graphic Design Solutions Revenue (USD Million) By Country (2018-2022)
Table 20 Europe Online Graphic Design Solutions Revenue (USD Million) By Type (2018-2022)
Table 21 Europe Online Graphic Design Solutions Revenue (USD Million) By Applications (2018-2022)
Table 22 Asia Pacific Online Graphic Design Solutions Revenue (USD Million) By Country (2018-2022)
Table 23 Asia Pacific Online Graphic Design Solutions Revenue (USD Million) By Type (2018-2022)
Table 24 Asia Pacific Online Graphic Design Solutions Revenue (USD Million) By Applications (2018-2022)
Table 25 South America Online Graphic Design Solutions Revenue (USD Million) By Country (2018-2022)
Table 26 South America Online Graphic Design Solutions Revenue (USD Million) By Type (2018-2022)
Table 27 South America Online Graphic Design Solutions Revenue (USD Million) By Applications (2018-2022)
Table 28 Middle East and Africa Online Graphic Design Solutions Revenue (USD Million) By Region (2018-2022)
Table 29 Middle East and Africa Online Graphic Design Solutions Revenue (USD Million) By Type (2018-2022)
Table 30 Middle East and Africa Online Graphic Design Solutions Revenue (USD Million) By Applications (2018-2022)
Table 31 Financial Analysis
Table 32 Global Online Graphic Design Solutions Revenue (USD Million) By Type (2023-2030)
Table 33 Global Online Graphic Design Solutions Revenue Market Share (%) By Type (2023-2030)
Table 34 Global Online Graphic Design Solutions Revenue (USD Million) By Applications (2023-2030)
Table 35 Global Online Graphic Design Solutions Revenue Market Share (%) By Applications (2023-2030)
Table 36 Global Online Graphic Design Solutions Market Revenue (USD Million), And Revenue (USD Million) By Regions (2023-2030)
Table 37 North America Online Graphic Design Solutions Revenue (USD)By Country (2023-2030)
Table 38 North America Online Graphic Design Solutions Revenue (USD Million) By Type (2023-2030)
Table 39 North America Online Graphic Design Solutions Revenue (USD Million) By Applications (2023-2030)
Table 40 Europe Online Graphic Design Solutions Revenue (USD Million) By Country (2023-2030)
Table 41 Europe Online Graphic Design Solutions Revenue (USD Million) By Type (2023-2030)
Table 42 Europe Online Graphic Design Solutions Revenue (USD Million) By Applications (2023-2030)
Table 43 Asia Pacific Online Graphic Design Solutions Revenue (USD Million) By Country (2023-2030)
Table 44 Asia Pacific Online Graphic Design Solutions Revenue (USD Million) By Type (2023-2030)
Table 45 Asia Pacific Online Graphic Design Solutions Revenue (USD Million) By Applications (2023-2030)
Table 46 South America Online Graphic Design Solutions Revenue (USD Million) By Country (2023-2030)
Table 47 South America Online Graphic Design Solutions Revenue (USD Million) By Type (2023-2030)
Table 48 South America Online Graphic Design Solutions Revenue (USD Million) By Applications (2023-2030)
Table 49 Middle East and Africa Online Graphic Design Solutions Revenue (USD Million) By Region (2023-2030)
Table 50 Middle East and Africa Online Graphic Design Solutions Revenue (USD Million) By Region (2023-2030)
Table 51 Middle East and Africa Online Graphic Design Solutions Revenue (USD Million) By Type (2023-2030)
Table 52 Middle East and Africa Online Graphic Design Solutions Revenue (USD Million) By Applications (2023-2030)
Table 53 Research Programs/Design for This Report
Table 54 Key Data Information from Secondary Sources
Table 55 Key Data Information from Primary Sources
List of Figures
Figure 1 Market Scope
Figure 2 Porter’s Five Forces
Figure 3 Global Online Graphic Design Solutions Revenue (USD Million) By Type (2018-2022)
Figure 4 Global Online Graphic Design Solutions Revenue Market Share (%) By Type (2022)
Figure 5 Global Online Graphic Design Solutions Revenue (USD Million) By Applications (2018-2022)
Figure 6 Global Online Graphic Design Solutions Revenue Market Share (%) By Applications (2022)
Figure 7 Global Online Graphic Design Solutions Market Revenue (USD Million) By Regions (2018-2022)
Figure 8 Global Online Graphic Design Solutions Market Share (%) By Regions (2022)
Figure 9 North America Online Graphic Design Solutions Revenue (USD Million) By Country (2018-2022)
Figure 10 North America Online Graphic Design Solutions Revenue (USD Million) By Type (2018-2022)
Figure 11 North America Online Graphic Design Solutions Revenue (USD Million) By Applications (2018-2022)
Figure 12 Europe Online Graphic Design Solutions Revenue (USD Million) By Country (2018-2022)
Figure 13 Europe Online Graphic Design Solutions Revenue (USD Million) By Type (2018-2022)
Figure 14 Europe Online Graphic Design Solutions Revenue (USD Million) By Applications (2018-2022)
Figure 15 Asia Pacific Online Graphic Design Solutions Revenue (USD Million) By Country (2018-2022)
Figure 16 Asia Pacific Online Graphic Design Solutions Revenue (USD Million) By Type (2018-2022)
Figure 17 Asia Pacific Online Graphic Design Solutions Revenue (USD Million) By Applications (2018-2022)
Figure 18 South America Online Graphic Design Solutions Revenue (USD Million) By Country (2018-2022)
Figure 19 South America Online Graphic Design Solutions Revenue (USD Million) By Type (2018-2022)
Figure 20 South America Online Graphic Design Solutions Revenue (USD Million) By Applications (2018-2022)
Figure 21 Middle East and Africa Online Graphic Design Solutions Revenue (USD Million) By Region (2018-2022)
Figure 22 Middle East and Africa Online Graphic Design Solutions Revenue (USD Million) By Type (2018-2022)
Figure 23 Middle East and Africa Online Graphic Design Solutions Revenue (USD Million) By Applications (2018-2022)
Figure 24 Global Online Graphic Design Solutions Revenue (USD Million) By Type (2023-2030)
Figure 25 Global Online Graphic Design Solutions Revenue Market Share (%) By Type (2030)
Figure 26 Global Online Graphic Design Solutions Revenue (USD Million) By Applications (2023-2030)
Figure 27 Global Online Graphic Design Solutions Revenue Market Share (%) By Applications (2030)
Figure 28 Global Online Graphic Design Solutions Market Revenue (USD Million) By Regions (2023-2030)
Figure 29 North America Online Graphic Design Solutions Revenue (USD Million) By Country (2023-2030)
Figure 30 North America Online Graphic Design Solutions Revenue (USD Million) By Type (2023-2030)
Figure 31 North America Online Graphic Design Solutions Revenue (USD Million) By Applications (2023-2030)
Figure 32 Europe Online Graphic Design Solutions Revenue (USD Million) By Country (2023-2030)
Figure 33 Europe Online Graphic Design Solutions Revenue (USD Million) By Type (2023-2030)
Figure 34 Europe Online Graphic Design Solutions Revenue (USD Million) By Applications (2023-2030)
Figure 35 Asia Pacific Online Graphic Design Solutions Revenue (USD Million) By Country (2023-2030)
Figure 36 Asia Pacific Online Graphic Design Solutions Revenue (USD Million) By Type (2023-2030)
Figure 37 Asia Pacific Online Graphic Design Solutions Revenue (USD Million) By Applications (2023-2030)
Figure 38 South America Online Graphic Design Solutions Revenue (USD Million) By Country (2023-2030)
Figure 39 South America Online Graphic Design Solutions Revenue (USD Million) By Type (2023-2030)
Figure 40 South America Online Graphic Design Solutions Revenue (USD Million) By Applications (2023-2030)
Figure 41 Middle East and Africa Online Graphic Design Solutions Revenue (USD Million) By Region (2023-2030)
Figure 42 Middle East and Africa Online Graphic Design Solutions Revenue (USD Million) By Region (2023-2030)
Figure 43 Middle East and Africa Online Graphic Design Solutions Revenue (USD Million) By Type (2023-2030)
Figure 44 Middle East and Africa Online Graphic Design Solutions Revenue (USD Million) By Applications (2023-2030)
Figure 45 Bottom-Up and Top-Down Approaches for This Report
Figure 46 Data Triangulation
