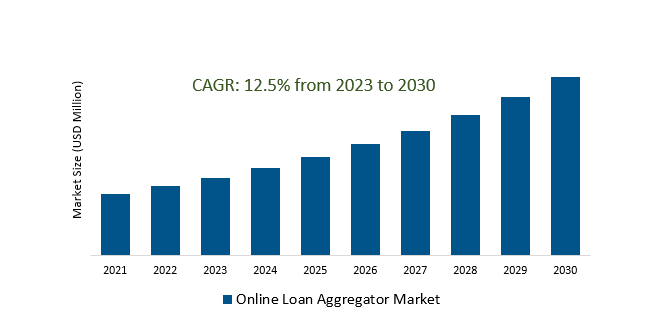
The Online Loan Aggregator Market is estimated to register 12.5% growth over the forecast period from 2023 to 2030.
Online Loan Aggregator Market Overview
The growing number of internet users and smartphone penetration is expanding the potential customer base for online loan aggregators, allowing them to reach a wider audience. Additionally, the integration of AI and machine learning technologies are streamlining processes and improved decision-making, enhancing the overall customer experience. The accelerated digitalization of financial services, where consumers increasingly seek convenience in accessing various loan products online is driving the market growth. Aggregators are providing a platform where borrowers can compare multiple loan options from different lenders, encouraging competitive loan offerings in terms of interest rates, terms, and flexibility. With changing lifestyles and financial needs, there is a growing demand for quick and hassle-free access to credit, which online loan aggregators fulfill by offering a range of loan options. Loan aggregators are contributing to financial inclusion by catering to individuals or businesses with limited access to traditional banking services, thereby reaching underserved or underbanked populations.
Online Loan Aggregator Market Dynamics
Market Trends- Rising Internet Penetration and Smartphone Adoption are driving the Online Loan Aggregator Market.
With more people gaining access to the internet and using smartphones as primary devices, the market is experiencing a fundamental shift in consumer behavior towards seeking financial services online.
Loan aggregator platforms are focusing on mobile optimization, ensuring user-friendly interfaces and apps that cater to the preferences of on-the-go consumers.
Further, the prevalence of smartphones and rising internet penetration is allowing larger audiences to easily apply for loans, compare options, and manage their finances through dedicated mobile applications.
Market Driver- Surging demand for personal loans propels growth in the Online Loan Aggregator Market.
Changing financial landscapes of consumers, who increasingly turn to personal loans for various purposes such as consolidating debts, handling unforeseen expenses, or financing major purchases are the primary drivers.
The flexibility inherent with the evolving preferences of borrowers, who prefer the speed, convenience, and transparency offered by online loan aggregator platforms are fueling the demand.
Additionally, the preference for digital platforms and the ease of accessing loans online are driving the use of online loan aggregators to secure personal loans conveniently.
Market Opportunity- Extending Online Loan Services to Underserved Populations is Broadening Market Reach.
Aggregators are expanding their offerings, providing tailored loan products that meet the unique needs of underserved demographics.
Additionally, partnerships with microfinance institutions or non-banking entities, enabling loan aggregators to offer loans with favorable terms to those who might not meet the criteria of conventional financial institutions are driving the market growth.
With societal and regulatory pushes for greater equality in financial access, positioning online loan aggregators as facilitators of economic empowerment while simultaneously fueling the business growth through the exploration of untapped markets. T
Market Share Analysis- Personal Loan will register the fastest growth.
The Online Loan Aggregator Market is analyzed across Auto Loan, Gold Loan, Personal Loan, Education Loan, Mortgage/Home Loans & Credit Card Loan. Personal Loan is poised to register the fastest growth. These loans cater to individual borrowers seeking funds for various personal needs, ranging from consolidating debts to covering unexpected expenses or making significant purchases. Online loan aggregators play a pivotal role in this domain by providing a convenient platform for borrowers to access a diverse array of personal loan options from multiple lenders. This digital accessibility enables borrowers to compare interest rates, terms, and loan amounts, empowering them to make informed decisions tailored to their specific financial situations. The appeal of personal loans lies in their flexibility, often not requiring collateral and providing relatively quick approval processes compared to other loan types. By providing accessible and transparent lending options, loan aggregators contribute to broader financial access, serving individuals who might have limited access to traditional banking services.
Market Share Analysis- Website Platform held a significant market share in 2023.
The Online Loan Aggregator Market is analyzed across various technologies including Website Platform & CRM Platform. Of these, Website Platform held a significant market share in 2023. This platform functions as the virtual storefront, providing an interface where borrowers can explore, compare, and access a wide array of loan products conveniently and efficiently. The design and functionality of these websites significantly impact user engagement and conversion rates. A well-structured website platform not only showcases diverse loan options but also ensures user-friendly navigation, intuitive interfaces, and informative content that assists borrowers in making informed decisions. Features such as loan calculators, comparison tools, and streamlined application processes enhance user experience, driving user retention and fostering trust among borrowers. Additionally, these platforms often incorporate security measures to safeguard sensitive borrower information, further instilling confidence in the borrowing process.
Online Loan Aggregator Market Segmentation
By Business Model
- Lead Generation Model
- End-to-End Customer Acquisition Process
By Loan Type
- Auto Loan
- Gold Loan
- Personal Loan
- Education Loan
- Mortgage/Home Loans
- Credit Card Loan
By Technology
- Website Platform
- CRM Platform
By End User
- Personal Use
- Business Use
By Region
- North America (United States, Canada, Mexico)
- Europe (Germany, France, United Kingdom, Spain, Italy, Others)
- Asia Pacific (China, India, Japan, South Korea, Australia, Others)
- Latin America (Brazil, Argentina, Others)
- Middle East and Africa (Saudi Arabia, UAE, Kuwait, Other Middle East, South Africa, Nigeria, Other Africa)
Online Loan Aggregator Market companies
- Credible Operations Inc (United States)
- Fundera (United States)
- LoanAdda (India)
- Credit Sesame (United States)
- BankBazaar.com (India)
- iMoney (Malaysia)
- Square Capital (India)
- CreditEase (China)
- Dianrong (China)
- Lufax (China)
- RateSetter (United Kingdom)
- OneMain Financial (United States)
- Dot Zinc Limited (England)
- Money Super Market (United Kingdom)
- YallaCompare (UAE)
- Souqalmal (UAE)
- Paisa Bazaar (India)
*List not exhaustive
Online Loan Aggregator Market Outlook 2023
1 Market Overview
1.1 Introduction to the Online Loan Aggregator Market
1.2 Scope of the Study
1.3 Research Objective
1.3.1 Key Market Scope and Segments
1.3.2 Players Covered
1.3.3 Years Considered
2 Executive Summary
2.1 2023 Online Loan Aggregator Industry- Market Statistics
3 Market Dynamics
3.1 Market Drivers
3.2 Market Challenges
3.3 Market Opportunities
3.4 Market Trends
4 Market Factor Analysis
4.1 Porter’s Five Forces
4.2 Market Entropy
4.2.1 Global Online Loan Aggregator Market Companies with Area Served
4.2.2 Products Offerings Global Online Loan Aggregator Market
5 COVID-19 Impact Analysis and Outlook Scenarios
5.1.1 Covid-19 Impact Analysis
5.1.2 post-COVID-19 Scenario- Low Growth Case
5.1.3 post-COVID-19 Scenario- Reference Growth Case
5.1.4 post-COVID-19 Scenario- Low Growth Case
6 Global Online Loan Aggregator Market Trends
6.1 Global Online Loan Aggregator Revenue (USD Million) and CAGR (%) by Type (2018-2030)
6.2 Global Online Loan Aggregator Revenue (USD Million) and CAGR (%) by Applications (2018-2030)
6.3 Global Online Loan Aggregator Revenue (USD Million) and CAGR (%) by regions (2018-2030)
7 Global Online Loan Aggregator Market Revenue (USD Million) by Type, and Applications (2018-2022)
7.1 Global Online Loan Aggregator Revenue (USD Million) by Type (2018-2022)
7.1.1 Global Online Loan Aggregator Revenue (USD Million), Market Share (%) by Type (2018-2022)
7.2 Global Online Loan Aggregator Revenue (USD Million) by Applications (2018-2022)
7.2.1 Global Online Loan Aggregator Revenue (USD Million), Market Share (%) by Applications (2018-2022)
8 Global Online Loan Aggregator Development Regional Status and Outlook
8.1 Global Online Loan Aggregator Revenue (USD Million) By Regions (2018-2022)
8.2 North America Online Loan Aggregator Revenue (USD Million) by Type, and Application (2018-2022)
8.2.1 North America Online Loan Aggregator Revenue (USD Million) by Country (2018-2022)
8.2.2 North America Online Loan Aggregator Revenue (USD Million) by Type (2018-2022)
8.2.3 North America Online Loan Aggregator Revenue (USD Million) by Applications (2018-2022)
8.3 Europe Online Loan Aggregator Revenue (USD Million), by Type, and Applications (USD Million) (2018-2022)
8.3.1 Europe Online Loan Aggregator Revenue (USD Million), by Country (2018-2022)
8.3.2 Europe Online Loan Aggregator Revenue (USD Million) by Type (2018-2022)
8.3.3 Europe Online Loan Aggregator Revenue (USD Million) by Applications (2018-2022)
8.4 Asia Pacific Online Loan Aggregator Revenue (USD Million), and Revenue (USD Million) by Type, and Applications (2018-2022)
8.4.1 Asia Pacific Online Loan Aggregator Revenue (USD Million) by Country (2018-2022)
8.4.2 Asia Pacific Online Loan Aggregator Revenue (USD Million) by Type (2018-2022)
8.4.3 Asia Pacific Online Loan Aggregator Revenue (USD Million) by Applications (2018-2022)
8.5 South America Online Loan Aggregator Revenue (USD Million), by Type, and Applications (2018-2022)
8.5.1 South America Online Loan Aggregator Revenue (USD Million), by Country (2018-2022)
8.5.2 South America Online Loan Aggregator Revenue (USD Million) by Type (2018-2022)
8.5.3 South America Online Loan Aggregator Revenue (USD Million) by Applications (2018-2022)
8.6 Middle East and Africa Online Loan Aggregator Revenue (USD Million), by Type, Technology, Application, Thickness (2018-2022)
8.6.1 Middle East and Africa Online Loan Aggregator Revenue (USD Million) by Country (2018-2022)
8.6.2 Middle East and Africa Online Loan Aggregator Revenue (USD Million) by Type (2018-2022)
8.6.3 Middle East and Africa Online Loan Aggregator Revenue (USD Million) by Applications (2018-2022)
9 Company Profiles
10 Global Online Loan Aggregator Market Revenue (USD Million), by Type, and Applications (2023-2030)
10.1 Global Online Loan Aggregator Revenue (USD Million) and Market Share (%) by Type (2023-2030)
10.1.1 Global Online Loan Aggregator Revenue (USD Million), and Market Share (%) by Type (2023-2030)
10.2 Global Online Loan Aggregator Revenue (USD Million) and Market Share (%) by Applications (2023-2030)
10.2.1 Global Online Loan Aggregator Revenue (USD Million), and Market Share (%) by Applications (2023-2030)
11 Global Online Loan Aggregator Development Regional Status and Outlook Forecast
11.1 Global Online Loan Aggregator Revenue (USD Million) By Regions (2023-2030)
11.2 North America Online Loan Aggregator Revenue (USD Million) by Type, and Applications (2023-2030)
11.2.1 North America Online Loan Aggregator Revenue (USD) Million by Country (2023-2030)
11.2.2 North America Online Loan Aggregator Revenue (USD Million), by Type (2023-2030)
11.2.3 North America Online Loan Aggregator Revenue (USD Million), Market Share (%) by Applications (2023-2030)
11.3 Europe Online Loan Aggregator Revenue (USD Million), by Type, and Applications (2023-2030)
11.3.1 Europe Online Loan Aggregator Revenue (USD Million), by Country (2023-2030)
11.3.2 Europe Online Loan Aggregator Revenue (USD Million), by Type (2023-2030)
11.3.3 Europe Online Loan Aggregator Revenue (USD Million), by Applications (2023-2030)
11.4 Asia Pacific Online Loan Aggregator Revenue (USD Million) by Type, and Applications (2023-2030)
11.4.1 Asia Pacific Online Loan Aggregator Revenue (USD Million), by Country (2023-2030)
11.4.2 Asia Pacific Online Loan Aggregator Revenue (USD Million), by Type (2023-2030)
11.4.3 Asia Pacific Online Loan Aggregator Revenue (USD Million), by Applications (2023-2030)
11.5 South America Online Loan Aggregator Revenue (USD Million), by Type, and Applications (2023-2030)
11.5.1 South America Online Loan Aggregator Revenue (USD Million), by Country (2023-2030)
11.5.2 South America Online Loan Aggregator Revenue (USD Million), by Type (2023-2030)
11.5.3 South America Online Loan Aggregator Revenue (USD Million), by Applications (2023-2030)
11.6 Middle East and Africa Online Loan Aggregator Revenue (USD Million), by Type, and Applications (2023-2030)
11.6.1 Middle East and Africa Online Loan Aggregator Revenue (USD Million), by region (2023-2030)
11.6.2 Middle East and Africa Online Loan Aggregator Revenue (USD Million), by Type (2023-2030)
11.6.3 Middle East and Africa Online Loan Aggregator Revenue (USD Million), by Applications (2023-2030)
12 Methodology and Data Sources
12.1 Methodology/Research Approach
12.1.1 Research Programs/Design
12.1.2 Market Size Estimation
12.1.3 Market Breakdown and Data Triangulation
12.2 Data Sources
12.2.1 Secondary Sources
12.2.2 Primary Sources
12.3 Disclaimer
List of Tables
Table 1 Market Segmentation Analysis
Table 2 Global Online Loan Aggregator Market Companies with Areas Served
Table 3 Products Offerings Global Online Loan Aggregator Market
Table 4 Low Growth Scenario Forecasts
Table 5 Reference Case Growth Scenario
Table 6 High Growth Case Scenario
Table 7 Global Online Loan Aggregator Revenue (USD Million) And CAGR (%) By Type (2018-2030)
Table 8 Global Online Loan Aggregator Revenue (USD Million) And CAGR (%) By Applications (2018-2030)
Table 9 Global Online Loan Aggregator Revenue (USD Million) And CAGR (%) By Regions (2018-2030)
Table 10 Global Online Loan Aggregator Revenue (USD Million) By Type (2018-2022)
Table 11 Global Online Loan Aggregator Revenue Market Share (%) By Type (2018-2022)
Table 12 Global Online Loan Aggregator Revenue (USD Million) By Applications (2018-2022)
Table 13 Global Online Loan Aggregator Revenue Market Share (%) By Applications (2018-2022)
Table 14 Global Online Loan Aggregator Market Revenue (USD Million) By Regions (2018-2022)
Table 15 Global Online Loan Aggregator Market Share (%) By Regions (2018-2022)
Table 16 North America Online Loan Aggregator Revenue (USD Million) By Country (2018-2022)
Table 17 North America Online Loan Aggregator Revenue (USD Million) By Type (2018-2022)
Table 18 North America Online Loan Aggregator Revenue (USD Million) By Applications (2018-2022)
Table 19 Europe Online Loan Aggregator Revenue (USD Million) By Country (2018-2022)
Table 20 Europe Online Loan Aggregator Revenue (USD Million) By Type (2018-2022)
Table 21 Europe Online Loan Aggregator Revenue (USD Million) By Applications (2018-2022)
Table 22 Asia Pacific Online Loan Aggregator Revenue (USD Million) By Country (2018-2022)
Table 23 Asia Pacific Online Loan Aggregator Revenue (USD Million) By Type (2018-2022)
Table 24 Asia Pacific Online Loan Aggregator Revenue (USD Million) By Applications (2018-2022)
Table 25 South America Online Loan Aggregator Revenue (USD Million) By Country (2018-2022)
Table 26 South America Online Loan Aggregator Revenue (USD Million) By Type (2018-2022)
Table 27 South America Online Loan Aggregator Revenue (USD Million) By Applications (2018-2022)
Table 28 Middle East and Africa Online Loan Aggregator Revenue (USD Million) By Region (2018-2022)
Table 29 Middle East and Africa Online Loan Aggregator Revenue (USD Million) By Type (2018-2022)
Table 30 Middle East and Africa Online Loan Aggregator Revenue (USD Million) By Applications (2018-2022)
Table 31 Financial Analysis
Table 32 Global Online Loan Aggregator Revenue (USD Million) By Type (2023-2030)
Table 33 Global Online Loan Aggregator Revenue Market Share (%) By Type (2023-2030)
Table 34 Global Online Loan Aggregator Revenue (USD Million) By Applications (2023-2030)
Table 35 Global Online Loan Aggregator Revenue Market Share (%) By Applications (2023-2030)
Table 36 Global Online Loan Aggregator Market Revenue (USD Million), And Revenue (USD Million) By Regions (2023-2030)
Table 37 North America Online Loan Aggregator Revenue (USD)By Country (2023-2030)
Table 38 North America Online Loan Aggregator Revenue (USD Million) By Type (2023-2030)
Table 39 North America Online Loan Aggregator Revenue (USD Million) By Applications (2023-2030)
Table 40 Europe Online Loan Aggregator Revenue (USD Million) By Country (2023-2030)
Table 41 Europe Online Loan Aggregator Revenue (USD Million) By Type (2023-2030)
Table 42 Europe Online Loan Aggregator Revenue (USD Million) By Applications (2023-2030)
Table 43 Asia Pacific Online Loan Aggregator Revenue (USD Million) By Country (2023-2030)
Table 44 Asia Pacific Online Loan Aggregator Revenue (USD Million) By Type (2023-2030)
Table 45 Asia Pacific Online Loan Aggregator Revenue (USD Million) By Applications (2023-2030)
Table 46 South America Online Loan Aggregator Revenue (USD Million) By Country (2023-2030)
Table 47 South America Online Loan Aggregator Revenue (USD Million) By Type (2023-2030)
Table 48 South America Online Loan Aggregator Revenue (USD Million) By Applications (2023-2030)
Table 49 Middle East and Africa Online Loan Aggregator Revenue (USD Million) By Region (2023-2030)
Table 50 Middle East and Africa Online Loan Aggregator Revenue (USD Million) By Region (2023-2030)
Table 51 Middle East and Africa Online Loan Aggregator Revenue (USD Million) By Type (2023-2030)
Table 52 Middle East and Africa Online Loan Aggregator Revenue (USD Million) By Applications (2023-2030)
Table 53 Research Programs/Design for This Report
Table 54 Key Data Information from Secondary Sources
Table 55 Key Data Information from Primary Sources
List of Figures
Figure 1 Market Scope
Figure 2 Porter’s Five Forces
Figure 3 Global Online Loan Aggregator Revenue (USD Million) By Type (2018-2022)
Figure 4 Global Online Loan Aggregator Revenue Market Share (%) By Type (2022)
Figure 5 Global Online Loan Aggregator Revenue (USD Million) By Applications (2018-2022)
Figure 6 Global Online Loan Aggregator Revenue Market Share (%) By Applications (2022)
Figure 7 Global Online Loan Aggregator Market Revenue (USD Million) By Regions (2018-2022)
Figure 8 Global Online Loan Aggregator Market Share (%) By Regions (2022)
Figure 9 North America Online Loan Aggregator Revenue (USD Million) By Country (2018-2022)
Figure 10 North America Online Loan Aggregator Revenue (USD Million) By Type (2018-2022)
Figure 11 North America Online Loan Aggregator Revenue (USD Million) By Applications (2018-2022)
Figure 12 Europe Online Loan Aggregator Revenue (USD Million) By Country (2018-2022)
Figure 13 Europe Online Loan Aggregator Revenue (USD Million) By Type (2018-2022)
Figure 14 Europe Online Loan Aggregator Revenue (USD Million) By Applications (2018-2022)
Figure 15 Asia Pacific Online Loan Aggregator Revenue (USD Million) By Country (2018-2022)
Figure 16 Asia Pacific Online Loan Aggregator Revenue (USD Million) By Type (2018-2022)
Figure 17 Asia Pacific Online Loan Aggregator Revenue (USD Million) By Applications (2018-2022)
Figure 18 South America Online Loan Aggregator Revenue (USD Million) By Country (2018-2022)
Figure 19 South America Online Loan Aggregator Revenue (USD Million) By Type (2018-2022)
Figure 20 South America Online Loan Aggregator Revenue (USD Million) By Applications (2018-2022)
Figure 21 Middle East and Africa Online Loan Aggregator Revenue (USD Million) By Region (2018-2022)
Figure 22 Middle East and Africa Online Loan Aggregator Revenue (USD Million) By Type (2018-2022)
Figure 23 Middle East and Africa Online Loan Aggregator Revenue (USD Million) By Applications (2018-2022)
Figure 24 Global Online Loan Aggregator Revenue (USD Million) By Type (2023-2030)
Figure 25 Global Online Loan Aggregator Revenue Market Share (%) By Type (2030)
Figure 26 Global Online Loan Aggregator Revenue (USD Million) By Applications (2023-2030)
Figure 27 Global Online Loan Aggregator Revenue Market Share (%) By Applications (2030)
Figure 28 Global Online Loan Aggregator Market Revenue (USD Million) By Regions (2023-2030)
Figure 29 North America Online Loan Aggregator Revenue (USD Million) By Country (2023-2030)
Figure 30 North America Online Loan Aggregator Revenue (USD Million) By Type (2023-2030)
Figure 31 North America Online Loan Aggregator Revenue (USD Million) By Applications (2023-2030)
Figure 32 Europe Online Loan Aggregator Revenue (USD Million) By Country (2023-2030)
Figure 33 Europe Online Loan Aggregator Revenue (USD Million) By Type (2023-2030)
Figure 34 Europe Online Loan Aggregator Revenue (USD Million) By Applications (2023-2030)
Figure 35 Asia Pacific Online Loan Aggregator Revenue (USD Million) By Country (2023-2030)
Figure 36 Asia Pacific Online Loan Aggregator Revenue (USD Million) By Type (2023-2030)
Figure 37 Asia Pacific Online Loan Aggregator Revenue (USD Million) By Applications (2023-2030)
Figure 38 South America Online Loan Aggregator Revenue (USD Million) By Country (2023-2030)
Figure 39 South America Online Loan Aggregator Revenue (USD Million) By Type (2023-2030)
Figure 40 South America Online Loan Aggregator Revenue (USD Million) By Applications (2023-2030)
Figure 41 Middle East and Africa Online Loan Aggregator Revenue (USD Million) By Region (2023-2030)
Figure 42 Middle East and Africa Online Loan Aggregator Revenue (USD Million) By Region (2023-2030)
Figure 43 Middle East and Africa Online Loan Aggregator Revenue (USD Million) By Type (2023-2030)
Figure 44 Middle East and Africa Online Loan Aggregator Revenue (USD Million) By Applications (2023-2030)
Figure 45 Bottom-Up and Top-Down Approaches for This Report
Figure 46 Data Triangulation
