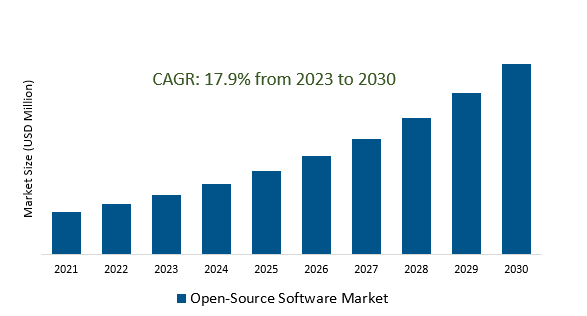
The Open-Source Software Market Size is estimated to register 17.9% growth over the forecast period from 2023 to 2030.
Open-Source Software Market Overview
Increasing adoption of open-source software by enterprises across various industries due to its cost-effectiveness, flexibility, and the community-driven development model. Rising popularity of cloud-native technologies are leading to the development and use of these solutions optimized for cloud environments, such as Kubernetes, Prometheus, and Istio, reflecting the demand for scalable and flexible software infrastructures. Emergence of projects related to blockchain and cryptocurrencies, facilitating the development of decentralized applications, smart contracts, and digital currencies are driving the market growth. Businesses are modifying and tailoring open-source solutions to suit their specific needs, enabling them to create bespoke applications and tools, providing greater flexibility and customization options. The collaborative nature encouraging innovation driven by a diverse community of developers worldwide, leading to rapid advancements, new features, and constant improvements are increasing the revenue.
Open-Source Software Market Dynamics
Market Trends- The Evolution of Cloud-Native Open-Source Software in the Open-Source Software Market.
The shift towards cloud-native architectures, emphasizing scalability, resilience, and portability are propelling the development and adoption of open-source solutions tailored for cloud environments.
Projects like Kubernetes are becoming foundational, enabling efficient management and scaling of containerized applications. Furthermore, the rise of microservices architecture is raising the demand to facilitate the development, deployment, and maintenance of distributed, loosely coupled applications.
The continuous expansion of DevOps practices and the integration of Continuous Integration/Continuous Deployment (CI/CD) pipelines are fueling the demand for automate workflows, enhance collaboration, and streamline software delivery.
Market Driver- Enhanced Security and Risk Management Measures drives the market demand.
Heightened awareness of cybersecurity threats is steering a sharper focus on risk management strategies, driving the market growth. Projects powered by a global community of developers, undergoing continuous scrutiny and peer reviews are contributing to the identification and swift resolution of security flaws.
Organizations are recognizing the importance of ensuring robust security protocols, encouraging the implementation of thorough code review processes, vulnerability assessments, and proactive security practices.
Furthermore, collaborations and initiatives, such as bug bounty programs, security audits, and dedicated security teams, reinforcing the commitment to fortifying security are rapidly increasing the market.
Market Opportunity- Facilitating Aspects of Transparency and Control in the Open-Source Software Market.
The rising demand for control over software assets are leading to a drive for OSS solutions that offer greater autonomy to organizations. Further, increasingly complexity with software components being developed and maintained by multiple organizations are driving the demand.
The emphasis on community-driven development and open collaboration are fostering greater visibility into codebases, allowing users and developers to inspect and modify, thereby ensuring transparency in the development process.
The pursuit of increased visibility, community collaboration, customization capabilities, regulatory compliance, and licensing structures are collectively fueling the demand.
Market Share Analysis - BSD (Berkeley Source Distribution) will register the fastest growth.
The Open-Source Software is analyzed across Shareware, Bundled Software & BSD. he Berkeley Software Distribution (BSD) holds a significant position as an open-source Unix-like operating system known for its flexibility, stability, and permissive licensing. Its growth within the OSS Market is attributed to its robustness, security features, and adaptability across diverse environments, from servers to embedded systems. Further, its permissive licensing, allowing users extensive freedom to modify and redistribute code are fostering a vibrant community-driven development model, attracting contributors and users alike. This operating system's continuous evolution, backed by its dedicated community and its use in critical infrastructures, underlines its significance and growing presence within the broader landscape of Open-Source Software.
Market Share Analysis- Large Size Enterprises held a significant market share in 2023
The Open-Source Software is analyzed across various Organizations including SMEs, Large Enterprises, and others. Of these, Large Size Enterprises held a significant market share in 2023. These enterprises, with substantial budgets and complex operational needs, harness OSS for its scalability, adaptability, and customization capabilities. Open-source solutions empower Large Size Enterprises to tailor software applications to specific organizational demands, allowing for flexibility in modifying codebases, integrating systems, and creating bespoke solutions. Collaborating with the open-source community enables large organizations to influence the direction of OSS development, aligning solutions more closely with their business requirements. Further, the ability to access high-quality software without substantial licensing costs allows for more extensive adoption and deployment across various departments and domains within these organizations.
Open-Source Software Segmentation
By Type
- Shareware
- Bundled Software
- BSD (Berkeley Source Distribution)
By Application
- Professional Services
- Managed Services
By Organisation Size
- SMEs
- Large Size Enterprises
By End User
- Banking
- Healthcare
- Retail
- Manufacturing
By Region
- North America (United States, Canada, Mexico)
- Europe (Germany, France, United Kingdom, Spain, Italy, Others)
- Asia Pacific (China, India, Japan, South Korea, Australia, Others)
- Latin America (Brazil, Argentina, Others)
- Middle East and Africa (Saudi Arabia, UAE, Kuwait, Other Middle East, South Africa, Nigeria, Other Africa)
Open-Source Software Companies
- Canonical Ltd (United Kingdom)
- Red Hat (United States)
- IBM (United States)
- SUSE (Germany)
- Mozilla Corporation (United States)
- MySQL AB (Sweden)
- The Apache Software Foundation (United States)
- Eclipse Foundation (Canada)
- KDE (Germany)
- MariaDB Corporation (Finland)
- Nginx (Russia)
- Python Software Foundation (United States)
- TYPO3 (Germany)
- The Linux Foundation (United States)
*List not exhaustive
Open-Source Software Market Outlook 2023
1 Market Overview
1.1 Introduction to the Open-Source Software Market
1.2 Scope of the Study
1.3 Research Objective
1.3.1 Key Market Scope and Segments
1.3.2 Players Covered
1.3.3 Years Considered
2 Executive Summary
2.1 2023 Open-Source Software Industry- Market Statistics
3 Market Dynamics
3.1 Market Drivers
3.2 Market Challenges
3.3 Market Opportunities
3.4 Market Trends
4 Market Factor Analysis
4.1 Porter’s Five Forces
4.2 Market Entropy
4.2.1 Global Open-Source Software Market Companies with Area Served
4.2.2 Products Offerings Global Open-Source Software Market
5 COVID-19 Impact Analysis and Outlook Scenarios
5.1.1 Covid-19 Impact Analysis
5.1.2 post-COVID-19 Scenario- Low Growth Case
5.1.3 post-COVID-19 Scenario- Reference Growth Case
5.1.4 post-COVID-19 Scenario- Low Growth Case
6 Global Open-Source Software Market Trends
6.1 Global Open-Source Software Revenue (USD Million) and CAGR (%) by Type (2018-2030)
6.2 Global Open-Source Software Revenue (USD Million) and CAGR (%) by Applications (2018-2030)
6.3 Global Open-Source Software Revenue (USD Million) and CAGR (%) by regions (2018-2030)
7 Global Open-Source Software Market Revenue (USD Million) by Type, and Applications (2018-2022)
7.1 Global Open-Source Software Revenue (USD Million) by Type (2018-2022)
7.1.1 Global Open-Source Software Revenue (USD Million), Market Share (%) by Type (2018-2022)
7.2 Global Open-Source Software Revenue (USD Million) by Applications (2018-2022)
7.2.1 Global Open-Source Software Revenue (USD Million), Market Share (%) by Applications (2018-2022)
8 Global Open-Source Software Development Regional Status and Outlook
8.1 Global Open-Source Software Revenue (USD Million) By Regions (2018-2022)
8.2 North America Open-Source Software Revenue (USD Million) by Type, and Application (2018-2022)
8.2.1 North America Open-Source Software Revenue (USD Million) by Country (2018-2022)
8.2.2 North America Open-Source Software Revenue (USD Million) by Type (2018-2022)
8.2.3 North America Open-Source Software Revenue (USD Million) by Applications (2018-2022)
8.3 Europe Open-Source Software Revenue (USD Million), by Type, and Applications (USD Million) (2018-2022)
8.3.1 Europe Open-Source Software Revenue (USD Million), by Country (2018-2022)
8.3.2 Europe Open-Source Software Revenue (USD Million) by Type (2018-2022)
8.3.3 Europe Open-Source Software Revenue (USD Million) by Applications (2018-2022)
8.4 Asia Pacific Open-Source Software Revenue (USD Million), and Revenue (USD Million) by Type, and Applications (2018-2022)
8.4.1 Asia Pacific Open-Source Software Revenue (USD Million) by Country (2018-2022)
8.4.2 Asia Pacific Open-Source Software Revenue (USD Million) by Type (2018-2022)
8.4.3 Asia Pacific Open-Source Software Revenue (USD Million) by Applications (2018-2022)
8.5 South America Open-Source Software Revenue (USD Million), by Type, and Applications (2018-2022)
8.5.1 South America Open-Source Software Revenue (USD Million), by Country (2018-2022)
8.5.2 South America Open-Source Software Revenue (USD Million) by Type (2018-2022)
8.5.3 South America Open-Source Software Revenue (USD Million) by Applications (2018-2022)
8.6 Middle East and Africa Open-Source Software Revenue (USD Million), by Type, Technology, Application, Thickness (2018-2022)
8.6.1 Middle East and Africa Open-Source Software Revenue (USD Million) by Country (2018-2022)
8.6.2 Middle East and Africa Open-Source Software Revenue (USD Million) by Type (2018-2022)
8.6.3 Middle East and Africa Open-Source Software Revenue (USD Million) by Applications (2018-2022)
9 Company Profiles
10 Global Open-Source Software Market Revenue (USD Million), by Type, and Applications (2023-2030)
10.1 Global Open-Source Software Revenue (USD Million) and Market Share (%) by Type (2023-2030)
10.1.1 Global Open-Source Software Revenue (USD Million), and Market Share (%) by Type (2023-2030)
10.2 Global Open-Source Software Revenue (USD Million) and Market Share (%) by Applications (2023-2030)
10.2.1 Global Open-Source Software Revenue (USD Million), and Market Share (%) by Applications (2023-2030)
11 Global Open-Source Software Development Regional Status and Outlook Forecast
11.1 Global Open-Source Software Revenue (USD Million) By Regions (2023-2030)
11.2 North America Open-Source Software Revenue (USD Million) by Type, and Applications (2023-2030)
11.2.1 North America Open-Source Software Revenue (USD) Million by Country (2023-2030)
11.2.2 North America Open-Source Software Revenue (USD Million), by Type (2023-2030)
11.2.3 North America Open-Source Software Revenue (USD Million), Market Share (%) by Applications (2023-2030)
11.3 Europe Open-Source Software Revenue (USD Million), by Type, and Applications (2023-2030)
11.3.1 Europe Open-Source Software Revenue (USD Million), by Country (2023-2030)
11.3.2 Europe Open-Source Software Revenue (USD Million), by Type (2023-2030)
11.3.3 Europe Open-Source Software Revenue (USD Million), by Applications (2023-2030)
11.4 Asia Pacific Open-Source Software Revenue (USD Million) by Type, and Applications (2023-2030)
11.4.1 Asia Pacific Open-Source Software Revenue (USD Million), by Country (2023-2030)
11.4.2 Asia Pacific Open-Source Software Revenue (USD Million), by Type (2023-2030)
11.4.3 Asia Pacific Open-Source Software Revenue (USD Million), by Applications (2023-2030)
11.5 South America Open-Source Software Revenue (USD Million), by Type, and Applications (2023-2030)
11.5.1 South America Open-Source Software Revenue (USD Million), by Country (2023-2030)
11.5.2 South America Open-Source Software Revenue (USD Million), by Type (2023-2030)
11.5.3 South America Open-Source Software Revenue (USD Million), by Applications (2023-2030)
11.6 Middle East and Africa Open-Source Software Revenue (USD Million), by Type, and Applications (2023-2030)
11.6.1 Middle East and Africa Open-Source Software Revenue (USD Million), by region (2023-2030)
11.6.2 Middle East and Africa Open-Source Software Revenue (USD Million), by Type (2023-2030)
11.6.3 Middle East and Africa Open-Source Software Revenue (USD Million), by Applications (2023-2030)
12 Methodology and Data Sources
12.1 Methodology/Research Approach
12.1.1 Research Programs/Design
12.1.2 Market Size Estimation
12.1.3 Market Breakdown and Data Triangulation
12.2 Data Sources
12.2.1 Secondary Sources
12.2.2 Primary Sources
12.3 Disclaimer
List of Tables
Table 1 Market Segmentation Analysis
Table 2 Global Open-Source Software Market Companies with Areas Served
Table 3 Products Offerings Global Open-Source Software Market
Table 4 Low Growth Scenario Forecasts
Table 5 Reference Case Growth Scenario
Table 6 High Growth Case Scenario
Table 7 Global Open-Source Software Revenue (USD Million) And CAGR (%) By Type (2018-2030)
Table 8 Global Open-Source Software Revenue (USD Million) And CAGR (%) By Applications (2018-2030)
Table 9 Global Open-Source Software Revenue (USD Million) And CAGR (%) By Regions (2018-2030)
Table 10 Global Open-Source Software Revenue (USD Million) By Type (2018-2022)
Table 11 Global Open-Source Software Revenue Market Share (%) By Type (2018-2022)
Table 12 Global Open-Source Software Revenue (USD Million) By Applications (2018-2022)
Table 13 Global Open-Source Software Revenue Market Share (%) By Applications (2018-2022)
Table 14 Global Open-Source Software Market Revenue (USD Million) By Regions (2018-2022)
Table 15 Global Open-Source Software Market Share (%) By Regions (2018-2022)
Table 16 North America Open-Source Software Revenue (USD Million) By Country (2018-2022)
Table 17 North America Open-Source Software Revenue (USD Million) By Type (2018-2022)
Table 18 North America Open-Source Software Revenue (USD Million) By Applications (2018-2022)
Table 19 Europe Open-Source Software Revenue (USD Million) By Country (2018-2022)
Table 20 Europe Open-Source Software Revenue (USD Million) By Type (2018-2022)
Table 21 Europe Open-Source Software Revenue (USD Million) By Applications (2018-2022)
Table 22 Asia Pacific Open-Source Software Revenue (USD Million) By Country (2018-2022)
Table 23 Asia Pacific Open-Source Software Revenue (USD Million) By Type (2018-2022)
Table 24 Asia Pacific Open-Source Software Revenue (USD Million) By Applications (2018-2022)
Table 25 South America Open-Source Software Revenue (USD Million) By Country (2018-2022)
Table 26 South America Open-Source Software Revenue (USD Million) By Type (2018-2022)
Table 27 South America Open-Source Software Revenue (USD Million) By Applications (2018-2022)
Table 28 Middle East and Africa Open-Source Software Revenue (USD Million) By Region (2018-2022)
Table 29 Middle East and Africa Open-Source Software Revenue (USD Million) By Type (2018-2022)
Table 30 Middle East and Africa Open-Source Software Revenue (USD Million) By Applications (2018-2022)
Table 31 Financial Analysis
Table 32 Global Open-Source Software Revenue (USD Million) By Type (2023-2030)
Table 33 Global Open-Source Software Revenue Market Share (%) By Type (2023-2030)
Table 34 Global Open-Source Software Revenue (USD Million) By Applications (2023-2030)
Table 35 Global Open-Source Software Revenue Market Share (%) By Applications (2023-2030)
Table 36 Global Open-Source Software Market Revenue (USD Million), And Revenue (USD Million) By Regions (2023-2030)
Table 37 North America Open-Source Software Revenue (USD)By Country (2023-2030)
Table 38 North America Open-Source Software Revenue (USD Million) By Type (2023-2030)
Table 39 North America Open-Source Software Revenue (USD Million) By Applications (2023-2030)
Table 40 Europe Open-Source Software Revenue (USD Million) By Country (2023-2030)
Table 41 Europe Open-Source Software Revenue (USD Million) By Type (2023-2030)
Table 42 Europe Open-Source Software Revenue (USD Million) By Applications (2023-2030)
Table 43 Asia Pacific Open-Source Software Revenue (USD Million) By Country (2023-2030)
Table 44 Asia Pacific Open-Source Software Revenue (USD Million) By Type (2023-2030)
Table 45 Asia Pacific Open-Source Software Revenue (USD Million) By Applications (2023-2030)
Table 46 South America Open-Source Software Revenue (USD Million) By Country (2023-2030)
Table 47 South America Open-Source Software Revenue (USD Million) By Type (2023-2030)
Table 48 South America Open-Source Software Revenue (USD Million) By Applications (2023-2030)
Table 49 Middle East and Africa Open-Source Software Revenue (USD Million) By Region (2023-2030)
Table 50 Middle East and Africa Open-Source Software Revenue (USD Million) By Region (2023-2030)
Table 51 Middle East and Africa Open-Source Software Revenue (USD Million) By Type (2023-2030)
Table 52 Middle East and Africa Open-Source Software Revenue (USD Million) By Applications (2023-2030)
Table 53 Research Programs/Design for This Report
Table 54 Key Data Information from Secondary Sources
Table 55 Key Data Information from Primary Sources
List of Figures
Figure 1 Market Scope
Figure 2 Porter’s Five Forces
Figure 3 Global Open-Source Software Revenue (USD Million) By Type (2018-2022)
Figure 4 Global Open-Source Software Revenue Market Share (%) By Type (2022)
Figure 5 Global Open-Source Software Revenue (USD Million) By Applications (2018-2022)
Figure 6 Global Open-Source Software Revenue Market Share (%) By Applications (2022)
Figure 7 Global Open-Source Software Market Revenue (USD Million) By Regions (2018-2022)
Figure 8 Global Open-Source Software Market Share (%) By Regions (2022)
Figure 9 North America Open-Source Software Revenue (USD Million) By Country (2018-2022)
Figure 10 North America Open-Source Software Revenue (USD Million) By Type (2018-2022)
Figure 11 North America Open-Source Software Revenue (USD Million) By Applications (2018-2022)
Figure 12 Europe Open-Source Software Revenue (USD Million) By Country (2018-2022)
Figure 13 Europe Open-Source Software Revenue (USD Million) By Type (2018-2022)
Figure 14 Europe Open-Source Software Revenue (USD Million) By Applications (2018-2022)
Figure 15 Asia Pacific Open-Source Software Revenue (USD Million) By Country (2018-2022)
Figure 16 Asia Pacific Open-Source Software Revenue (USD Million) By Type (2018-2022)
Figure 17 Asia Pacific Open-Source Software Revenue (USD Million) By Applications (2018-2022)
Figure 18 South America Open-Source Software Revenue (USD Million) By Country (2018-2022)
Figure 19 South America Open-Source Software Revenue (USD Million) By Type (2018-2022)
Figure 20 South America Open-Source Software Revenue (USD Million) By Applications (2018-2022)
Figure 21 Middle East and Africa Open-Source Software Revenue (USD Million) By Region (2018-2022)
Figure 22 Middle East and Africa Open-Source Software Revenue (USD Million) By Type (2018-2022)
Figure 23 Middle East and Africa Open-Source Software Revenue (USD Million) By Applications (2018-2022)
Figure 24 Global Open-Source Software Revenue (USD Million) By Type (2023-2030)
Figure 25 Global Open-Source Software Revenue Market Share (%) By Type (2030)
Figure 26 Global Open-Source Software Revenue (USD Million) By Applications (2023-2030)
Figure 27 Global Open-Source Software Revenue Market Share (%) By Applications (2030)
Figure 28 Global Open-Source Software Market Revenue (USD Million) By Regions (2023-2030)
Figure 29 North America Open-Source Software Revenue (USD Million) By Country (2023-2030)
Figure 30 North America Open-Source Software Revenue (USD Million) By Type (2023-2030)
Figure 31 North America Open-Source Software Revenue (USD Million) By Applications (2023-2030)
Figure 32 Europe Open-Source Software Revenue (USD Million) By Country (2023-2030)
Figure 33 Europe Open-Source Software Revenue (USD Million) By Type (2023-2030)
Figure 34 Europe Open-Source Software Revenue (USD Million) By Applications (2023-2030)
Figure 35 Asia Pacific Open-Source Software Revenue (USD Million) By Country (2023-2030)
Figure 36 Asia Pacific Open-Source Software Revenue (USD Million) By Type (2023-2030)
Figure 37 Asia Pacific Open-Source Software Revenue (USD Million) By Applications (2023-2030)
Figure 38 South America Open-Source Software Revenue (USD Million) By Country (2023-2030)
Figure 39 South America Open-Source Software Revenue (USD Million) By Type (2023-2030)
Figure 40 South America Open-Source Software Revenue (USD Million) By Applications (2023-2030)
Figure 41 Middle East and Africa Open-Source Software Revenue (USD Million) By Region (2023-2030)
Figure 42 Middle East and Africa Open-Source Software Revenue (USD Million) By Region (2023-2030)
Figure 43 Middle East and Africa Open-Source Software Revenue (USD Million) By Type (2023-2030)
Figure 44 Middle East and Africa Open-Source Software Revenue (USD Million) By Applications (2023-2030)
Figure 45 Bottom-Up and Top-Down Approaches for This Report
Figure 46 Data Triangulation
