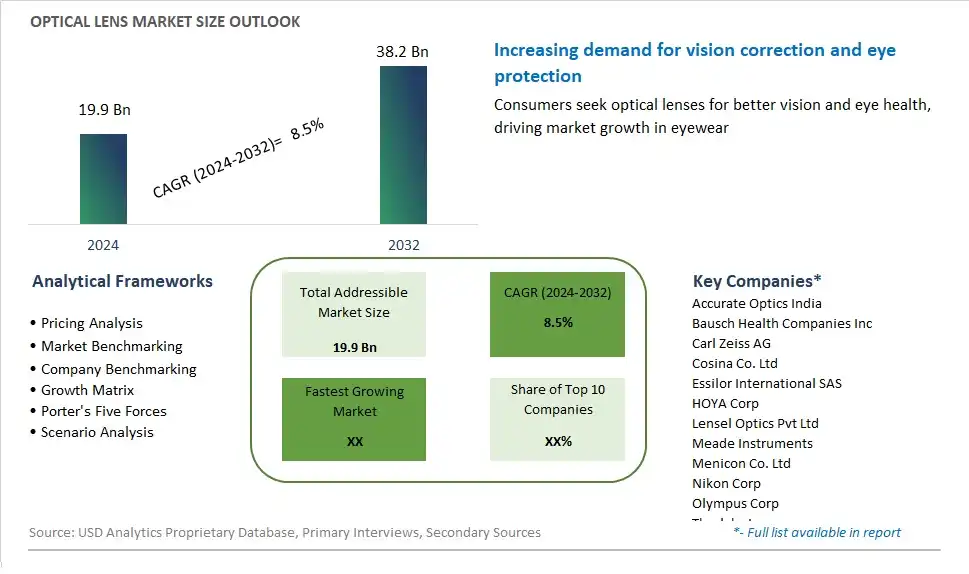
Global Optical Lens Market Size is valued at $19.9 Billion in 2024 and is forecast to register a growth rate (CAGR) of 8.5% to reach $38.2 Billion by 2032.
The global Optical Lens Market Comprehensive Study analyzes and forecasts the market size across 6 regions and 24 countries for diverse segments -By End-User (Consumer Electronics, Healthcare, Life Science, Others), By Type (Dry-type Film, Wet-type Film)
An Introduction to Optical Lens Market
In 2024, the optical lens market remains integral to the eyewear industry, offering consumers vision correction solutions tailored to their individual needs and preferences. Optical lenses, also known as ophthalmic lenses, are essential components of eyeglasses and prescription sunglasses, providing refractive correction for common vision problems such as nearsightedness, farsightedness, astigmatism, and presbyopia. With advancements in lens materials, designs, and coatings, optical lenses offer improved clarity, comfort, and visual performance, enhancing the quality of life for millions of people worldwide. Additionally, optical lenses are available in various types, including single vision, bifocal, trifocal, and progressive lenses, each addressing specific vision requirements and lifestyle preferences. As digital devices become ubiquitous in daily life, there is a growing demand for specialty lenses designed to alleviate digital eye strain and blue light exposure, reflecting shifting consumer behaviors and the rise of remote work and digital entertainment. Moreover, the optical lens market is witnessing innovation in lens customization, customization, and personalized vision solutions, driven by advancements in digital lens processing technology and virtual fitting tools that optimize visual acuity and comfort for each wearer. As eye health awareness grows and the global population ages, the optical lens market is poised for continued growth, driven by rising vision care needs, technological advancements, and evolving consumer preferences for quality eyewear products that enhance both vision and lifestyle.
Optical Lens Competitive Landscape
The market report analyses the leading companies in the industry including Accurate Optics India, Bausch Health Companies Inc, Carl Zeiss AG, Cosina Co. Ltd, Essilor International SAS, HOYA Corp, Lensel Optics Pvt Ltd, Meade Instruments, Menicon Co. Ltd, Nikon Corp, Olympus Corp, Thorlabs Inc, and Others.
Optical Lens Market Dynamics
Optical Lens Market Trend: Growing Demand for High-Tech Lens Solutions
A significant trend in the optical lens market is the increasing demand for high-tech lens solutions that address various visual needs and lifestyle preferences. With advancements in technology and materials, consumers are seeking optical lenses that offer superior clarity, durability, and performance. This trend is driven by the rising prevalence of digital devices, which has led to an increase in digital eye strain and the need for lenses with blue light filtering and anti-reflective coatings. Additionally, there's a growing interest in specialty lenses for specific activities such as sports, driving, and outdoor pursuits, as well as progressive lenses for presbyopia correction. As consumers prioritize comfort, functionality, and style in their eyewear choices, there's a growing opportunity for optical lens manufacturers to innovate with advanced lens designs, materials, and coatings to meet the diverse needs of modern consumers.
Market Driver: Aging Population and Increasing Prevalence of Vision Disorders
A key driver for the optical lens market is the aging population and the increasing prevalence of vision disorders such as myopia, hyperopia, astigmatism, and presbyopia. As the global population ages, there's a growing demand for corrective lenses to address age-related vision changes and refractive errors. Moreover, lifestyle factors such as prolonged screen time, poor lighting conditions, and environmental stressors contribute to the development of vision problems among people of all ages. This driver is further reinforced by the growing awareness of the importance of regular eye examinations and preventive eye care in maintaining optimal vision health. As individuals seek out vision correction solutions that offer comfort, precision, and aesthetics, there's a continued demand for optical lenses that provide accurate refractive correction, visual comfort, and style options to suit diverse preferences and lifestyles.
Market Opportunity: Customization and Personalization in Lens Design
An opportunity for the optical lens market lies in customization and personalization in lens design to offer tailored solutions that meet the unique needs and preferences of individual consumers. Brands can capitalize on this opportunity by leveraging digital technologies such as computer-aided design (CAD), digital surfacing, and 3D printing to create bespoke lenses that are customized to each customer's prescription, lifestyle, and visual habits. Additionally, there's potential to offer personalized lens options such as progressive lenses with customized reading zones, photochromic lenses that adapt to different lighting conditions, and tinted lenses for outdoor activities. By offering customizable lens options, optical retailers and manufacturers can enhance the value proposition of their products, improve customer satisfaction, and differentiate themselves in the competitive marketplace. Moreover, personalized lens solutions can drive customer loyalty and repeat business, as consumers seek out eyewear providers that offer personalized service and attention to detail in meeting their vision needs.
Optical Lens Market Share Analysis: Consumer Electronics held the dominant market share in 2024
In the Optical Lens Market segmented by end-user, the consumer electronics sector is the largest segment, driven by several pivotal factors. Optical lenses play a crucial role in various consumer electronic devices, including smartphones, cameras, laptops, and gaming consoles, where they are essential for image capture, display, and vision enhancement. The increasing demand for high-quality imaging and display technologies, coupled with advancements in camera and display resolutions, has fueled the adoption of optical lenses in consumer electronics. Further, the proliferation of smartphones and digital cameras, coupled with the growing popularity of social media and content creation, has led to a surge in demand for optical lenses capable of delivering superior image quality and performance. Additionally, the integration of augmented reality (AR) and virtual reality (VR) technologies in consumer electronics further drives the need for specialized optical lenses to enable immersive visual experiences. As consumer preferences continue to evolve towards technologically advanced and visually immersive devices, the consumer electronics segment is expected to maintain its dominance in the optical lens market.
Optical Lens Market Share Analysis: Wet-type Film market is poised to register the fastest growth rae over the forecast period to 2032
In the Optical Lens Market segmented by type, wet-type film is the fastest-growing segment, propelled by several compelling factors. Wet-type film optical lenses offer distinct advantages over dry-type counterparts, including enhanced durability, flexibility, and optical performance. These lenses are commonly used in various applications such as camera lenses, eyeglasses, and medical imaging devices, where precision optics and superior image quality are paramount. Further, wet-type film lenses can be customized to meet specific design requirements and are compatible with advanced coatings and treatments, further enhancing their functionality and performance. Additionally, advancements in manufacturing processes and materials have led to the development of innovative wet-type film lenses with improved optical properties and durability, driving their adoption across a wide range of industries. As demand for high-quality optics continues to rise in applications such as photography, medical imaging, and automotive sensors, the wet-type film segment is poised for sustained growth, shaping the future landscape of the optical lens market.
Optical Lens Market Segmentation
By End-User
Consumer Electronics
Healthcare
Life Science
Others
By Type
Dry-type Film
Wet-type Film
Countries Analyzed
North America (US, Canada, Mexico)
Europe (Germany, UK, France, Spain, Italy, Russia, Rest of Europe)
Asia Pacific (China, India, Japan, South Korea, Australia, South East Asia, Rest of Asia)
South America (Brazil, Argentina, Rest of South America)
Middle East and Africa (Saudi Arabia, UAE, Rest of Middle East, South Africa, Egypt, Rest of Africa)
Optical Lens Companies Profiled in the Study
Accurate Optics India
Bausch Health Companies Inc
Carl Zeiss AG
Cosina Co. Ltd
Essilor International SAS
HOYA Corp
Lensel Optics Pvt Ltd
Meade Instruments
Menicon Co. Ltd
Nikon Corp
Olympus Corp
Thorlabs Inc
*- List Not Exhaustive
Chapter 1. TABLE OF CONTENTS
Chapter 2. Introduction to Optical Lens Market
2.1. Market Overview
2.2. Key Statistics and Report Highlights
2.3. Scope of the Comprehensive Study
2.3.1. Market Definition
2.3.2 Countries and Regions Covered
2.3.3 Research Objective
2.3.4 Units, Currency, and Conversions
2.3.5 Industry Value Chain
2.4. Key Market Segments
2.5. Key Companies
2.6. Study Period
Chapter 3. Strategic Analysis Review
3.1. Optical Lens Pricing Analysis and Forecast
3.2. Porter’s Five Forces
3.3. Market Ecosystem
3.4. SWOT Analysis
3.5. Regulatory Scenario
3.3. Effects of Inflation, Russia-Ukraine War, moderating economic growth, and other macroeconomic factors
Chapter 4. Competitive Landscape
4.1. Market Share Analysis
4.1.1. Global Optical Lens Market Share by Company, 2023
4.1.2. Product Offerings of Leading Optical Lens Companies
4.2. Market Entropy
4.2.1. New Product Launches in the Industry
4.2.2. Mergers, Acquisitions, Joint ventures, and Partnerships
4.3. Key Strategies and Best Practices
Chapter 5. Global Market Projections: Best, Reference, and Low Case Scenarios
5.1. Growth Analysis- Case Scenario Definitions
5.2. Low Growth Case Scenario Forecasts
5.3. Reference Growth Case Scenario Forecasts
5.4. High Growth Case Scenario Forecasts
Chapter 6. Market Dynamics
6.1. Optical Lens Market Drivers
6.2. Optical Lens Market Challenges
6.6. Optical Lens Market Opportunities
6.4. Optical Lens Market Trends
Chapter 7. Global Optical Lens Market Outlook Trends
7.1. Global Optical Lens Revenue (USD Million) and CAGR (%) by Type (2021-2032)
7.2. Global Optical Lens Revenue (USD Million) and CAGR (%) by Application (2021-2032)
7.3. Global Optical Lens Revenue (USD Million) and CAGR (%) by Product (2021-2032)
By End-User
Consumer Electronics
Healthcare
Life Science
Others
By Type
Dry-type Film
Wet-type Film
Chapter 8. Global Optical Lens Regional Analysis and Outlook
8.1. Global Optical Lens Revenue (USD Million) By Regions (2021- 2032)
8.2. North America Optical Lens Revenue (USD Million) by Country (2021-2032)
8.2.1. United States Optical Lens Regional Analysis and Outlook
8.2.2. Canada Optical Lens Regional Analysis and Outlook
8.2.3. Mexico Optical Lens Regional Analysis and Outlook
8.3. Europe Optical Lens Revenue (USD Million), by Country (2021-2032)
8.3.1. Germany Optical Lens Regional Analysis and Outlook
8.3.2. France Optical Lens Regional Analysis and Outlook
8.3.3. United Kingdom Optical Lens Regional Analysis and Outlook
8.3.4. Spain Optical Lens Regional Analysis and Outlook
8.3.5. Italy Optical Lens Regional Analysis and Outlook
8.3.6. Russia Optical Lens Regional Analysis and Outlook
8.3.7. Rest of Europe Optical Lens Regional Analysis and Outlook
8.4. Asia Pacific Optical Lens Revenue (USD Million) by Country (2021-2032)
8.4.1. China Optical Lens Regional Analysis and Outlook
8.4.2. Japan Optical Lens Regional Analysis and Outlook
8.4.3. India Optical Lens Regional Analysis and Outlook
8.4.4. South Korea Optical Lens Regional Analysis and Outlook
8.4.5. Australia Optical Lens Regional Analysis and Outlook
8.4.6. South East Asia Optical Lens Regional Analysis and Outlook
8.4.7. Rest of Asia Pacific Optical Lens Regional Analysis and Outlook
8.5. South America Optical Lens Revenue (USD Million), by Country (2021-2032)
8.5.1. Brazil Optical Lens Regional Analysis and Outlook
8.5.2. Argentina Optical Lens Regional Analysis and Outlook
8.5.3. Rest of South America Optical Lens Regional Analysis and Outlook
8.6. Middle East and Africa Optical Lens Revenue (USD Million) by Country (2021-2032)
8.6.1. Middle East Optical Lens Regional Analysis and Outlook
8.6.2. Africa Optical Lens Regional Analysis and Outlook
Chapter 9. North America Optical Lens Analysis and Outlook
9.1. North America Optical Lens Revenue (USD Million) by Segments (2021-2032)
9.1.1. North America Optical Lens Revenue (USD Million) by Type (2021-2032)
9.1.2. North America Optical Lens Revenue (USD Million) by Application (2021-2032)
9.1.3. North America Optical Lens Revenue (USD Million) by Product (2021-2032)
By End-User
Consumer Electronics
Healthcare
Life Science
Others
By Type
Dry-type Film
Wet-type Film
Chapter 10. Europe Optical Lens Analysis and Outlook
10.1. Europe Optical Lens Revenue (USD Million), by Segments (USD Million) (2021-2032)
10.1.1. Europe Optical Lens Revenue (USD Million) by Type (2021-2032)
10.1.2. Europe Optical Lens Revenue (USD Million) by Application (2021-2032)
10.1.3. Europe Optical Lens Revenue (USD Million) by Product (2021-2032)
By End-User
Consumer Electronics
Healthcare
Life Science
Others
By Type
Dry-type Film
Wet-type Film
Chapter 11. Asia Pacific Optical Lens Analysis and Outlook
11.1. Asia Pacific Optical Lens Revenue (USD Million), and Revenue (USD Million) by Segments (2021-2032)
11.1.1. Asia Pacific Optical Lens Revenue (USD Million) by Type (2021-2032)
11.1.2. Asia Pacific Optical Lens Revenue (USD Million) by Application (2021-2032)
11.1.3. Asia Pacific Optical Lens Revenue (USD Million) by Product (2021-2032)
By End-User
Consumer Electronics
Healthcare
Life Science
Others
By Type
Dry-type Film
Wet-type Film
Chapter 12. South America Optical Lens Analysis and Outlook
12.1. South America Optical Lens Revenue (USD Million), by Segments (2021-2032)
12.1.1. South America Optical Lens Revenue (USD Million) by Type (2021-2032)
12.1.2. South America Optical Lens Revenue (USD Million) by Application (2021-2032)
12.1.3. South America Optical Lens Revenue (USD Million) by Product (2021-2032)
By End-User
Consumer Electronics
Healthcare
Life Science
Others
By Type
Dry-type Film
Wet-type Film
Chapter 13. Middle East and Africa Optical Lens Analysis and Outlook
13.1. Middle East and Africa Optical Lens Revenue (USD Million), by Segments (2021-2032)
13.1.1. Middle East and Africa Optical Lens Revenue (USD Million) by Type (2021-2032)
13.1.2. Middle East and Africa Optical Lens Revenue (USD Million) by Application (2021-2032)
13.1.3. Middle East and Africa Optical Lens Revenue (USD Million) by Product (2021-2032)
By End-User
Consumer Electronics
Healthcare
Life Science
Others
By Type
Dry-type Film
Wet-type Film
Chapter 14. Optical Lens Company Profiles
14.1 Business Overview
14.2 Product Profiles
14.3 SWOT Profiles
14.5 Recent Developments
14.6 Financial Profile
List of Companies
Accurate Optics India
Bausch Health Companies Inc
Carl Zeiss AG
Cosina Co. Ltd
Essilor International SAS
HOYA Corp
Lensel Optics Pvt Ltd
Meade Instruments
Menicon Co. Ltd
Nikon Corp
Olympus Corp
Thorlabs Inc
15. Methodology and Data Sources
15.1 Customization Offerings
15.2 Subscription Services
15.3 Related Reports
15.4 Publisher Expertise
LIST OF TABLES
Table 1 Market Segmentation Analysis
Table 2 Global Optical Lens Market Share of Leading Companies, 2023
Table 3 Product Offerings of Leading Companies
Table 4 Low Growth Scenario Forecasts
Table 5 Reference Case Growth Scenario
Table 6 High Growth Case Scenario
Table 7 Global Optical Lens Revenue (USD Million) And CAGR (%) By Type (2021-2032)
Table 8 Global Optical Lens Revenue (USD Million) And CAGR (%) By Application (2021-2032)
Table 9 Global Optical Lens Revenue (USD Million) And CAGR (%) By Product (2021-2032)
Table 10 Global Optical Lens Market Revenue (USD Million) By Regions (2021-2032)
Table 11 Global Optical Lens Market Share (%) By Regions (2021-2032)
Table 12 North America Optical Lens Revenue (USD Million) By Country (2021-2032)
Table 13 Europe Optical Lens Revenue (USD Million) By Country (2021-2032)
Table 14 Asia Pacific Optical Lens Revenue (USD Million) By Country (2021-2032)
Table 15 South America Optical Lens Revenue (USD Million) By Country (2021-2032)
Table 16 Middle East and Africa Optical Lens Revenue (USD Million) By Region (2021-2032)
Table 17 North America Optical Lens Revenue (USD Million) By Type (2021-2032)
Table 18 North America Optical Lens Revenue (USD Million) By Application (2021-2032)
Table 19 North America Optical Lens Revenue (USD Million) By Product (2021-2032)
Table 20 Europe Optical Lens Revenue (USD Million) By Type (2021-2032)
Table 21 Europe Optical Lens Revenue (USD Million) By Application (2021-2032)
Table 22 Europe Optical Lens Revenue (USD Million) By Product (2021-2032)
Table 23 Asia Pacific Optical Lens Revenue (USD Million) By Type (2021-2032)
Table 24 Asia Pacific Optical Lens Revenue (USD Million) By Application (2021-2032)
Table 25 Asia Pacific Optical Lens Revenue (USD Million) By Product (2021-2032)
Table 26 South America Optical Lens Revenue (USD Million) By Type (2021-2032)
Table 27 South America Optical Lens Revenue (USD Million) By Application (2021-2032)
Table 28 South America Optical Lens Revenue (USD Million) By Product (2021-2032)
Table 29 Middle East and Africa Optical Lens Revenue (USD Million) By Type (2021-2032)
Table 30 Middle East and Africa Optical Lens Revenue (USD Million) By Application (2021-2032)
Table 31 Middle East and Africa Optical Lens Revenue (USD Million) By Product (2021-2032)
LIST OF FIGURES
Figure 1. Market Scope
Figure 2. Pricing Forecasts Per Unit, 2023- 2032
Figure 3. Porter’s Five Forces
Figure 4. Global Optical Lens Market Revenue (USD Million) By Regions (2021-2032)
Figure 5. Global Optical Lens Market Share (%) By Regions (2023)
Figure 6. North America Optical Lens Revenue (USD Million) By Country (2021-2032)
Figure 7. United States Optical Lens Revenue (USD Million) By Country (2021-2032)
Figure 8. Canada Optical Lens Revenue (USD Million) By Country (2021-2032)
Figure 9. Mexico Optical Lens Revenue (USD Million) By Country (2021-2032)
Figure 10. Europe Optical Lens Revenue (USD Million) By Country (2021-2032)
Figure 11. Germany Optical Lens Revenue (USD Million) By Country (2021-2032)
Figure 12. France Optical Lens Revenue (USD Million) By Country (2021-2032)
Figure 13. United Kingdom Optical Lens Revenue (USD Million) By Country (2021-2032)
Figure 14. Spain Optical Lens Revenue (USD Million) By Country (2021-2032)
Figure 15. Italy Optical Lens Revenue (USD Million) By Country (2021-2032)
Figure 16. Russia Optical Lens Revenue (USD Million) By Country (2021-2032)
Figure 17. Rest of Europe Optical Lens Revenue (USD Million) By Country (2021-2032)
Figure 11. Asia Pacific Optical Lens Revenue (USD Million) By Country (2021-2032)
Figure 12. China Optical Lens Revenue (USD Million) By Country (2021-2032)
Figure 13. Japan Optical Lens Revenue (USD Million) By Country (2021-2032)
Figure 14. India Optical Lens Revenue (USD Million) By Country (2021-2032)
Figure 15. South Korea Optical Lens Revenue (USD Million) By Country (2021-2032)
Figure 16. Australia Optical Lens Revenue (USD Million) By Country (2021-2032)
Figure 17. South East Asia Optical Lens Revenue (USD Million) By Country (2021-2032)
Figure 18. South America Optical Lens Revenue (USD Million) By Country (2021-2032)
Figure 19. Brazil Optical Lens Revenue (USD Million) By Country (2021-2032)
Figure 20. Argentina Optical Lens Revenue (USD Million) By Country (2021-2032)
Figure 21. Rest of Asia Pacific Optical Lens Revenue (USD Million) By Country (2021-2032)
Figure 22. Middle East and Africa Optical Lens Revenue (USD Million) By Region (2021-2032)
Figure 23. Saudi Arabia Optical Lens Revenue (USD Million) By Region (2021-2032)
Figure 24. The UAE Optical Lens Revenue (USD Million) By Region (2021-2032)
Figure 25. Rest of Middle East Optical Lens Revenue (USD Million) By Region (2021-2032)
Figure 26. South Africa Optical Lens Revenue (USD Million) By Region (2021-2032)
Figure 27. Africa Optical Lens Revenue (USD Million) By Region (2021-2032)
Figure 28. North America Optical Lens Revenue (USD Million) By Type (2021-2032)
Figure 29. North America Optical Lens Revenue (USD Million) By Application (2021-2032)
Figure 30. North America Optical Lens Revenue (USD Million) By Product (2021-2032)
Figure 31. Europe Optical Lens Revenue (USD Million) By Type (2021-2032)
Figure 32. Europe Optical Lens Revenue (USD Million) By Application (2021-2032)
Figure 33. Europe Optical Lens Revenue (USD Million) By Product (2021-2032)
Figure 34. Asia Pacific Optical Lens Revenue (USD Million) By Type (2021-2032)
Figure 35. Asia Pacific Optical Lens Revenue (USD Million) By Application (2021-2032)
Figure 36. Asia Pacific Optical Lens Revenue (USD Million) By Product (2021-2032)
Figure 37. South America Optical Lens Revenue (USD Million) By Type (2021-2032)
Figure 38. South America Optical Lens Revenue (USD Million) By Application (2021-2032)
Figure 39. South America Optical Lens Revenue (USD Million) By Product (2021-2032)
Figure 40. Middle East and Africa Optical Lens Revenue (USD Million) By Type (2021-2032)
Figure 41. Middle East and Africa Optical Lens Revenue (USD Million) By Application (2021-2032)
Figure 42. Middle East and Africa Optical Lens Revenue (USD Million) By Product (2021-2032)
By End-User
Consumer Electronics
Healthcare
Life Science
Others
By Type
Dry-type Film
Wet-type Film
Countries Analyzed
North America (US, Canada, Mexico)
Europe (Germany, UK, France, Spain, Italy, Russia, Rest of Europe)
Asia Pacific (China, India, Japan, South Korea, Australia, South East Asia, Rest of Asia)
South America (Brazil, Argentina, Rest of South America)
Middle East and Africa (Saudi Arabia, UAE, Rest of Middle East, South Africa, Egypt, Rest of Africa)
