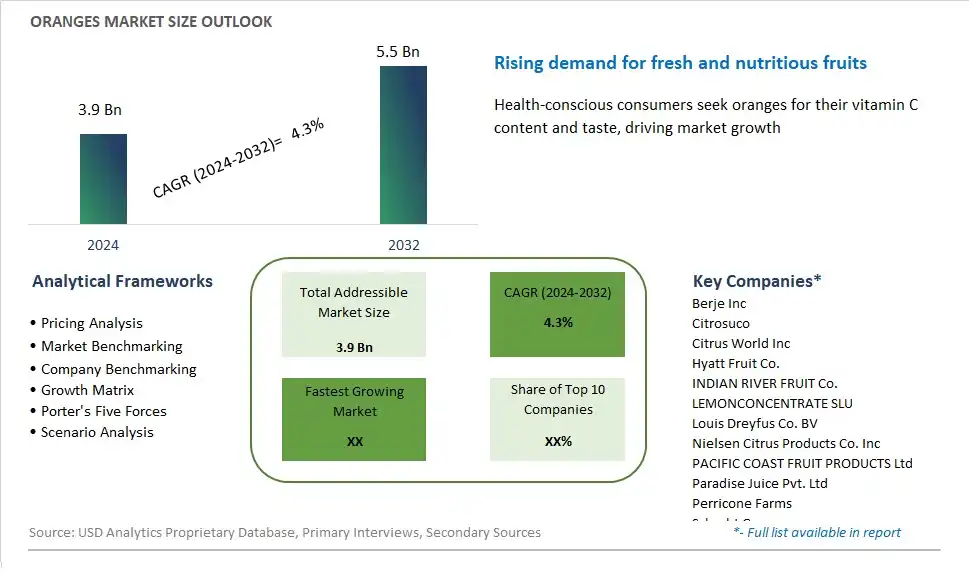
Global Oranges Market Size is valued at $3.9 Billion in 2024 and is forecast to register a growth rate (CAGR) of 4.3% to reach $5.5 Billion by 2032.
The global Oranges Market Comprehensive Study analyzes and forecasts the market size across 6 regions and 24 countries for diverse segments -By Product (Fresh, Processed, Frozen), By Application (Non-organic, Organic)
An Introduction to Oranges Market
In 2024, the orange market continues to thrive as one of the most popular citrus fruits globally. Oranges are cherished not only for their refreshing taste but also for their numerous health benefits. Rich in vitamin C, oranges are renowned for boosting immunity and promoting overall well-being. Additionally, they contain antioxidants and fiber, making them a nutritious choice for consumers. The orange market encompasses various segments, including fresh fruit sales, juice production, and processed products like marmalades and extracts. With increasing awareness of health-conscious consumption and the demand for natural ingredients, organic oranges have gained significant traction in recent years. This trend is likely to continue as consumers prioritize sustainability and seek out organic alternatives for their dietary needs. From small-scale farmers to large-scale orchards, the orange market remains dynamic and resilient, catering to diverse consumer preferences worldwide.
Oranges Competitive Landscape
The market report analyses the leading companies in the industry including Berje Inc, Citrosuco, Citrus World Inc, Hyatt Fruit Co., INDIAN RIVER FRUIT Co., LEMONCONCENTRATE SLU, Louis Dreyfus Co. BV, Nielsen Citrus Products Co. Inc, PACIFIC COAST FRUIT PRODUCTS Ltd, Paradise Juice Pvt. Ltd, Perricone Farms, Schacht Groves, SEQUOIA-ORANGE Co. Inc, SUNRISE FRUITS COMPANY SL, The Fruit Co., Trinity Fruit Co., Tropicana Products Inc , Zain Natural Agro India Pvt. Ltd, and Others.
Oranges Market Dynamics
Oranges Market Trend: Increasing Demand for Fresh and Healthy Citrus Products
A significant trend in the oranges market is the rising demand for fresh and healthy citrus products. With growing consumer awareness of the importance of a nutritious diet and the benefits of consuming fresh fruits, there's an increasing preference for oranges and citrus fruits as part of a healthy lifestyle. This trend is driven by consumers' desire for natural sources of vitamins, antioxidants, and fiber, as well as their interest in supporting immune health and overall well-being. Moreover, the versatility of oranges in culinary applications, including juices, snacks, salads, and desserts, further contributes to their popularity among health-conscious consumers. As a result, there's a growing market for premium-quality oranges that offer superior taste, juiciness, and nutritional value, creating opportunities for citrus growers, suppliers, and retailers to meet the evolving preferences of consumers seeking fresh and healthy citrus products.
Market Driver: Globalization and Expansion of Export Markets
A key driver for the oranges market is the globalization and expansion of export markets, driven by increasing international trade and demand for citrus products worldwide. Oranges are a highly traded commodity, with major producing regions such as Brazil, Spain, and the United States exporting oranges to countries across Europe, Asia, and North America. This driver is reinforced by factors such as favorable trade policies, improved transportation infrastructure, and growing consumer awareness and appreciation of citrus fruits in emerging markets. Additionally, advancements in cold chain logistics and preservation technologies have enabled the extended shelf life and quality preservation of oranges during transit, facilitating their distribution to distant markets. As a result, there's a growing opportunity for citrus exporters to capitalize on the expanding global demand for oranges and citrus products, tapping into new markets and diversifying their customer base to drive sales growth and revenue expansion.
Market Opportunity: Diversification into Value-Added Orange Products
An opportunity for the oranges market lies in diversification into value-added orange products that cater to changing consumer preferences and emerging market trends. Brands and manufacturers can capitalize on this opportunity by expanding their product offerings beyond fresh oranges to include value-added products such as orange juice, concentrates, extracts, essential oils, and citrus-based snacks and beverages. Moreover, there's potential to innovate with orange-derived ingredients in the development of natural flavorings, fragrances, and cosmetic formulations for use in food, beverage, and personal care applications. By leveraging the natural goodness and versatility of oranges, companies can create innovative and differentiated products that appeal to a wide range of consumers seeking convenience, health benefits, and sensory experiences. Additionally, strategic partnerships with food and beverage manufacturers, retailers, and hospitality industry players can further enhance distribution channels and market reach, enabling brands to capitalize on the growing demand for value-added orange products and drive business growth in the competitive citrus market.
Oranges Market Share Analysis: Fresh Oranges held the dominant market share in 2024
In the Oranges Market segmented by product, fresh oranges emerge as the largest segment, driven by several pivotal factors. Fresh oranges are a dietary staple worldwide, prized for their refreshing taste, nutritional value, and versatility in culinary applications. As a natural source of vitamin C, antioxidants, and fiber, fresh oranges are widely consumed as a healthy snack and ingredient in various dishes, beverages, and desserts. Further, the global demand for fresh fruits has witnessed sustained growth, driven by increasing consumer awareness of the importance of a balanced diet and the health benefits of consuming fresh produce. Additionally, the accessibility of fresh oranges through retail outlets, farmers' markets, and online platforms ensures widespread availability and affordability for consumers. Furthermore, the popularity of fresh oranges extends beyond individual consumption to foodservice establishments, juice bars, and the food processing industry, further bolstering the dominance of the fresh oranges segment in the market. As consumers continue to prioritize health and wellness, fresh oranges are expected to maintain their leadership position in the oranges market, serving as a symbol of vitality and nourishment.
Oranges Market Share Analysis: Organic Oranges market is poised to register the fastest growth rae over the forecast period to 2032
In the Oranges Market segmented by application, organic oranges emerge as the fastest-growing segment, propelled by several compelling factors. With increasing awareness of health and environmental sustainability, consumers are seeking organic produce, including oranges, for their perceived health benefits and reduced exposure to synthetic pesticides and chemicals. Organic farming practices prioritize soil health, biodiversity, and ecological balance, resulting in higher-quality fruits with superior taste and nutritional value. Further, stringent organic certification standards ensure transparency and integrity in the production process, further enhancing consumer trust and confidence in organic oranges. Additionally, the rising demand for organic oranges is driven by changing consumer preferences, as individuals prioritize natural and sustainable food choices that align with their values and lifestyle. Furthermore, the expanding availability of organic oranges through retail channels, farmers' markets, and online platforms provides consumers with greater access to organic options, driving the growth of the organic oranges segment in the market. As consumer demand for organic produce continues to rise, organic oranges are expected to maintain their rapid growth trajectory, reshaping the landscape of the oranges market.
Oranges Market Segmentation
By Product
Fresh
Processed
Frozen
By Application
Non-organic
Organic
Countries Analyzed
North America (US, Canada, Mexico)
Europe (Germany, UK, France, Spain, Italy, Russia, Rest of Europe)
Asia Pacific (China, India, Japan, South Korea, Australia, South East Asia, Rest of Asia)
South America (Brazil, Argentina, Rest of South America)
Middle East and Africa (Saudi Arabia, UAE, Rest of Middle East, South Africa, Egypt, Rest of Africa)
Oranges Companies Profiled in the Study
Berje Inc
Citrosuco
Citrus World Inc
Hyatt Fruit Co.
INDIAN RIVER FRUIT Co.
LEMONCONCENTRATE SLU
Louis Dreyfus Co. BV
Nielsen Citrus Products Co. Inc
PACIFIC COAST FRUIT PRODUCTS Ltd
Paradise Juice Pvt. Ltd
Perricone Farms
Schacht Groves
SEQUOIA-ORANGE Co. Inc
SUNRISE FRUITS COMPANY SL
The Fruit Co.
Trinity Fruit Co.
Tropicana Products Inc
Zain Natural Agro India Pvt. Ltd
*- List Not Exhaustive
Chapter 1. TABLE OF CONTENTS
Chapter 2. Introduction to Oranges Market
2.1. Market Overview
2.2. Key Statistics and Report Highlights
2.3. Scope of the Comprehensive Study
2.3.1. Market Definition
2.3.2 Countries and Regions Covered
2.3.3 Research Objective
2.3.4 Units, Currency, and Conversions
2.3.5 Industry Value Chain
2.4. Key Market Segments
2.5. Key Companies
2.6. Study Period
Chapter 3. Strategic Analysis Review
3.1. Oranges Pricing Analysis and Forecast
3.2. Porter’s Five Forces
3.3. Market Ecosystem
3.4. SWOT Analysis
3.5. Regulatory Scenario
3.3. Effects of Inflation, Russia-Ukraine War, moderating economic growth, and other macroeconomic factors
Chapter 4. Competitive Landscape
4.1. Market Share Analysis
4.1.1. Global Oranges Market Share by Company, 2023
4.1.2. Product Offerings of Leading Oranges Companies
4.2. Market Entropy
4.2.1. New Product Launches in the Industry
4.2.2. Mergers, Acquisitions, Joint ventures, and Partnerships
4.3. Key Strategies and Best Practices
Chapter 5. Global Market Projections: Best, Reference, and Low Case Scenarios
5.1. Growth Analysis- Case Scenario Definitions
5.2. Low Growth Case Scenario Forecasts
5.3. Reference Growth Case Scenario Forecasts
5.4. High Growth Case Scenario Forecasts
Chapter 6. Market Dynamics
6.1. Oranges Market Drivers
6.2. Oranges Market Challenges
6.6. Oranges Market Opportunities
6.4. Oranges Market Trends
Chapter 7. Global Oranges Market Outlook Trends
7.1. Global Oranges Revenue (USD Million) and CAGR (%) by Type (2021-2032)
7.2. Global Oranges Revenue (USD Million) and CAGR (%) by Application (2021-2032)
7.3. Global Oranges Revenue (USD Million) and CAGR (%) by Product (2021-2032)
By Product
Fresh
Processed
Frozen
By Application
Non-organic
Organic
Chapter 8. Global Oranges Regional Analysis and Outlook
8.1. Global Oranges Revenue (USD Million) By Regions (2021- 2032)
8.2. North America Oranges Revenue (USD Million) by Country (2021-2032)
8.2.1. United States Oranges Regional Analysis and Outlook
8.2.2. Canada Oranges Regional Analysis and Outlook
8.2.3. Mexico Oranges Regional Analysis and Outlook
8.3. Europe Oranges Revenue (USD Million), by Country (2021-2032)
8.3.1. Germany Oranges Regional Analysis and Outlook
8.3.2. France Oranges Regional Analysis and Outlook
8.3.3. United Kingdom Oranges Regional Analysis and Outlook
8.3.4. Spain Oranges Regional Analysis and Outlook
8.3.5. Italy Oranges Regional Analysis and Outlook
8.3.6. Russia Oranges Regional Analysis and Outlook
8.3.7. Rest of Europe Oranges Regional Analysis and Outlook
8.4. Asia Pacific Oranges Revenue (USD Million) by Country (2021-2032)
8.4.1. China Oranges Regional Analysis and Outlook
8.4.2. Japan Oranges Regional Analysis and Outlook
8.4.3. India Oranges Regional Analysis and Outlook
8.4.4. South Korea Oranges Regional Analysis and Outlook
8.4.5. Australia Oranges Regional Analysis and Outlook
8.4.6. South East Asia Oranges Regional Analysis and Outlook
8.4.7. Rest of Asia Pacific Oranges Regional Analysis and Outlook
8.5. South America Oranges Revenue (USD Million), by Country (2021-2032)
8.5.1. Brazil Oranges Regional Analysis and Outlook
8.5.2. Argentina Oranges Regional Analysis and Outlook
8.5.3. Rest of South America Oranges Regional Analysis and Outlook
8.6. Middle East and Africa Oranges Revenue (USD Million) by Country (2021-2032)
8.6.1. Middle East Oranges Regional Analysis and Outlook
8.6.2. Africa Oranges Regional Analysis and Outlook
Chapter 9. North America Oranges Analysis and Outlook
9.1. North America Oranges Revenue (USD Million) by Segments (2021-2032)
9.1.1. North America Oranges Revenue (USD Million) by Type (2021-2032)
9.1.2. North America Oranges Revenue (USD Million) by Application (2021-2032)
9.1.3. North America Oranges Revenue (USD Million) by Product (2021-2032)
By Product
Fresh
Processed
Frozen
By Application
Non-organic
Organic
Chapter 10. Europe Oranges Analysis and Outlook
10.1. Europe Oranges Revenue (USD Million), by Segments (USD Million) (2021-2032)
10.1.1. Europe Oranges Revenue (USD Million) by Type (2021-2032)
10.1.2. Europe Oranges Revenue (USD Million) by Application (2021-2032)
10.1.3. Europe Oranges Revenue (USD Million) by Product (2021-2032)
By Product
Fresh
Processed
Frozen
By Application
Non-organic
Organic
Chapter 11. Asia Pacific Oranges Analysis and Outlook
11.1. Asia Pacific Oranges Revenue (USD Million), and Revenue (USD Million) by Segments (2021-2032)
11.1.1. Asia Pacific Oranges Revenue (USD Million) by Type (2021-2032)
11.1.2. Asia Pacific Oranges Revenue (USD Million) by Application (2021-2032)
11.1.3. Asia Pacific Oranges Revenue (USD Million) by Product (2021-2032)
By Product
Fresh
Processed
Frozen
By Application
Non-organic
Organic
Chapter 12. South America Oranges Analysis and Outlook
12.1. South America Oranges Revenue (USD Million), by Segments (2021-2032)
12.1.1. South America Oranges Revenue (USD Million) by Type (2021-2032)
12.1.2. South America Oranges Revenue (USD Million) by Application (2021-2032)
12.1.3. South America Oranges Revenue (USD Million) by Product (2021-2032)
By Product
Fresh
Processed
Frozen
By Application
Non-organic
Organic
Chapter 13. Middle East and Africa Oranges Analysis and Outlook
13.1. Middle East and Africa Oranges Revenue (USD Million), by Segments (2021-2032)
13.1.1. Middle East and Africa Oranges Revenue (USD Million) by Type (2021-2032)
13.1.2. Middle East and Africa Oranges Revenue (USD Million) by Application (2021-2032)
13.1.3. Middle East and Africa Oranges Revenue (USD Million) by Product (2021-2032)
By Product
Fresh
Processed
Frozen
By Application
Non-organic
Organic
Chapter 14. Oranges Company Profiles
14.1 Business Overview
14.2 Product Profiles
14.3 SWOT Profiles
14.5 Recent Developments
14.6 Financial Profile
List of Companies
Berje Inc
Citrosuco
Citrus World Inc
Hyatt Fruit Co.
INDIAN RIVER FRUIT Co.
LEMONCONCENTRATE SLU
Louis Dreyfus Co. BV
Nielsen Citrus Products Co. Inc
PACIFIC COAST FRUIT PRODUCTS Ltd
Paradise Juice Pvt. Ltd
Perricone Farms
Schacht Groves
SEQUOIA-ORANGE Co. Inc
SUNRISE FRUITS COMPANY SL
The Fruit Co.
Trinity Fruit Co.
Tropicana Products Inc
Zain Natural Agro India Pvt. Ltd
15. Methodology and Data Sources
15.1 Customization Offerings
15.2 Subscription Services
15.3 Related Reports
15.4 Publisher Expertise
LIST OF TABLES
Table 1 Market Segmentation Analysis
Table 2 Global Oranges Market Share of Leading Companies, 2023
Table 3 Product Offerings of Leading Companies
Table 4 Low Growth Scenario Forecasts
Table 5 Reference Case Growth Scenario
Table 6 High Growth Case Scenario
Table 7 Global Oranges Revenue (USD Million) And CAGR (%) By Type (2021-2032)
Table 8 Global Oranges Revenue (USD Million) And CAGR (%) By Application (2021-2032)
Table 9 Global Oranges Revenue (USD Million) And CAGR (%) By Product (2021-2032)
Table 10 Global Oranges Market Revenue (USD Million) By Regions (2021-2032)
Table 11 Global Oranges Market Share (%) By Regions (2021-2032)
Table 12 North America Oranges Revenue (USD Million) By Country (2021-2032)
Table 13 Europe Oranges Revenue (USD Million) By Country (2021-2032)
Table 14 Asia Pacific Oranges Revenue (USD Million) By Country (2021-2032)
Table 15 South America Oranges Revenue (USD Million) By Country (2021-2032)
Table 16 Middle East and Africa Oranges Revenue (USD Million) By Region (2021-2032)
Table 17 North America Oranges Revenue (USD Million) By Type (2021-2032)
Table 18 North America Oranges Revenue (USD Million) By Application (2021-2032)
Table 19 North America Oranges Revenue (USD Million) By Product (2021-2032)
Table 20 Europe Oranges Revenue (USD Million) By Type (2021-2032)
Table 21 Europe Oranges Revenue (USD Million) By Application (2021-2032)
Table 22 Europe Oranges Revenue (USD Million) By Product (2021-2032)
Table 23 Asia Pacific Oranges Revenue (USD Million) By Type (2021-2032)
Table 24 Asia Pacific Oranges Revenue (USD Million) By Application (2021-2032)
Table 25 Asia Pacific Oranges Revenue (USD Million) By Product (2021-2032)
Table 26 South America Oranges Revenue (USD Million) By Type (2021-2032)
Table 27 South America Oranges Revenue (USD Million) By Application (2021-2032)
Table 28 South America Oranges Revenue (USD Million) By Product (2021-2032)
Table 29 Middle East and Africa Oranges Revenue (USD Million) By Type (2021-2032)
Table 30 Middle East and Africa Oranges Revenue (USD Million) By Application (2021-2032)
Table 31 Middle East and Africa Oranges Revenue (USD Million) By Product (2021-2032)
LIST OF FIGURES
Figure 1. Market Scope
Figure 2. Pricing Forecasts Per Unit, 2023- 2032
Figure 3. Porter’s Five Forces
Figure 4. Global Oranges Market Revenue (USD Million) By Regions (2021-2032)
Figure 5. Global Oranges Market Share (%) By Regions (2023)
Figure 6. North America Oranges Revenue (USD Million) By Country (2021-2032)
Figure 7. United States Oranges Revenue (USD Million) By Country (2021-2032)
Figure 8. Canada Oranges Revenue (USD Million) By Country (2021-2032)
Figure 9. Mexico Oranges Revenue (USD Million) By Country (2021-2032)
Figure 10. Europe Oranges Revenue (USD Million) By Country (2021-2032)
Figure 11. Germany Oranges Revenue (USD Million) By Country (2021-2032)
Figure 12. France Oranges Revenue (USD Million) By Country (2021-2032)
Figure 13. United Kingdom Oranges Revenue (USD Million) By Country (2021-2032)
Figure 14. Spain Oranges Revenue (USD Million) By Country (2021-2032)
Figure 15. Italy Oranges Revenue (USD Million) By Country (2021-2032)
Figure 16. Russia Oranges Revenue (USD Million) By Country (2021-2032)
Figure 17. Rest of Europe Oranges Revenue (USD Million) By Country (2021-2032)
Figure 11. Asia Pacific Oranges Revenue (USD Million) By Country (2021-2032)
Figure 12. China Oranges Revenue (USD Million) By Country (2021-2032)
Figure 13. Japan Oranges Revenue (USD Million) By Country (2021-2032)
Figure 14. India Oranges Revenue (USD Million) By Country (2021-2032)
Figure 15. South Korea Oranges Revenue (USD Million) By Country (2021-2032)
Figure 16. Australia Oranges Revenue (USD Million) By Country (2021-2032)
Figure 17. South East Asia Oranges Revenue (USD Million) By Country (2021-2032)
Figure 18. South America Oranges Revenue (USD Million) By Country (2021-2032)
Figure 19. Brazil Oranges Revenue (USD Million) By Country (2021-2032)
Figure 20. Argentina Oranges Revenue (USD Million) By Country (2021-2032)
Figure 21. Rest of Asia Pacific Oranges Revenue (USD Million) By Country (2021-2032)
Figure 22. Middle East and Africa Oranges Revenue (USD Million) By Region (2021-2032)
Figure 23. Saudi Arabia Oranges Revenue (USD Million) By Region (2021-2032)
Figure 24. The UAE Oranges Revenue (USD Million) By Region (2021-2032)
Figure 25. Rest of Middle East Oranges Revenue (USD Million) By Region (2021-2032)
Figure 26. South Africa Oranges Revenue (USD Million) By Region (2021-2032)
Figure 27. Africa Oranges Revenue (USD Million) By Region (2021-2032)
Figure 28. North America Oranges Revenue (USD Million) By Type (2021-2032)
Figure 29. North America Oranges Revenue (USD Million) By Application (2021-2032)
Figure 30. North America Oranges Revenue (USD Million) By Product (2021-2032)
Figure 31. Europe Oranges Revenue (USD Million) By Type (2021-2032)
Figure 32. Europe Oranges Revenue (USD Million) By Application (2021-2032)
Figure 33. Europe Oranges Revenue (USD Million) By Product (2021-2032)
Figure 34. Asia Pacific Oranges Revenue (USD Million) By Type (2021-2032)
Figure 35. Asia Pacific Oranges Revenue (USD Million) By Application (2021-2032)
Figure 36. Asia Pacific Oranges Revenue (USD Million) By Product (2021-2032)
Figure 37. South America Oranges Revenue (USD Million) By Type (2021-2032)
Figure 38. South America Oranges Revenue (USD Million) By Application (2021-2032)
Figure 39. South America Oranges Revenue (USD Million) By Product (2021-2032)
Figure 40. Middle East and Africa Oranges Revenue (USD Million) By Type (2021-2032)
Figure 41. Middle East and Africa Oranges Revenue (USD Million) By Application (2021-2032)
Figure 42. Middle East and Africa Oranges Revenue (USD Million) By Product (2021-2032)
By Product
Fresh
Processed
Frozen
By Application
Non-organic
Organic
Countries Analyzed
North America (US, Canada, Mexico)
Europe (Germany, UK, France, Spain, Italy, Russia, Rest of Europe)
Asia Pacific (China, India, Japan, South Korea, Australia, South East Asia, Rest of Asia)
South America (Brazil, Argentina, Rest of South America)
Middle East and Africa (Saudi Arabia, UAE, Rest of Middle East, South Africa, Egypt, Rest of Africa)
