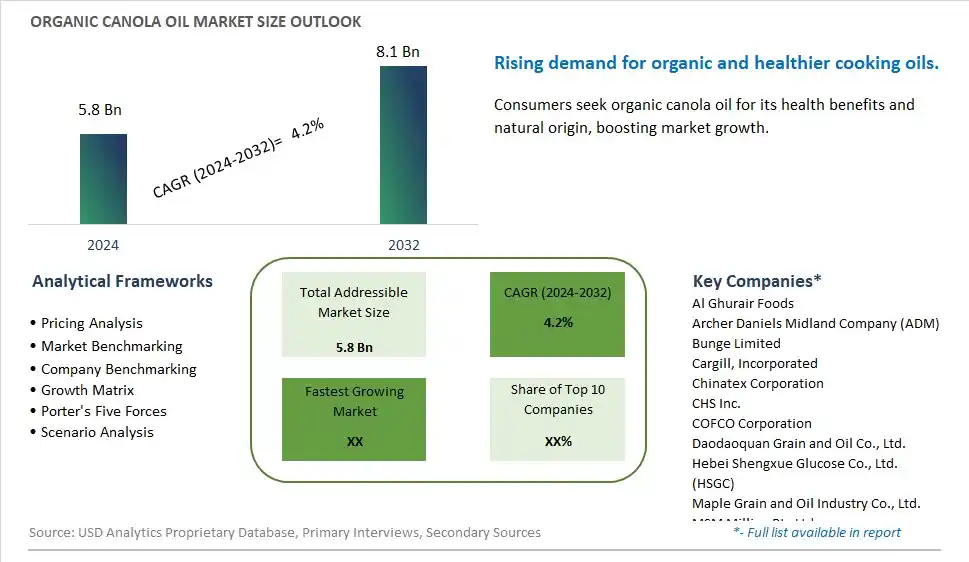
Global Organic Canola Oil Market Size is valued at $5.8 Billion in 2024 and is forecast to register a growth rate (CAGR) of 4.2% to reach $8.1 Billion by 2032.
The global Organic Canola Oil Market Comprehensive Study analyzes and forecasts the market size across 6 regions and 24 countries for diverse segments -By Type (Pressed, Leaching), By Application (Home Use, Food Service, Food Industrial, Others)
An Introduction to Organic Canola Oil Market
The organic canola oil market in 2024 is expanding rapidly, driven by the demand for healthy and sustainable cooking oils. Organic canola oil, made from organically grown canola seeds, offers a heart-healthy source of monounsaturated fats and omega-3 fatty acids. The market benefits from advancements in organic farming and oil extraction technologies that ensure product purity and quality. The trend towards clean label and natural ingredients is influencing product development. Increasing consumer interest in plant-based oils and the popularity of organic and non-GMO foods are further propelling market growth.
Organic Canola Oil Competitive Landscape
The market report analyses the leading companies in the industry including Al Ghurair Foods, Archer Daniels Midland Company (ADM), Bunge Limited, Cargill, Incorporated, Chinatex Corporation, CHS Inc., COFCO Corporation, Daodaoquan Grain and Oil Co., Ltd., Hebei Shengxue Glucose Co., Ltd. (HSGC), Maple Grain and Oil Industry Co., Ltd., MSM Milling Pty Ltd, Northstar Agri Industries LLC, Oliyar Production Company, Pacific Coast Canola LLC, Resaca Sun Feeds, Richardson Oilseed Limited, Riverina Oils & Bio Energy Pty Ltd, Riverland Oilseeds Pty Ltd, Sunora Foods Inc., Viterra Inc., Wilmar International Limited, Yingcheng Oil Company, and Others.
Organic Canola Oil Market Dynamics
Organic Canola Oil Market Trend: Growing Demand for Organic and Non-GMO Oils
The most prominent trend in the Organic Canola Oil Market is the growing demand for organic and non-GMO oils. Consumers are seeking high-quality canola oil that is free from pesticides, chemicals, and genetically modified organisms, driven by the desire for natural and clean-label products. This trend is fueled by the increasing awareness of the benefits of organic farming and the demand for transparency in food sourcing.
Organic Canola Oil Market Driver: Health Consciousness and Nutritional Benefits
A key driver in the Organic Canola Oil Market is health consciousness and the recognized nutritional benefits of canola oil. As more individuals focus on improving their diet and incorporating healthy fats, there is a rising demand for organic canola oil that provides essential omega-3 fatty acids and other beneficial nutrients. This demand supports the growth of the market as consumers seek natural and minimally processed oil options.
Organic Canola Oil Market Opportunity: Expansion into Culinary and Nutraceutical Applications
One significant opportunity in the Organic Canola Oil Market lies in the expansion into culinary and nutraceutical applications. Companies can develop new products that utilize organic canola oil in various formulations, such as salad dressings, cooking sprays, and dietary supplements, offering consumers versatile and health-focused options. By highlighting the benefits and versatility of organic canola oil, manufacturers can attract a broader consumer base and drive market growth.
Organic Canola Oil Market Share Analysis- Largest Segment by Type
The Pressed type is the largest segment in the Organic Canola Oil Market. This dominance stems from consumer preferences for minimally processed and natural products. Pressed canola oil, often referred to as expeller-pressed, is produced using mechanical pressing methods that preserve the natural nutrients and flavors of the oil without the use of chemical solvents. This method aligns with the organic movement's emphasis on natural and health-conscious production techniques. Consumers and manufacturers alike value pressed canola oil for its superior taste, higher nutrient retention, and lower levels of chemical residues compared to leaching methods. Additionally, the growing demand for organic foods and the increasing awareness of health and wellness issues drive preference for pressed over leached canola oil. As a result, the Pressed type remains the largest segment in the Organic Canola Oil Market.
Organic Canola Oil Market Share Analysis- Poised to Grow Fastest Over the Next Five Years by Application
The Food Service application segment is poised to grow fastest in the Organic Canola Oil Market over the next five years. This anticipated growth is driven by the expanding trend of organic and health-conscious eating in restaurants and food establishments. As more consumers seek out organic options when dining out, food service providers are responding by incorporating organic ingredients, including canola oil, into their offerings to meet customer demands. Additionally, food service establishments often require larger volumes of high-quality oil, and organic canola oil's favorable cooking properties make it an attractive choice for chefs and food operators. The rising trend of organic food menus and the increasing focus on sustainable and health-oriented practices in the food service industry contribute to the rapid growth of this segment.
Organic Canola Oil Market Segmentation
By Type
Pressed
Leaching
By Application
Home Use
Food Service
Food Industrial
Others
Countries Analyzed
North America (US, Canada, Mexico)
Europe (Germany, UK, France, Spain, Italy, Russia, Rest of Europe)
Asia Pacific (China, India, Japan, South Korea, Australia, South East Asia, Rest of Asia)
South America (Brazil, Argentina, Rest of South America)
Middle East and Africa (Saudi Arabia, UAE, Rest of Middle East, South Africa, Egypt, Rest of Africa)
Organic Canola Oil Companies Profiled in the Study
Al Ghurair Foods
Archer Daniels Midland Company (ADM)
Bunge Limited
Cargill, Incorporated
Chinatex Corporation
CHS Inc.
COFCO Corporation
Daodaoquan Grain and Oil Co., Ltd.
Hebei Shengxue Glucose Co., Ltd. (HSGC)
Maple Grain and Oil Industry Co., Ltd.
MSM Milling Pty Ltd
Northstar Agri Industries LLC
Oliyar Production Company
Pacific Coast Canola LLC
Resaca Sun Feeds
Richardson Oilseed Limited
Riverina Oils & Bio Energy Pty Ltd
Riverland Oilseeds Pty Ltd
Sunora Foods Inc.
Viterra Inc.
Wilmar International Limited
Yingcheng Oil Company
*- List Not Exhaustive
Chapter 1. TABLE OF CONTENTS
Chapter 2. Introduction to Organic Canola Oil Market
2.1. Market Overview
2.2. Key Statistics and Report Highlights
2.3. Scope of the Comprehensive Study
2.3.1. Market Definition
2.3.2 Countries and Regions Covered
2.3.3 Research Objective
2.3.4 Units, Currency, and Conversions
2.3.5 Industry Value Chain
2.4. Key Market Segments
2.5. Key Companies
2.6. Study Period
Chapter 3. Strategic Analysis Review
3.1. Organic Canola Oil Pricing Analysis and Forecast
3.2. Porter’s Five Forces
3.3. Market Ecosystem
3.4. SWOT Analysis
3.5. Regulatory Scenario
3.3. Effects of Inflation, Russia-Ukraine War, moderating economic growth, and other macroeconomic factors
Chapter 4. Competitive Landscape
4.1. Market Share Analysis
4.1.1. Global Organic Canola Oil Market Share by Company, 2023
4.1.2. Product Offerings of Leading Organic Canola Oil Companies
4.2. Market Entropy
4.2.1. New Product Launches in the Industry
4.2.2. Mergers, Acquisitions, Joint ventures, and Partnerships
4.3. Key Strategies and Best Practices
Chapter 5. Global Market Projections: Best, Reference, and Low Case Scenarios
5.1. Growth Analysis- Case Scenario Definitions
5.2. Low Growth Case Scenario Forecasts
5.3. Reference Growth Case Scenario Forecasts
5.4. High Growth Case Scenario Forecasts
Chapter 6. Market Dynamics
6.1. Organic Canola Oil Market Drivers
6.2. Organic Canola Oil Market Challenges
6.6. Organic Canola Oil Market Opportunities
6.4. Organic Canola Oil Market Trends
Chapter 7. Global Organic Canola Oil Market Outlook Trends
7.1. Global Organic Canola Oil Revenue (USD Million) and CAGR (%) by Type (2021-2032)
7.2. Global Organic Canola Oil Revenue (USD Million) and CAGR (%) by Application (2021-2032)
7.3. Global Organic Canola Oil Revenue (USD Million) and CAGR (%) by Product (2021-2032)
By Type
Pressed
Leaching
By Application
Home Use
Food Service
Food Industrial
Others
Chapter 8. Global Organic Canola Oil Regional Analysis and Outlook
8.1. Global Organic Canola Oil Revenue (USD Million) By Regions (2021- 2032)
8.2. North America Organic Canola Oil Revenue (USD Million) by Country (2021-2032)
8.2.1. United States Organic Canola Oil Regional Analysis and Outlook
8.2.2. Canada Organic Canola Oil Regional Analysis and Outlook
8.2.3. Mexico Organic Canola Oil Regional Analysis and Outlook
8.3. Europe Organic Canola Oil Revenue (USD Million), by Country (2021-2032)
8.3.1. Germany Organic Canola Oil Regional Analysis and Outlook
8.3.2. France Organic Canola Oil Regional Analysis and Outlook
8.3.3. United Kingdom Organic Canola Oil Regional Analysis and Outlook
8.3.4. Spain Organic Canola Oil Regional Analysis and Outlook
8.3.5. Italy Organic Canola Oil Regional Analysis and Outlook
8.3.6. Russia Organic Canola Oil Regional Analysis and Outlook
8.3.7. Rest of Europe Organic Canola Oil Regional Analysis and Outlook
8.4. Asia Pacific Organic Canola Oil Revenue (USD Million) by Country (2021-2032)
8.4.1. China Organic Canola Oil Regional Analysis and Outlook
8.4.2. Japan Organic Canola Oil Regional Analysis and Outlook
8.4.3. India Organic Canola Oil Regional Analysis and Outlook
8.4.4. South Korea Organic Canola Oil Regional Analysis and Outlook
8.4.5. Australia Organic Canola Oil Regional Analysis and Outlook
8.4.6. South East Asia Organic Canola Oil Regional Analysis and Outlook
8.4.7. Rest of Asia Pacific Organic Canola Oil Regional Analysis and Outlook
8.5. South America Organic Canola Oil Revenue (USD Million), by Country (2021-2032)
8.5.1. Brazil Organic Canola Oil Regional Analysis and Outlook
8.5.2. Argentina Organic Canola Oil Regional Analysis and Outlook
8.5.3. Rest of South America Organic Canola Oil Regional Analysis and Outlook
8.6. Middle East and Africa Organic Canola Oil Revenue (USD Million) by Country (2021-2032)
8.6.1. Middle East Organic Canola Oil Regional Analysis and Outlook
8.6.2. Africa Organic Canola Oil Regional Analysis and Outlook
Chapter 9. North America Organic Canola Oil Analysis and Outlook
9.1. North America Organic Canola Oil Revenue (USD Million) by Segments (2021-2032)
9.1.1. North America Organic Canola Oil Revenue (USD Million) by Type (2021-2032)
9.1.2. North America Organic Canola Oil Revenue (USD Million) by Application (2021-2032)
9.1.3. North America Organic Canola Oil Revenue (USD Million) by Product (2021-2032)
By Type
Pressed
Leaching
By Application
Home Use
Food Service
Food Industrial
Others
Chapter 10. Europe Organic Canola Oil Analysis and Outlook
10.1. Europe Organic Canola Oil Revenue (USD Million), by Segments (USD Million) (2021-2032)
10.1.1. Europe Organic Canola Oil Revenue (USD Million) by Type (2021-2032)
10.1.2. Europe Organic Canola Oil Revenue (USD Million) by Application (2021-2032)
10.1.3. Europe Organic Canola Oil Revenue (USD Million) by Product (2021-2032)
By Type
Pressed
Leaching
By Application
Home Use
Food Service
Food Industrial
Others
Chapter 11. Asia Pacific Organic Canola Oil Analysis and Outlook
11.1. Asia Pacific Organic Canola Oil Revenue (USD Million), and Revenue (USD Million) by Segments (2021-2032)
11.1.1. Asia Pacific Organic Canola Oil Revenue (USD Million) by Type (2021-2032)
11.1.2. Asia Pacific Organic Canola Oil Revenue (USD Million) by Application (2021-2032)
11.1.3. Asia Pacific Organic Canola Oil Revenue (USD Million) by Product (2021-2032)
By Type
Pressed
Leaching
By Application
Home Use
Food Service
Food Industrial
Others
Chapter 12. South America Organic Canola Oil Analysis and Outlook
12.1. South America Organic Canola Oil Revenue (USD Million), by Segments (2021-2032)
12.1.1. South America Organic Canola Oil Revenue (USD Million) by Type (2021-2032)
12.1.2. South America Organic Canola Oil Revenue (USD Million) by Application (2021-2032)
12.1.3. South America Organic Canola Oil Revenue (USD Million) by Product (2021-2032)
By Type
Pressed
Leaching
By Application
Home Use
Food Service
Food Industrial
Others
Chapter 13. Middle East and Africa Organic Canola Oil Analysis and Outlook
13.1. Middle East and Africa Organic Canola Oil Revenue (USD Million), by Segments (2021-2032)
13.1.1. Middle East and Africa Organic Canola Oil Revenue (USD Million) by Type (2021-2032)
13.1.2. Middle East and Africa Organic Canola Oil Revenue (USD Million) by Application (2021-2032)
13.1.3. Middle East and Africa Organic Canola Oil Revenue (USD Million) by Product (2021-2032)
By Type
Pressed
Leaching
By Application
Home Use
Food Service
Food Industrial
Others
Chapter 14. Organic Canola Oil Company Profiles
14.1 Business Overview
14.2 Product Profiles
14.3 SWOT Profiles
14.5 Recent Developments
14.6 Financial Profile
List of Companies
Al Ghurair Foods
Archer Daniels Midland Company (ADM)
Bunge Limited
Cargill, Incorporated
Chinatex Corporation
CHS Inc.
COFCO Corporation
Daodaoquan Grain and Oil Co., Ltd.
Hebei Shengxue Glucose Co., Ltd. (HSGC)
Maple Grain and Oil Industry Co., Ltd.
MSM Milling Pty Ltd
Northstar Agri Industries LLC
Oliyar Production Company
Pacific Coast Canola LLC
Resaca Sun Feeds
Richardson Oilseed Limited
Riverina Oils & Bio Energy Pty Ltd
Riverland Oilseeds Pty Ltd
Sunora Foods Inc.
Viterra Inc.
Wilmar International Limited
Yingcheng Oil Company
15. Methodology and Data Sources
15.1 Customization Offerings
15.2 Subscription Services
15.3 Related Reports
15.4 Publisher Expertise
LIST OF TABLES
Table 1 Market Segmentation Analysis
Table 2 Global Organic Canola Oil Market Share of Leading Companies, 2023
Table 3 Product Offerings of Leading Companies
Table 4 Low Growth Scenario Forecasts
Table 5 Reference Case Growth Scenario
Table 6 High Growth Case Scenario
Table 7 Global Organic Canola Oil Revenue (USD Million) And CAGR (%) By Type (2021-2032)
Table 8 Global Organic Canola Oil Revenue (USD Million) And CAGR (%) By Application (2021-2032)
Table 9 Global Organic Canola Oil Revenue (USD Million) And CAGR (%) By Product (2021-2032)
Table 10 Global Organic Canola Oil Market Revenue (USD Million) By Regions (2021-2032)
Table 11 Global Organic Canola Oil Market Share (%) By Regions (2021-2032)
Table 12 North America Organic Canola Oil Revenue (USD Million) By Country (2021-2032)
Table 13 Europe Organic Canola Oil Revenue (USD Million) By Country (2021-2032)
Table 14 Asia Pacific Organic Canola Oil Revenue (USD Million) By Country (2021-2032)
Table 15 South America Organic Canola Oil Revenue (USD Million) By Country (2021-2032)
Table 16 Middle East and Africa Organic Canola Oil Revenue (USD Million) By Region (2021-2032)
Table 17 North America Organic Canola Oil Revenue (USD Million) By Type (2021-2032)
Table 18 North America Organic Canola Oil Revenue (USD Million) By Application (2021-2032)
Table 19 North America Organic Canola Oil Revenue (USD Million) By Product (2021-2032)
Table 20 Europe Organic Canola Oil Revenue (USD Million) By Type (2021-2032)
Table 21 Europe Organic Canola Oil Revenue (USD Million) By Application (2021-2032)
Table 22 Europe Organic Canola Oil Revenue (USD Million) By Product (2021-2032)
Table 23 Asia Pacific Organic Canola Oil Revenue (USD Million) By Type (2021-2032)
Table 24 Asia Pacific Organic Canola Oil Revenue (USD Million) By Application (2021-2032)
Table 25 Asia Pacific Organic Canola Oil Revenue (USD Million) By Product (2021-2032)
Table 26 South America Organic Canola Oil Revenue (USD Million) By Type (2021-2032)
Table 27 South America Organic Canola Oil Revenue (USD Million) By Application (2021-2032)
Table 28 South America Organic Canola Oil Revenue (USD Million) By Product (2021-2032)
Table 29 Middle East and Africa Organic Canola Oil Revenue (USD Million) By Type (2021-2032)
Table 30 Middle East and Africa Organic Canola Oil Revenue (USD Million) By Application (2021-2032)
Table 31 Middle East and Africa Organic Canola Oil Revenue (USD Million) By Product (2021-2032)
LIST OF FIGURES
Figure 1. Market Scope
Figure 2. Pricing Forecasts Per Unit, 2023- 2032
Figure 3. Porter’s Five Forces
Figure 4. Global Organic Canola Oil Market Revenue (USD Million) By Regions (2021-2032)
Figure 5. Global Organic Canola Oil Market Share (%) By Regions (2023)
Figure 6. North America Organic Canola Oil Revenue (USD Million) By Country (2021-2032)
Figure 7. United States Organic Canola Oil Revenue (USD Million) By Country (2021-2032)
Figure 8. Canada Organic Canola Oil Revenue (USD Million) By Country (2021-2032)
Figure 9. Mexico Organic Canola Oil Revenue (USD Million) By Country (2021-2032)
Figure 10. Europe Organic Canola Oil Revenue (USD Million) By Country (2021-2032)
Figure 11. Germany Organic Canola Oil Revenue (USD Million) By Country (2021-2032)
Figure 12. France Organic Canola Oil Revenue (USD Million) By Country (2021-2032)
Figure 13. United Kingdom Organic Canola Oil Revenue (USD Million) By Country (2021-2032)
Figure 14. Spain Organic Canola Oil Revenue (USD Million) By Country (2021-2032)
Figure 15. Italy Organic Canola Oil Revenue (USD Million) By Country (2021-2032)
Figure 16. Russia Organic Canola Oil Revenue (USD Million) By Country (2021-2032)
Figure 17. Rest of Europe Organic Canola Oil Revenue (USD Million) By Country (2021-2032)
Figure 11. Asia Pacific Organic Canola Oil Revenue (USD Million) By Country (2021-2032)
Figure 12. China Organic Canola Oil Revenue (USD Million) By Country (2021-2032)
Figure 13. Japan Organic Canola Oil Revenue (USD Million) By Country (2021-2032)
Figure 14. India Organic Canola Oil Revenue (USD Million) By Country (2021-2032)
Figure 15. South Korea Organic Canola Oil Revenue (USD Million) By Country (2021-2032)
Figure 16. Australia Organic Canola Oil Revenue (USD Million) By Country (2021-2032)
Figure 17. South East Asia Organic Canola Oil Revenue (USD Million) By Country (2021-2032)
Figure 18. South America Organic Canola Oil Revenue (USD Million) By Country (2021-2032)
Figure 19. Brazil Organic Canola Oil Revenue (USD Million) By Country (2021-2032)
Figure 20. Argentina Organic Canola Oil Revenue (USD Million) By Country (2021-2032)
Figure 21. Rest of Asia Pacific Organic Canola Oil Revenue (USD Million) By Country (2021-2032)
Figure 22. Middle East and Africa Organic Canola Oil Revenue (USD Million) By Region (2021-2032)
Figure 23. Saudi Arabia Organic Canola Oil Revenue (USD Million) By Region (2021-2032)
Figure 24. The UAE Organic Canola Oil Revenue (USD Million) By Region (2021-2032)
Figure 25. Rest of Middle East Organic Canola Oil Revenue (USD Million) By Region (2021-2032)
Figure 26. South Africa Organic Canola Oil Revenue (USD Million) By Region (2021-2032)
Figure 27. Africa Organic Canola Oil Revenue (USD Million) By Region (2021-2032)
Figure 28. North America Organic Canola Oil Revenue (USD Million) By Type (2021-2032)
Figure 29. North America Organic Canola Oil Revenue (USD Million) By Application (2021-2032)
Figure 30. North America Organic Canola Oil Revenue (USD Million) By Product (2021-2032)
Figure 31. Europe Organic Canola Oil Revenue (USD Million) By Type (2021-2032)
Figure 32. Europe Organic Canola Oil Revenue (USD Million) By Application (2021-2032)
Figure 33. Europe Organic Canola Oil Revenue (USD Million) By Product (2021-2032)
Figure 34. Asia Pacific Organic Canola Oil Revenue (USD Million) By Type (2021-2032)
Figure 35. Asia Pacific Organic Canola Oil Revenue (USD Million) By Application (2021-2032)
Figure 36. Asia Pacific Organic Canola Oil Revenue (USD Million) By Product (2021-2032)
Figure 37. South America Organic Canola Oil Revenue (USD Million) By Type (2021-2032)
Figure 38. South America Organic Canola Oil Revenue (USD Million) By Application (2021-2032)
Figure 39. South America Organic Canola Oil Revenue (USD Million) By Product (2021-2032)
Figure 40. Middle East and Africa Organic Canola Oil Revenue (USD Million) By Type (2021-2032)
Figure 41. Middle East and Africa Organic Canola Oil Revenue (USD Million) By Application (2021-2032)
Figure 42. Middle East and Africa Organic Canola Oil Revenue (USD Million) By Product (2021-2032)
By Type
Pressed
Leaching
By Application
Home Use
Food Service
Food Industrial
Others
Countries Analyzed
North America (US, Canada, Mexico)
Europe (Germany, UK, France, Spain, Italy, Russia, Rest of Europe)
Asia Pacific (China, India, Japan, South Korea, Australia, South East Asia, Rest of Asia)
South America (Brazil, Argentina, Rest of South America)
Middle East and Africa (Saudi Arabia, UAE, Rest of Middle East, South Africa, Egypt, Rest of Africa)
