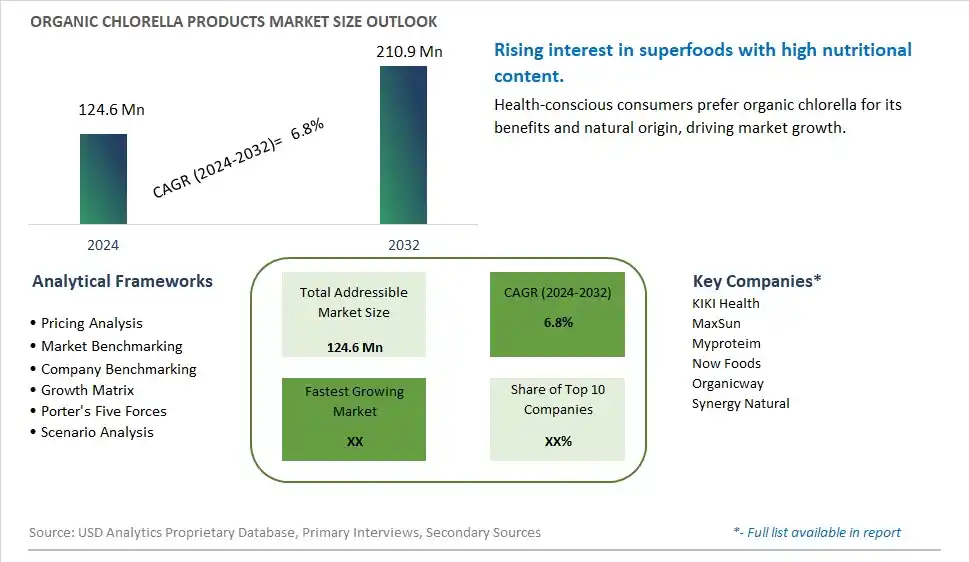
Global Organic Chlorella Products Market Size is valued at $124.6 Million in 2024 and is forecast to register a growth rate (CAGR) of 6.8% to reach $210.9 Million by 2032.
The global Organic Chlorella Products Market Comprehensive Study analyzes and forecasts the market size across 6 regions and 24 countries for diverse segments -By Type (Tablets, Powder), By Application (Health Products, Food Industry, Others)
An Introduction to Organic Chlorella Products Market
In 2024, the organic chlorella products market is thriving, fueled by the demand for superfoods that offer a range of health benefits. Organic chlorella, a type of freshwater algae, is valued for its high protein content, essential amino acids, and detoxifying properties. The market benefits from advancements in chlorella cultivation and processing technologies that enhance product purity and bioavailability. The trend towards clean label and natural ingredients is influencing product development. Increasing consumer interest in health and wellness, supported by the popularity of functional foods and supplements, is further supporting market growth.
Organic Chlorella Products Competitive Landscape
The market report analyses the leading companies in the industry including KIKI Health, MaxSun, Myproteim, Now Foods, Organicway, Synergy Natural, and Others.
Organic Chlorella Products Market Dynamics
Organic Chlorella Products Market Trend: Growing Popularity of Algae-Based Supplements
The most prominent trend in the Organic Chlorella Products Market is the growing popularity of algae-based supplements. Organic chlorella, known for its high nutrient content and detoxifying properties, is becoming a sought-after ingredient in dietary supplements and health products. This trend is driven by the demand for natural and nutrient-dense superfoods that support overall health and wellness.
Organic Chlorella Products Market Driver: Health Consciousness and Nutritional Benefits
A key driver in the Organic Chlorella Products Market is health consciousness and the recognized nutritional benefits of chlorella. As more individuals focus on improving their diet and incorporating nutrient-rich foods, there is a rising demand for organic chlorella products that offer essential vitamins, minerals, and antioxidants. This demand supports the growth of the market as consumers seek health-enhancing supplements.
Organic Chlorella Products Market Opportunity: Expansion into Functional Foods and Beverages
One significant opportunity in the Organic Chlorella Products Market lies in the expansion into functional foods and beverages. Companies can innovate by incorporating organic chlorella into a variety of products, such as smoothies, energy bars, and dietary supplements, offering consumers convenient and effective ways to enhance their intake of this superfood. By highlighting the health benefits and versatility of organic chlorella, manufacturers can attract a broader consumer base and drive market growth.
Organic Chlorella Products Market Share Analysis- Largest Segment by Type
In the Organic Chlorella Products Market, the Tablets segment stands as the largest due to several compelling reasons. Tablets offer a convenient, precise, and portable way to consume chlorella, which aligns well with the busy lifestyles of modern consumers who seek easy health supplements. This format is favored for its dosage accuracy and ease of integration into daily routines, making it a popular choice among health-conscious individuals. Additionally, tablets have a longer shelf life and better stability compared to powders, which can degrade over time when exposed to air and moisture. The preference for tablets is also driven by their consumer-friendly packaging and the perceived higher quality associated with a more refined supplement form. These factors collectively make tablets the dominant segment in the Organic Chlorella Products Market.
Organic Chlorella Products Market Share Analysis- Poised to Grow Fastest Over the Next Five Years by Application
The Health Products application segment in the Organic Chlorella Products Market is expected to grow the fastest over the next five years. This rapid growth can be attributed to the increasing consumer focus on wellness and preventive health. Chlorella, known for its high nutrient density, including vitamins, minerals, and antioxidants, is gaining popularity as a superfood supplement that supports overall health and detoxification. As awareness of the benefits of chlorella continues to rise, health products incorporating this algae are becoming more prevalent in the market. Furthermore, the growth of the health and wellness sector, with its emphasis on organic and natural ingredients, further propels the demand for chlorella-based health products. The integration of chlorella into dietary supplements and functional foods, driven by consumer demand for natural health solutions, positions this segment as the fastest-growing in the market.
Organic Chlorella Products Market Segmentation
By Type
Tablets
Powder
By Application
Health Products
Food Industry
Others
Countries Analyzed
North America (US, Canada, Mexico)
Europe (Germany, UK, France, Spain, Italy, Russia, Rest of Europe)
Asia Pacific (China, India, Japan, South Korea, Australia, South East Asia, Rest of Asia)
South America (Brazil, Argentina, Rest of South America)
Middle East and Africa (Saudi Arabia, UAE, Rest of Middle East, South Africa, Egypt, Rest of Africa)
Organic Chlorella Products Companies Profiled in the Study
KIKI Health
MaxSun
Myproteim
Now Foods
Organicway
Synergy Natural
*- List Not Exhaustive
Chapter 1. TABLE OF CONTENTS
Chapter 2. Introduction to Organic Chlorella Products Market
2.1. Market Overview
2.2. Key Statistics and Report Highlights
2.3. Scope of the Comprehensive Study
2.3.1. Market Definition
2.3.2 Countries and Regions Covered
2.3.3 Research Objective
2.3.4 Units, Currency, and Conversions
2.3.5 Industry Value Chain
2.4. Key Market Segments
2.5. Key Companies
2.6. Study Period
Chapter 3. Strategic Analysis Review
3.1. Organic Chlorella Products Pricing Analysis and Forecast
3.2. Porter’s Five Forces
3.3. Market Ecosystem
3.4. SWOT Analysis
3.5. Regulatory Scenario
3.3. Effects of Inflation, Russia-Ukraine War, moderating economic growth, and other macroeconomic factors
Chapter 4. Competitive Landscape
4.1. Market Share Analysis
4.1.1. Global Organic Chlorella Products Market Share by Company, 2023
4.1.2. Product Offerings of Leading Organic Chlorella Products Companies
4.2. Market Entropy
4.2.1. New Product Launches in the Industry
4.2.2. Mergers, Acquisitions, Joint ventures, and Partnerships
4.3. Key Strategies and Best Practices
Chapter 5. Global Market Projections: Best, Reference, and Low Case Scenarios
5.1. Growth Analysis- Case Scenario Definitions
5.2. Low Growth Case Scenario Forecasts
5.3. Reference Growth Case Scenario Forecasts
5.4. High Growth Case Scenario Forecasts
Chapter 6. Market Dynamics
6.1. Organic Chlorella Products Market Drivers
6.2. Organic Chlorella Products Market Challenges
6.6. Organic Chlorella Products Market Opportunities
6.4. Organic Chlorella Products Market Trends
Chapter 7. Global Organic Chlorella Products Market Outlook Trends
7.1. Global Organic Chlorella Products Revenue (USD Million) and CAGR (%) by Type (2021-2032)
7.2. Global Organic Chlorella Products Revenue (USD Million) and CAGR (%) by Application (2021-2032)
7.3. Global Organic Chlorella Products Revenue (USD Million) and CAGR (%) by Product (2021-2032)
By Type
Tablets
Powder
By Application
Health Products
Food Industry
Others
Chapter 8. Global Organic Chlorella Products Regional Analysis and Outlook
8.1. Global Organic Chlorella Products Revenue (USD Million) By Regions (2021- 2032)
8.2. North America Organic Chlorella Products Revenue (USD Million) by Country (2021-2032)
8.2.1. United States Organic Chlorella Products Regional Analysis and Outlook
8.2.2. Canada Organic Chlorella Products Regional Analysis and Outlook
8.2.3. Mexico Organic Chlorella Products Regional Analysis and Outlook
8.3. Europe Organic Chlorella Products Revenue (USD Million), by Country (2021-2032)
8.3.1. Germany Organic Chlorella Products Regional Analysis and Outlook
8.3.2. France Organic Chlorella Products Regional Analysis and Outlook
8.3.3. United Kingdom Organic Chlorella Products Regional Analysis and Outlook
8.3.4. Spain Organic Chlorella Products Regional Analysis and Outlook
8.3.5. Italy Organic Chlorella Products Regional Analysis and Outlook
8.3.6. Russia Organic Chlorella Products Regional Analysis and Outlook
8.3.7. Rest of Europe Organic Chlorella Products Regional Analysis and Outlook
8.4. Asia Pacific Organic Chlorella Products Revenue (USD Million) by Country (2021-2032)
8.4.1. China Organic Chlorella Products Regional Analysis and Outlook
8.4.2. Japan Organic Chlorella Products Regional Analysis and Outlook
8.4.3. India Organic Chlorella Products Regional Analysis and Outlook
8.4.4. South Korea Organic Chlorella Products Regional Analysis and Outlook
8.4.5. Australia Organic Chlorella Products Regional Analysis and Outlook
8.4.6. South East Asia Organic Chlorella Products Regional Analysis and Outlook
8.4.7. Rest of Asia Pacific Organic Chlorella Products Regional Analysis and Outlook
8.5. South America Organic Chlorella Products Revenue (USD Million), by Country (2021-2032)
8.5.1. Brazil Organic Chlorella Products Regional Analysis and Outlook
8.5.2. Argentina Organic Chlorella Products Regional Analysis and Outlook
8.5.3. Rest of South America Organic Chlorella Products Regional Analysis and Outlook
8.6. Middle East and Africa Organic Chlorella Products Revenue (USD Million) by Country (2021-2032)
8.6.1. Middle East Organic Chlorella Products Regional Analysis and Outlook
8.6.2. Africa Organic Chlorella Products Regional Analysis and Outlook
Chapter 9. North America Organic Chlorella Products Analysis and Outlook
9.1. North America Organic Chlorella Products Revenue (USD Million) by Segments (2021-2032)
9.1.1. North America Organic Chlorella Products Revenue (USD Million) by Type (2021-2032)
9.1.2. North America Organic Chlorella Products Revenue (USD Million) by Application (2021-2032)
9.1.3. North America Organic Chlorella Products Revenue (USD Million) by Product (2021-2032)
By Type
Tablets
Powder
By Application
Health Products
Food Industry
Others
Chapter 10. Europe Organic Chlorella Products Analysis and Outlook
10.1. Europe Organic Chlorella Products Revenue (USD Million), by Segments (USD Million) (2021-2032)
10.1.1. Europe Organic Chlorella Products Revenue (USD Million) by Type (2021-2032)
10.1.2. Europe Organic Chlorella Products Revenue (USD Million) by Application (2021-2032)
10.1.3. Europe Organic Chlorella Products Revenue (USD Million) by Product (2021-2032)
By Type
Tablets
Powder
By Application
Health Products
Food Industry
Others
Chapter 11. Asia Pacific Organic Chlorella Products Analysis and Outlook
11.1. Asia Pacific Organic Chlorella Products Revenue (USD Million), and Revenue (USD Million) by Segments (2021-2032)
11.1.1. Asia Pacific Organic Chlorella Products Revenue (USD Million) by Type (2021-2032)
11.1.2. Asia Pacific Organic Chlorella Products Revenue (USD Million) by Application (2021-2032)
11.1.3. Asia Pacific Organic Chlorella Products Revenue (USD Million) by Product (2021-2032)
By Type
Tablets
Powder
By Application
Health Products
Food Industry
Others
Chapter 12. South America Organic Chlorella Products Analysis and Outlook
12.1. South America Organic Chlorella Products Revenue (USD Million), by Segments (2021-2032)
12.1.1. South America Organic Chlorella Products Revenue (USD Million) by Type (2021-2032)
12.1.2. South America Organic Chlorella Products Revenue (USD Million) by Application (2021-2032)
12.1.3. South America Organic Chlorella Products Revenue (USD Million) by Product (2021-2032)
By Type
Tablets
Powder
By Application
Health Products
Food Industry
Others
Chapter 13. Middle East and Africa Organic Chlorella Products Analysis and Outlook
13.1. Middle East and Africa Organic Chlorella Products Revenue (USD Million), by Segments (2021-2032)
13.1.1. Middle East and Africa Organic Chlorella Products Revenue (USD Million) by Type (2021-2032)
13.1.2. Middle East and Africa Organic Chlorella Products Revenue (USD Million) by Application (2021-2032)
13.1.3. Middle East and Africa Organic Chlorella Products Revenue (USD Million) by Product (2021-2032)
By Type
Tablets
Powder
By Application
Health Products
Food Industry
Others
Chapter 14. Organic Chlorella Products Company Profiles
14.1 Business Overview
14.2 Product Profiles
14.3 SWOT Profiles
14.5 Recent Developments
14.6 Financial Profile
List of Companies
KIKI Health
MaxSun
Myproteim
Now Foods
Organicway
Synergy Natural
15. Methodology and Data Sources
15.1 Customization Offerings
15.2 Subscription Services
15.3 Related Reports
15.4 Publisher Expertise
LIST OF TABLES
Table 1 Market Segmentation Analysis
Table 2 Global Organic Chlorella Products Market Share of Leading Companies, 2023
Table 3 Product Offerings of Leading Companies
Table 4 Low Growth Scenario Forecasts
Table 5 Reference Case Growth Scenario
Table 6 High Growth Case Scenario
Table 7 Global Organic Chlorella Products Revenue (USD Million) And CAGR (%) By Type (2021-2032)
Table 8 Global Organic Chlorella Products Revenue (USD Million) And CAGR (%) By Application (2021-2032)
Table 9 Global Organic Chlorella Products Revenue (USD Million) And CAGR (%) By Product (2021-2032)
Table 10 Global Organic Chlorella Products Market Revenue (USD Million) By Regions (2021-2032)
Table 11 Global Organic Chlorella Products Market Share (%) By Regions (2021-2032)
Table 12 North America Organic Chlorella Products Revenue (USD Million) By Country (2021-2032)
Table 13 Europe Organic Chlorella Products Revenue (USD Million) By Country (2021-2032)
Table 14 Asia Pacific Organic Chlorella Products Revenue (USD Million) By Country (2021-2032)
Table 15 South America Organic Chlorella Products Revenue (USD Million) By Country (2021-2032)
Table 16 Middle East and Africa Organic Chlorella Products Revenue (USD Million) By Region (2021-2032)
Table 17 North America Organic Chlorella Products Revenue (USD Million) By Type (2021-2032)
Table 18 North America Organic Chlorella Products Revenue (USD Million) By Application (2021-2032)
Table 19 North America Organic Chlorella Products Revenue (USD Million) By Product (2021-2032)
Table 20 Europe Organic Chlorella Products Revenue (USD Million) By Type (2021-2032)
Table 21 Europe Organic Chlorella Products Revenue (USD Million) By Application (2021-2032)
Table 22 Europe Organic Chlorella Products Revenue (USD Million) By Product (2021-2032)
Table 23 Asia Pacific Organic Chlorella Products Revenue (USD Million) By Type (2021-2032)
Table 24 Asia Pacific Organic Chlorella Products Revenue (USD Million) By Application (2021-2032)
Table 25 Asia Pacific Organic Chlorella Products Revenue (USD Million) By Product (2021-2032)
Table 26 South America Organic Chlorella Products Revenue (USD Million) By Type (2021-2032)
Table 27 South America Organic Chlorella Products Revenue (USD Million) By Application (2021-2032)
Table 28 South America Organic Chlorella Products Revenue (USD Million) By Product (2021-2032)
Table 29 Middle East and Africa Organic Chlorella Products Revenue (USD Million) By Type (2021-2032)
Table 30 Middle East and Africa Organic Chlorella Products Revenue (USD Million) By Application (2021-2032)
Table 31 Middle East and Africa Organic Chlorella Products Revenue (USD Million) By Product (2021-2032)
LIST OF FIGURES
Figure 1. Market Scope
Figure 2. Pricing Forecasts Per Unit, 2023- 2032
Figure 3. Porter’s Five Forces
Figure 4. Global Organic Chlorella Products Market Revenue (USD Million) By Regions (2021-2032)
Figure 5. Global Organic Chlorella Products Market Share (%) By Regions (2023)
Figure 6. North America Organic Chlorella Products Revenue (USD Million) By Country (2021-2032)
Figure 7. United States Organic Chlorella Products Revenue (USD Million) By Country (2021-2032)
Figure 8. Canada Organic Chlorella Products Revenue (USD Million) By Country (2021-2032)
Figure 9. Mexico Organic Chlorella Products Revenue (USD Million) By Country (2021-2032)
Figure 10. Europe Organic Chlorella Products Revenue (USD Million) By Country (2021-2032)
Figure 11. Germany Organic Chlorella Products Revenue (USD Million) By Country (2021-2032)
Figure 12. France Organic Chlorella Products Revenue (USD Million) By Country (2021-2032)
Figure 13. United Kingdom Organic Chlorella Products Revenue (USD Million) By Country (2021-2032)
Figure 14. Spain Organic Chlorella Products Revenue (USD Million) By Country (2021-2032)
Figure 15. Italy Organic Chlorella Products Revenue (USD Million) By Country (2021-2032)
Figure 16. Russia Organic Chlorella Products Revenue (USD Million) By Country (2021-2032)
Figure 17. Rest of Europe Organic Chlorella Products Revenue (USD Million) By Country (2021-2032)
Figure 11. Asia Pacific Organic Chlorella Products Revenue (USD Million) By Country (2021-2032)
Figure 12. China Organic Chlorella Products Revenue (USD Million) By Country (2021-2032)
Figure 13. Japan Organic Chlorella Products Revenue (USD Million) By Country (2021-2032)
Figure 14. India Organic Chlorella Products Revenue (USD Million) By Country (2021-2032)
Figure 15. South Korea Organic Chlorella Products Revenue (USD Million) By Country (2021-2032)
Figure 16. Australia Organic Chlorella Products Revenue (USD Million) By Country (2021-2032)
Figure 17. South East Asia Organic Chlorella Products Revenue (USD Million) By Country (2021-2032)
Figure 18. South America Organic Chlorella Products Revenue (USD Million) By Country (2021-2032)
Figure 19. Brazil Organic Chlorella Products Revenue (USD Million) By Country (2021-2032)
Figure 20. Argentina Organic Chlorella Products Revenue (USD Million) By Country (2021-2032)
Figure 21. Rest of Asia Pacific Organic Chlorella Products Revenue (USD Million) By Country (2021-2032)
Figure 22. Middle East and Africa Organic Chlorella Products Revenue (USD Million) By Region (2021-2032)
Figure 23. Saudi Arabia Organic Chlorella Products Revenue (USD Million) By Region (2021-2032)
Figure 24. The UAE Organic Chlorella Products Revenue (USD Million) By Region (2021-2032)
Figure 25. Rest of Middle East Organic Chlorella Products Revenue (USD Million) By Region (2021-2032)
Figure 26. South Africa Organic Chlorella Products Revenue (USD Million) By Region (2021-2032)
Figure 27. Africa Organic Chlorella Products Revenue (USD Million) By Region (2021-2032)
Figure 28. North America Organic Chlorella Products Revenue (USD Million) By Type (2021-2032)
Figure 29. North America Organic Chlorella Products Revenue (USD Million) By Application (2021-2032)
Figure 30. North America Organic Chlorella Products Revenue (USD Million) By Product (2021-2032)
Figure 31. Europe Organic Chlorella Products Revenue (USD Million) By Type (2021-2032)
Figure 32. Europe Organic Chlorella Products Revenue (USD Million) By Application (2021-2032)
Figure 33. Europe Organic Chlorella Products Revenue (USD Million) By Product (2021-2032)
Figure 34. Asia Pacific Organic Chlorella Products Revenue (USD Million) By Type (2021-2032)
Figure 35. Asia Pacific Organic Chlorella Products Revenue (USD Million) By Application (2021-2032)
Figure 36. Asia Pacific Organic Chlorella Products Revenue (USD Million) By Product (2021-2032)
Figure 37. South America Organic Chlorella Products Revenue (USD Million) By Type (2021-2032)
Figure 38. South America Organic Chlorella Products Revenue (USD Million) By Application (2021-2032)
Figure 39. South America Organic Chlorella Products Revenue (USD Million) By Product (2021-2032)
Figure 40. Middle East and Africa Organic Chlorella Products Revenue (USD Million) By Type (2021-2032)
Figure 41. Middle East and Africa Organic Chlorella Products Revenue (USD Million) By Application (2021-2032)
Figure 42. Middle East and Africa Organic Chlorella Products Revenue (USD Million) By Product (2021-2032)
By Type
Tablets
Powder
By Application
Health Products
Food Industry
Others
Countries Analyzed
North America (US, Canada, Mexico)
Europe (Germany, UK, France, Spain, Italy, Russia, Rest of Europe)
Asia Pacific (China, India, Japan, South Korea, Australia, South East Asia, Rest of Asia)
South America (Brazil, Argentina, Rest of South America)
Middle East and Africa (Saudi Arabia, UAE, Rest of Middle East, South Africa, Egypt, Rest of Africa)
