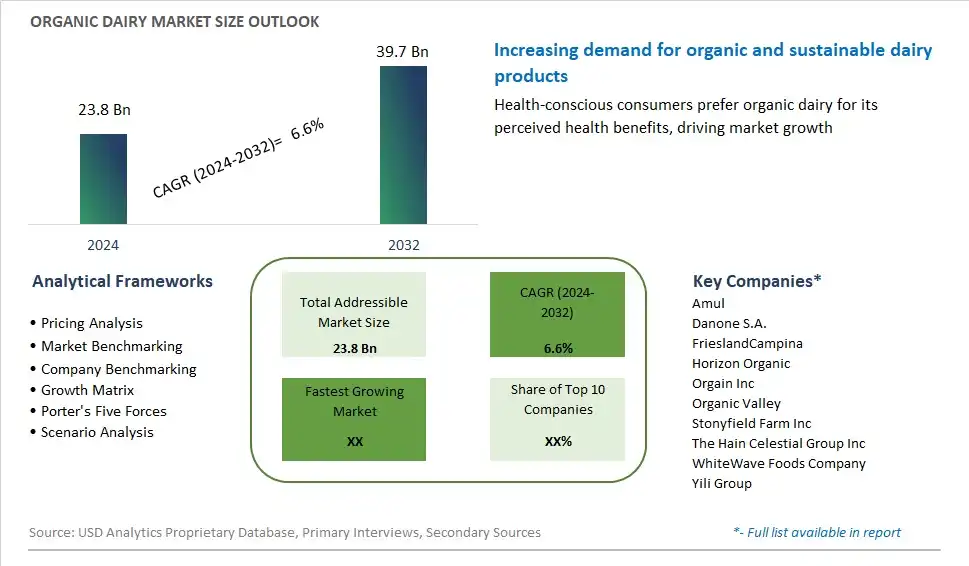
Global Organic Dairy Market Size is valued at $23.8 Billion in 2024 and is forecast to register a growth rate (CAGR) of 6.6% to reach $39.7 Billion by 2032.
The global Organic Dairy Market Comprehensive Study analyzes and forecasts the market size across 6 regions and 24 countries for diverse segments -By Product (Organic Milk, Yogurt, Organic Cheese, Organic Butter, Organic Cream and Creamers, Others), By Distribution Channel (Supermarkets/Hypermarkets, Specialty Stores, Online, Food Service, Institutional Buyers), By End-User (Health-Conscious Consumers, Environmental Advocates, Ethical Consumers, Family Consumers, Millennials, Seniors)
An Introduction to Organic Dairy Market
In 2024, the organic dairy market continues to thrive as consumers prioritize health, sustainability, and animal welfare in their food choices. Organic dairy products, sourced from pasture-raised cows that are fed organic feed and managed according to strict organic standards, are gaining popularity for their superior nutritional quality and environmental stewardship. With growing concerns about the use of antibiotics, hormones, and pesticides in conventional dairy production, consumers are seeking reassurance through organic certification, which prohibits the use of synthetic inputs and emphasizes pasture-based farming practices. Moreover, the demand for organic dairy extends beyond fluid milk to include a wide range of products such as cheese, yogurt, butter, and ice cream, offering consumers a diverse selection of organic options to meet their dietary preferences and culinary needs. As organic dairy continues to carve out a significant share of the dairy market, producers and retailers are investing in organic production systems and distribution channels to meet the rising demand for premium, ethically sourced dairy products.
Organic Dairy Competitive Landscape
The market report analyses the leading companies in the industry including Amul, Danone S.A., FrieslandCampina, Horizon Organic, Orgain Inc, Organic Valley, Stonyfield Farm Inc, The Hain Celestial Group Inc, WhiteWave Foods Company, Yili Group, and Others.
Organic Dairy Market Dynamics
Organic Dairy Market Trend: Increasing Consumer Preference for Organic and Sustainable Foods
The market for organic dairy is experiencing a prominent trend driven by the increasing consumer preference for organic and sustainable foods. With growing awareness of the environmental and health benefits of organic farming practices, consumers are seeking out organic dairy products as healthier and more environmentally friendly alternatives to conventional options. Organic dairy products are produced without the use of synthetic pesticides, hormones, or antibiotics, and are sourced from animals raised on organic feed and pasture. This trend is fueled by concerns over food safety, animal welfare, and environmental sustainability, driving the demand for organic dairy products across various consumer segments.
Market Driver: Health and Nutrition Consciousness
The market for organic dairy is primarily driven by the growing consciousness regarding health and nutrition among consumers. Organic dairy products are perceived as being more nutritious and free from potentially harmful chemicals and additives commonly found in conventional dairy products. Consumers are increasingly prioritizing organic options for their families, especially for products like milk, yogurt, and cheese, which are staples in many diets. Additionally, organic dairy products are often higher in beneficial nutrients such as omega-3 fatty acids, antioxidants, and vitamins due to the animals' natural grazing diets and healthier living conditions. This driver is reinforced by the growing body of research supporting the nutritional superiority of organic dairy products, driving consumer demand for these healthier alternatives.
Market Opportunity: Expansion into Niche Product Categories
The market for organic dairy presents a significant opportunity for companies to expand into niche product categories and cater to specific consumer preferences and dietary needs. While organic milk, yogurt, and cheese remain popular staples, there is potential for innovation and diversification within the organic dairy market. Companies can explore the development of niche products such as organic grass-fed butter, artisanal organic ice cream, lactose-free organic dairy alternatives, and probiotic-rich organic kefir. By tapping into niche segments and offering unique organic dairy products tailored to evolving consumer tastes and preferences, companies can differentiate themselves in the market and attract new customer demographics. Additionally, strategic partnerships with organic farmers, retailers, and specialty stores can facilitate market penetration and distribution of niche organic dairy products, driving growth and market expansion.
Organic Dairy Market Share Analysis: Organic Milk held the dominant market share in 2024
The "Organic Milk" segment is the largest within the Organic Dairy Market, driven by its widespread consumption, nutritional benefits, and versatility in various culinary applications. Organic milk is produced without the use of synthetic fertilizers, pesticides, or antibiotics, aligning with the growing consumer demand for clean, sustainable, and ethically sourced dairy products. Its popularity stems from the perception of being healthier and more environmentally friendly compared to conventional milk. Further, organic milk is rich in nutrients like omega-3 fatty acids, antioxidants, and vitamins, further enhancing its appeal among health-conscious consumers. Additionally, the increased availability of organic milk in supermarkets, specialty stores, and online platforms has contributed to its dominance in the organic dairy market. As consumers continue to seek natural and organic alternatives in their diets, the organic milk segment is expected to maintain its leading position, shaping the landscape of the Organic Dairy Market.
Organic Dairy Market Share Analysis: Online market is poised to register the fastest growth rae over the forecast period to 2032
The "Online" segment is the fastest-growing within the Organic Dairy Market, driven by shifting consumer preferences towards convenience, wider product selection, and the rise of e-commerce platforms. Online channels offer consumers the flexibility to browse and purchase organic dairy products from the comfort of their homes, providing access to a diverse range of options and specialty items that may not be readily available in brick-and-mortar stores. Further, the convenience of doorstep delivery and the ability to compare prices and product reviews contribute to the growing popularity of online shopping for organic dairy products. Additionally, the COVID-19 pandemic has accelerated the adoption of online grocery shopping as consumers prioritize safety and contactless transactions. As the online retail landscape continues to evolve and consumers seek convenient and sustainable shopping options, the online segment is poised to sustain its rapid growth trajectory, reshaping the distribution landscape of the Organic Dairy Market.
Organic Dairy Market Share Analysis: Family Consumers held the dominant market share in 2024
The "Family Consumers" segment is the largest within the Organic Dairy Market, driven by its broad appeal and significant representation across demographic groups. Families, comprising parents and children, prioritize purchasing organic dairy products due to their perceived health benefits, environmental sustainability, and ethical production practices. Organic dairy products are perceived as safer and healthier alternatives, particularly for children, as they are produced without the use of synthetic pesticides, hormones, or antibiotics. Additionally, families often prioritize ethical considerations such as animal welfare and sustainable farming practices, further driving the demand for organic dairy products. Further, the convenience and versatility of organic dairy products make them well-suited for family meal planning and dietary preferences. As families increasingly prioritize health-conscious choices and sustainable living, the family consumers segment is expected to maintain its dominance in the Organic Dairy Market.
Organic Dairy Market Segmentation
By Product
Organic Milk
Yogurt
Organic Cheese
Organic Butter
Organic Cream and Creamers
Others
By Distribution Channel
Supermarkets/Hypermarkets
Specialty Stores
Online
Food Service
Institutional Buyers
By End-User
Health-Conscious Consumers
Environmental Advocates
Ethical Consumers
Family Consumers
Millennials
Seniors
Countries Analyzed
North America (US, Canada, Mexico)
Europe (Germany, UK, France, Spain, Italy, Russia, Rest of Europe)
Asia Pacific (China, India, Japan, South Korea, Australia, South East Asia, Rest of Asia)
South America (Brazil, Argentina, Rest of South America)
Middle East and Africa (Saudi Arabia, UAE, Rest of Middle East, South Africa, Egypt, Rest of Africa)
Organic Dairy Companies Profiled in the Study
Amul
Danone S.A.
FrieslandCampina
Horizon Organic
Orgain Inc
Organic Valley
Stonyfield Farm Inc
The Hain Celestial Group Inc
WhiteWave Foods Company
Yili Group
*- List Not Exhaustive
Chapter 1. TABLE OF CONTENTS
Chapter 2. Introduction to Organic Dairy Market
2.1. Market Overview
2.2. Key Statistics and Report Highlights
2.3. Scope of the Comprehensive Study
2.3.1. Market Definition
2.3.2 Countries and Regions Covered
2.3.3 Research Objective
2.3.4 Units, Currency, and Conversions
2.3.5 Industry Value Chain
2.4. Key Market Segments
2.5. Key Companies
2.6. Study Period
Chapter 3. Strategic Analysis Review
3.1. Organic Dairy Pricing Analysis and Forecast
3.2. Porter’s Five Forces
3.3. Market Ecosystem
3.4. SWOT Analysis
3.5. Regulatory Scenario
3.3. Effects of Inflation, Russia-Ukraine War, moderating economic growth, and other macroeconomic factors
Chapter 4. Competitive Landscape
4.1. Market Share Analysis
4.1.1. Global Organic Dairy Market Share by Company, 2023
4.1.2. Product Offerings of Leading Organic Dairy Companies
4.2. Market Entropy
4.2.1. New Product Launches in the Industry
4.2.2. Mergers, Acquisitions, Joint ventures, and Partnerships
4.3. Key Strategies and Best Practices
Chapter 5. Global Market Projections: Best, Reference, and Low Case Scenarios
5.1. Growth Analysis- Case Scenario Definitions
5.2. Low Growth Case Scenario Forecasts
5.3. Reference Growth Case Scenario Forecasts
5.4. High Growth Case Scenario Forecasts
Chapter 6. Market Dynamics
6.1. Organic Dairy Market Drivers
6.2. Organic Dairy Market Challenges
6.6. Organic Dairy Market Opportunities
6.4. Organic Dairy Market Trends
Chapter 7. Global Organic Dairy Market Outlook Trends
7.1. Global Organic Dairy Revenue (USD Million) and CAGR (%) by Type (2021-2032)
7.2. Global Organic Dairy Revenue (USD Million) and CAGR (%) by Application (2021-2032)
7.3. Global Organic Dairy Revenue (USD Million) and CAGR (%) by Product (2021-2032)
By Product
Organic Milk
Yogurt
Organic Cheese
Organic Butter
Organic Cream and Creamers
Others
By Distribution Channel
Supermarkets/Hypermarkets
Specialty Stores
Online
Food Service
Institutional Buyers
By End-User
Health-Conscious Consumers
Environmental Advocates
Ethical Consumers
Family Consumers
Millennials
Seniors
Chapter 8. Global Organic Dairy Regional Analysis and Outlook
8.1. Global Organic Dairy Revenue (USD Million) By Regions (2021- 2032)
8.2. North America Organic Dairy Revenue (USD Million) by Country (2021-2032)
8.2.1. United States Organic Dairy Regional Analysis and Outlook
8.2.2. Canada Organic Dairy Regional Analysis and Outlook
8.2.3. Mexico Organic Dairy Regional Analysis and Outlook
8.3. Europe Organic Dairy Revenue (USD Million), by Country (2021-2032)
8.3.1. Germany Organic Dairy Regional Analysis and Outlook
8.3.2. France Organic Dairy Regional Analysis and Outlook
8.3.3. United Kingdom Organic Dairy Regional Analysis and Outlook
8.3.4. Spain Organic Dairy Regional Analysis and Outlook
8.3.5. Italy Organic Dairy Regional Analysis and Outlook
8.3.6. Russia Organic Dairy Regional Analysis and Outlook
8.3.7. Rest of Europe Organic Dairy Regional Analysis and Outlook
8.4. Asia Pacific Organic Dairy Revenue (USD Million) by Country (2021-2032)
8.4.1. China Organic Dairy Regional Analysis and Outlook
8.4.2. Japan Organic Dairy Regional Analysis and Outlook
8.4.3. India Organic Dairy Regional Analysis and Outlook
8.4.4. South Korea Organic Dairy Regional Analysis and Outlook
8.4.5. Australia Organic Dairy Regional Analysis and Outlook
8.4.6. South East Asia Organic Dairy Regional Analysis and Outlook
8.4.7. Rest of Asia Pacific Organic Dairy Regional Analysis and Outlook
8.5. South America Organic Dairy Revenue (USD Million), by Country (2021-2032)
8.5.1. Brazil Organic Dairy Regional Analysis and Outlook
8.5.2. Argentina Organic Dairy Regional Analysis and Outlook
8.5.3. Rest of South America Organic Dairy Regional Analysis and Outlook
8.6. Middle East and Africa Organic Dairy Revenue (USD Million) by Country (2021-2032)
8.6.1. Middle East Organic Dairy Regional Analysis and Outlook
8.6.2. Africa Organic Dairy Regional Analysis and Outlook
Chapter 9. North America Organic Dairy Analysis and Outlook
9.1. North America Organic Dairy Revenue (USD Million) by Segments (2021-2032)
9.1.1. North America Organic Dairy Revenue (USD Million) by Type (2021-2032)
9.1.2. North America Organic Dairy Revenue (USD Million) by Application (2021-2032)
9.1.3. North America Organic Dairy Revenue (USD Million) by Product (2021-2032)
By Product
Organic Milk
Yogurt
Organic Cheese
Organic Butter
Organic Cream and Creamers
Others
By Distribution Channel
Supermarkets/Hypermarkets
Specialty Stores
Online
Food Service
Institutional Buyers
By End-User
Health-Conscious Consumers
Environmental Advocates
Ethical Consumers
Family Consumers
Millennials
Seniors
Chapter 10. Europe Organic Dairy Analysis and Outlook
10.1. Europe Organic Dairy Revenue (USD Million), by Segments (USD Million) (2021-2032)
10.1.1. Europe Organic Dairy Revenue (USD Million) by Type (2021-2032)
10.1.2. Europe Organic Dairy Revenue (USD Million) by Application (2021-2032)
10.1.3. Europe Organic Dairy Revenue (USD Million) by Product (2021-2032)
By Product
Organic Milk
Yogurt
Organic Cheese
Organic Butter
Organic Cream and Creamers
Others
By Distribution Channel
Supermarkets/Hypermarkets
Specialty Stores
Online
Food Service
Institutional Buyers
By End-User
Health-Conscious Consumers
Environmental Advocates
Ethical Consumers
Family Consumers
Millennials
Seniors
Chapter 11. Asia Pacific Organic Dairy Analysis and Outlook
11.1. Asia Pacific Organic Dairy Revenue (USD Million), and Revenue (USD Million) by Segments (2021-2032)
11.1.1. Asia Pacific Organic Dairy Revenue (USD Million) by Type (2021-2032)
11.1.2. Asia Pacific Organic Dairy Revenue (USD Million) by Application (2021-2032)
11.1.3. Asia Pacific Organic Dairy Revenue (USD Million) by Product (2021-2032)
By Product
Organic Milk
Yogurt
Organic Cheese
Organic Butter
Organic Cream and Creamers
Others
By Distribution Channel
Supermarkets/Hypermarkets
Specialty Stores
Online
Food Service
Institutional Buyers
By End-User
Health-Conscious Consumers
Environmental Advocates
Ethical Consumers
Family Consumers
Millennials
Seniors
Chapter 12. South America Organic Dairy Analysis and Outlook
12.1. South America Organic Dairy Revenue (USD Million), by Segments (2021-2032)
12.1.1. South America Organic Dairy Revenue (USD Million) by Type (2021-2032)
12.1.2. South America Organic Dairy Revenue (USD Million) by Application (2021-2032)
12.1.3. South America Organic Dairy Revenue (USD Million) by Product (2021-2032)
By Product
Organic Milk
Yogurt
Organic Cheese
Organic Butter
Organic Cream and Creamers
Others
By Distribution Channel
Supermarkets/Hypermarkets
Specialty Stores
Online
Food Service
Institutional Buyers
By End-User
Health-Conscious Consumers
Environmental Advocates
Ethical Consumers
Family Consumers
Millennials
Seniors
Chapter 13. Middle East and Africa Organic Dairy Analysis and Outlook
13.1. Middle East and Africa Organic Dairy Revenue (USD Million), by Segments (2021-2032)
13.1.1. Middle East and Africa Organic Dairy Revenue (USD Million) by Type (2021-2032)
13.1.2. Middle East and Africa Organic Dairy Revenue (USD Million) by Application (2021-2032)
13.1.3. Middle East and Africa Organic Dairy Revenue (USD Million) by Product (2021-2032)
By Product
Organic Milk
Yogurt
Organic Cheese
Organic Butter
Organic Cream and Creamers
Others
By Distribution Channel
Supermarkets/Hypermarkets
Specialty Stores
Online
Food Service
Institutional Buyers
By End-User
Health-Conscious Consumers
Environmental Advocates
Ethical Consumers
Family Consumers
Millennials
Seniors
Chapter 14. Organic Dairy Company Profiles
14.1 Business Overview
14.2 Product Profiles
14.3 SWOT Profiles
14.5 Recent Developments
14.6 Financial Profile
List of Companies
Amul
Danone S.A.
FrieslandCampina
Horizon Organic
Orgain Inc
Organic Valley
Stonyfield Farm Inc
The Hain Celestial Group Inc
WhiteWave Foods Company
Yili Group
15. Methodology and Data Sources
15.1 Customization Offerings
15.2 Subscription Services
15.3 Related Reports
15.4 Publisher Expertise
LIST OF TABLES
Table 1 Market Segmentation Analysis
Table 2 Global Organic Dairy Market Share of Leading Companies, 2023
Table 3 Product Offerings of Leading Companies
Table 4 Low Growth Scenario Forecasts
Table 5 Reference Case Growth Scenario
Table 6 High Growth Case Scenario
Table 7 Global Organic Dairy Revenue (USD Million) And CAGR (%) By Type (2021-2032)
Table 8 Global Organic Dairy Revenue (USD Million) And CAGR (%) By Application (2021-2032)
Table 9 Global Organic Dairy Revenue (USD Million) And CAGR (%) By Product (2021-2032)
Table 10 Global Organic Dairy Market Revenue (USD Million) By Regions (2021-2032)
Table 11 Global Organic Dairy Market Share (%) By Regions (2021-2032)
Table 12 North America Organic Dairy Revenue (USD Million) By Country (2021-2032)
Table 13 Europe Organic Dairy Revenue (USD Million) By Country (2021-2032)
Table 14 Asia Pacific Organic Dairy Revenue (USD Million) By Country (2021-2032)
Table 15 South America Organic Dairy Revenue (USD Million) By Country (2021-2032)
Table 16 Middle East and Africa Organic Dairy Revenue (USD Million) By Region (2021-2032)
Table 17 North America Organic Dairy Revenue (USD Million) By Type (2021-2032)
Table 18 North America Organic Dairy Revenue (USD Million) By Application (2021-2032)
Table 19 North America Organic Dairy Revenue (USD Million) By Product (2021-2032)
Table 20 Europe Organic Dairy Revenue (USD Million) By Type (2021-2032)
Table 21 Europe Organic Dairy Revenue (USD Million) By Application (2021-2032)
Table 22 Europe Organic Dairy Revenue (USD Million) By Product (2021-2032)
Table 23 Asia Pacific Organic Dairy Revenue (USD Million) By Type (2021-2032)
Table 24 Asia Pacific Organic Dairy Revenue (USD Million) By Application (2021-2032)
Table 25 Asia Pacific Organic Dairy Revenue (USD Million) By Product (2021-2032)
Table 26 South America Organic Dairy Revenue (USD Million) By Type (2021-2032)
Table 27 South America Organic Dairy Revenue (USD Million) By Application (2021-2032)
Table 28 South America Organic Dairy Revenue (USD Million) By Product (2021-2032)
Table 29 Middle East and Africa Organic Dairy Revenue (USD Million) By Type (2021-2032)
Table 30 Middle East and Africa Organic Dairy Revenue (USD Million) By Application (2021-2032)
Table 31 Middle East and Africa Organic Dairy Revenue (USD Million) By Product (2021-2032)
LIST OF FIGURES
Figure 1. Market Scope
Figure 2. Pricing Forecasts Per Unit, 2023- 2032
Figure 3. Porter’s Five Forces
Figure 4. Global Organic Dairy Market Revenue (USD Million) By Regions (2021-2032)
Figure 5. Global Organic Dairy Market Share (%) By Regions (2023)
Figure 6. North America Organic Dairy Revenue (USD Million) By Country (2021-2032)
Figure 7. United States Organic Dairy Revenue (USD Million) By Country (2021-2032)
Figure 8. Canada Organic Dairy Revenue (USD Million) By Country (2021-2032)
Figure 9. Mexico Organic Dairy Revenue (USD Million) By Country (2021-2032)
Figure 10. Europe Organic Dairy Revenue (USD Million) By Country (2021-2032)
Figure 11. Germany Organic Dairy Revenue (USD Million) By Country (2021-2032)
Figure 12. France Organic Dairy Revenue (USD Million) By Country (2021-2032)
Figure 13. United Kingdom Organic Dairy Revenue (USD Million) By Country (2021-2032)
Figure 14. Spain Organic Dairy Revenue (USD Million) By Country (2021-2032)
Figure 15. Italy Organic Dairy Revenue (USD Million) By Country (2021-2032)
Figure 16. Russia Organic Dairy Revenue (USD Million) By Country (2021-2032)
Figure 17. Rest of Europe Organic Dairy Revenue (USD Million) By Country (2021-2032)
Figure 11. Asia Pacific Organic Dairy Revenue (USD Million) By Country (2021-2032)
Figure 12. China Organic Dairy Revenue (USD Million) By Country (2021-2032)
Figure 13. Japan Organic Dairy Revenue (USD Million) By Country (2021-2032)
Figure 14. India Organic Dairy Revenue (USD Million) By Country (2021-2032)
Figure 15. South Korea Organic Dairy Revenue (USD Million) By Country (2021-2032)
Figure 16. Australia Organic Dairy Revenue (USD Million) By Country (2021-2032)
Figure 17. South East Asia Organic Dairy Revenue (USD Million) By Country (2021-2032)
Figure 18. South America Organic Dairy Revenue (USD Million) By Country (2021-2032)
Figure 19. Brazil Organic Dairy Revenue (USD Million) By Country (2021-2032)
Figure 20. Argentina Organic Dairy Revenue (USD Million) By Country (2021-2032)
Figure 21. Rest of Asia Pacific Organic Dairy Revenue (USD Million) By Country (2021-2032)
Figure 22. Middle East and Africa Organic Dairy Revenue (USD Million) By Region (2021-2032)
Figure 23. Saudi Arabia Organic Dairy Revenue (USD Million) By Region (2021-2032)
Figure 24. The UAE Organic Dairy Revenue (USD Million) By Region (2021-2032)
Figure 25. Rest of Middle East Organic Dairy Revenue (USD Million) By Region (2021-2032)
Figure 26. South Africa Organic Dairy Revenue (USD Million) By Region (2021-2032)
Figure 27. Africa Organic Dairy Revenue (USD Million) By Region (2021-2032)
Figure 28. North America Organic Dairy Revenue (USD Million) By Type (2021-2032)
Figure 29. North America Organic Dairy Revenue (USD Million) By Application (2021-2032)
Figure 30. North America Organic Dairy Revenue (USD Million) By Product (2021-2032)
Figure 31. Europe Organic Dairy Revenue (USD Million) By Type (2021-2032)
Figure 32. Europe Organic Dairy Revenue (USD Million) By Application (2021-2032)
Figure 33. Europe Organic Dairy Revenue (USD Million) By Product (2021-2032)
Figure 34. Asia Pacific Organic Dairy Revenue (USD Million) By Type (2021-2032)
Figure 35. Asia Pacific Organic Dairy Revenue (USD Million) By Application (2021-2032)
Figure 36. Asia Pacific Organic Dairy Revenue (USD Million) By Product (2021-2032)
Figure 37. South America Organic Dairy Revenue (USD Million) By Type (2021-2032)
Figure 38. South America Organic Dairy Revenue (USD Million) By Application (2021-2032)
Figure 39. South America Organic Dairy Revenue (USD Million) By Product (2021-2032)
Figure 40. Middle East and Africa Organic Dairy Revenue (USD Million) By Type (2021-2032)
Figure 41. Middle East and Africa Organic Dairy Revenue (USD Million) By Application (2021-2032)
Figure 42. Middle East and Africa Organic Dairy Revenue (USD Million) By Product (2021-2032)
By Product
Organic Milk
Yogurt
Organic Cheese
Organic Butter
Organic Cream and Creamers
Others
By Distribution Channel
Supermarkets/Hypermarkets
Specialty Stores
Online
Food Service
Institutional Buyers
By End-User
Health-Conscious Consumers
Environmental Advocates
Ethical Consumers
Family Consumers
Millennials
Seniors
Countries Analyzed
North America (US, Canada, Mexico)
Europe (Germany, UK, France, Spain, Italy, Russia, Rest of Europe)
Asia Pacific (China, India, Japan, South Korea, Australia, South East Asia, Rest of Asia)
South America (Brazil, Argentina, Rest of South America)
Middle East and Africa (Saudi Arabia, UAE, Rest of Middle East, South Africa, Egypt, Rest of Africa)
