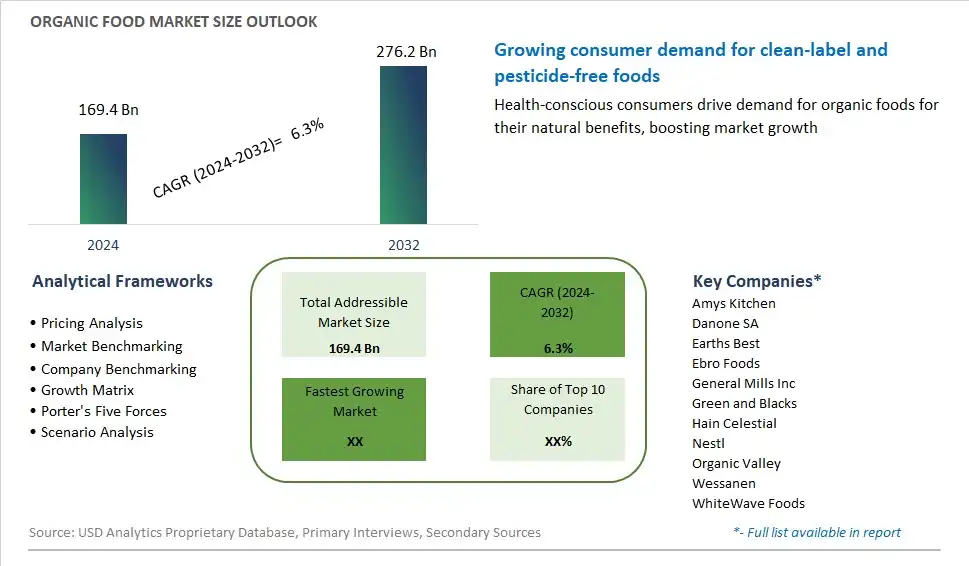
Global Organic Food Market Size is valued at $169.4 Billion in 2024 and is forecast to register a growth rate (CAGR) of 6.3% to reach $276.2 Billion by 2032.
The global Organic Food Market Comprehensive Study analyzes and forecasts the market size across 6 regions and 24 countries for diverse segments -By Type (Fresh Produce, Dairy Products, Coffee, Tea, Meat, Poultry, Processed Organic Foods, Others), By Application (Supermarkets/Hypermarkets, Grocery Stores, E-Commerce, Convenience Stores, Others)
An Introduction to Organic Food Market
In 2024, the organic food market is thriving as consumers increasingly prioritize health, sustainability, and ethical consumption practices. Organic food, characterized by its production without synthetic pesticides, fertilizers, or genetically modified organisms (GMOs), appeals to consumers seeking wholesome, environmentally friendly alternatives to conventional products. From fruits and vegetables to grains, meats, and dairy, organic offerings span a wide range of categories, catering to diverse dietary preferences and lifestyle choices. As awareness of the environmental and health benefits of organic farming grows, so does demand for organic food, driving expansion in both retail and foodservice sectors. Moreover, advancements in organic farming techniques, distribution networks, and certification standards are enhancing the availability and accessibility of organic products, making organic food a mainstream choice for conscientious consumers worldwide. As the organic food market continues to evolve, it remains at the forefront of sustainable agriculture and consumer-driven innovation, shaping the future of the global food industry.
Organic Food Competitive Landscape
The market report analyses the leading companies in the industry including Amys Kitchen, Danone SA, Earths Best, Ebro Foods, General Mills Inc, Green and Blacks, Hain Celestial, Nestl, Organic Valley, Wessanen, WhiteWave Foods, and Others.
Organic Food Market Dynamics
Organic Food Market Trend: Increasing Consumer Demand for Organic Products
The market for organic food is experiencing a prominent trend driven by the increasing consumer demand for organic products. Consumers are becoming more health-conscious and environmentally aware, leading to a growing preference for organic food over conventionally produced alternatives. Organic food is perceived as healthier, safer, and more sustainable, as it is grown without the use of synthetic pesticides, fertilizers, or genetically modified organisms (GMOs). This trend is fueled by concerns about the potential health risks associated with chemical residues in conventional food, as well as the environmental impact of industrial agriculture practices. As a result, the market for organic food is expanding rapidly, with increased availability and variety of organic products across various food categories.
Market Driver: Health and Environmental Benefits
The market for organic food is primarily driven by the perceived health and environmental benefits of organic farming practices. Organic food is grown using sustainable farming methods that prioritize soil health, biodiversity, and ecological balance. By avoiding synthetic chemicals and GMOs, organic farming reduces the risk of pesticide residues in food and minimizes harm to beneficial insects, wildlife, and ecosystems. Additionally, organic farming practices such as crop rotation, composting, and conservation tillage contribute to soil fertility, water conservation, and carbon sequestration, making organic agriculture more resilient to climate change. This driver is reinforced by growing consumer awareness of the connections between food, health, and the environment, driving demand for organic food as a means to support personal and planetary well-being.
Market Opportunity: Expansion into New Product Categories and Markets
The market for organic food presents a significant opportunity for companies to expand into new product categories and markets to meet the diverse needs and preferences of consumers. While organic fruits, vegetables, and dairy products are well-established in the market, there is potential for innovation and growth in other food segments. Companies can explore the development of organic snacks, convenience foods, frozen meals, and baby food, as well as specialty products such as organic gluten-free, vegan, or ethnic foods. Additionally, there are opportunities to target specific consumer demographics and market segments, such as organic food for children, seniors, or athletes, as well as niche markets like organic pet food and organic ingredients for foodservice and hospitality industries. By diversifying their product offerings and expanding into new markets, companies can capitalize on the growing demand for organic food and position themselves for long-term success in the organic food industry.
Organic Food Market Share Analysis: Fresh Produce held the dominant market share in 2024
The "Fresh Produce" segment is the largest within the Organic Food Market, driven by consumer preferences for natural, nutrient-rich foods and the growing demand for organic alternatives to conventionally grown fruits and vegetables. Fresh produce holds a prominent position in the organic food market due to its perceived health benefits, including higher nutrient content and reduced exposure to synthetic pesticides and fertilizers. Additionally, consumers increasingly prioritize environmental sustainability and ethical farming practices, further propelling the demand for organic fruits and vegetables. The availability of a wide variety of organic produce, ranging from leafy greens to seasonal fruits, in supermarkets, farmers' markets, and online platforms also contributes to the segment's dominance. Further, the versatility of fresh produce in culinary applications and its role in promoting overall health and wellness make it a staple in households worldwide. As consumer awareness of the benefits of organic foods continues to grow, the fresh produce segment is expected to maintain its leading position in the Organic Food Market.
Organic Food Market Share Analysis: E-Commerce market is poised to register the fastest growth rae over the forecast period to 2032
The "E-Commerce" segment is the fastest-growing within the Organic Food Market, propelled by the increasing consumer preference for online shopping, convenience, and the wider availability of organic products on digital platforms. E-commerce channels provide consumers with a convenient and accessible way to browse, compare, and purchase organic food products from the comfort of their homes. Further, the COVID-19 pandemic has accelerated the adoption of online grocery shopping as consumers prioritize safety and contactless transactions. Additionally, e-commerce platforms offer a diverse selection of organic products, including specialty items and niche brands, that may not be readily available in traditional brick-and-mortar stores. The ability to access a broader range of organic foods, coupled with features such as doorstep delivery and subscription services, further drives the growth of the e-commerce segment. As consumers continue to seek convenient and sustainable shopping options, the e-commerce segment is poised to sustain its rapid growth trajectory, reshaping the distribution landscape of the Organic Food Market.
Organic Food Market Segmentation
By Type
Fresh Produce
Dairy Products
Coffee
Tea
Meat
Poultry
Processed Organic Foods
Others
By Application
Supermarkets/Hypermarkets
Grocery Stores
E-Commerce
Convenience Stores
Others
Countries Analyzed
North America (US, Canada, Mexico)
Europe (Germany, UK, France, Spain, Italy, Russia, Rest of Europe)
Asia Pacific (China, India, Japan, South Korea, Australia, South East Asia, Rest of Asia)
South America (Brazil, Argentina, Rest of South America)
Middle East and Africa (Saudi Arabia, UAE, Rest of Middle East, South Africa, Egypt, Rest of Africa)
Organic Food Companies Profiled in the Study
Amys Kitchen
Danone SA
Earths Best
Ebro Foods
General Mills Inc
Green and Blacks
Hain Celestial
Nestl
Organic Valley
Wessanen
WhiteWave Foods
*- List Not Exhaustive
Chapter 1. TABLE OF CONTENTS
Chapter 2. Introduction to Organic Food Market
2.1. Market Overview
2.2. Key Statistics and Report Highlights
2.3. Scope of the Comprehensive Study
2.3.1. Market Definition
2.3.2 Countries and Regions Covered
2.3.3 Research Objective
2.3.4 Units, Currency, and Conversions
2.3.5 Industry Value Chain
2.4. Key Market Segments
2.5. Key Companies
2.6. Study Period
Chapter 3. Strategic Analysis Review
3.1. Organic Food Pricing Analysis and Forecast
3.2. Porter’s Five Forces
3.3. Market Ecosystem
3.4. SWOT Analysis
3.5. Regulatory Scenario
3.3. Effects of Inflation, Russia-Ukraine War, moderating economic growth, and other macroeconomic factors
Chapter 4. Competitive Landscape
4.1. Market Share Analysis
4.1.1. Global Organic Food Market Share by Company, 2023
4.1.2. Product Offerings of Leading Organic Food Companies
4.2. Market Entropy
4.2.1. New Product Launches in the Industry
4.2.2. Mergers, Acquisitions, Joint ventures, and Partnerships
4.3. Key Strategies and Best Practices
Chapter 5. Global Market Projections: Best, Reference, and Low Case Scenarios
5.1. Growth Analysis- Case Scenario Definitions
5.2. Low Growth Case Scenario Forecasts
5.3. Reference Growth Case Scenario Forecasts
5.4. High Growth Case Scenario Forecasts
Chapter 6. Market Dynamics
6.1. Organic Food Market Drivers
6.2. Organic Food Market Challenges
6.6. Organic Food Market Opportunities
6.4. Organic Food Market Trends
Chapter 7. Global Organic Food Market Outlook Trends
7.1. Global Organic Food Revenue (USD Million) and CAGR (%) by Type (2021-2032)
7.2. Global Organic Food Revenue (USD Million) and CAGR (%) by Application (2021-2032)
7.3. Global Organic Food Revenue (USD Million) and CAGR (%) by Product (2021-2032)
By Type
Fresh Produce
Dairy Products
Coffee
Tea
Meat
Poultry
Processed Organic Foods
Others
By Application
Supermarkets/Hypermarkets
Grocery Stores
E-Commerce
Convenience Stores
Others
Chapter 8. Global Organic Food Regional Analysis and Outlook
8.1. Global Organic Food Revenue (USD Million) By Regions (2021- 2032)
8.2. North America Organic Food Revenue (USD Million) by Country (2021-2032)
8.2.1. United States Organic Food Regional Analysis and Outlook
8.2.2. Canada Organic Food Regional Analysis and Outlook
8.2.3. Mexico Organic Food Regional Analysis and Outlook
8.3. Europe Organic Food Revenue (USD Million), by Country (2021-2032)
8.3.1. Germany Organic Food Regional Analysis and Outlook
8.3.2. France Organic Food Regional Analysis and Outlook
8.3.3. United Kingdom Organic Food Regional Analysis and Outlook
8.3.4. Spain Organic Food Regional Analysis and Outlook
8.3.5. Italy Organic Food Regional Analysis and Outlook
8.3.6. Russia Organic Food Regional Analysis and Outlook
8.3.7. Rest of Europe Organic Food Regional Analysis and Outlook
8.4. Asia Pacific Organic Food Revenue (USD Million) by Country (2021-2032)
8.4.1. China Organic Food Regional Analysis and Outlook
8.4.2. Japan Organic Food Regional Analysis and Outlook
8.4.3. India Organic Food Regional Analysis and Outlook
8.4.4. South Korea Organic Food Regional Analysis and Outlook
8.4.5. Australia Organic Food Regional Analysis and Outlook
8.4.6. South East Asia Organic Food Regional Analysis and Outlook
8.4.7. Rest of Asia Pacific Organic Food Regional Analysis and Outlook
8.5. South America Organic Food Revenue (USD Million), by Country (2021-2032)
8.5.1. Brazil Organic Food Regional Analysis and Outlook
8.5.2. Argentina Organic Food Regional Analysis and Outlook
8.5.3. Rest of South America Organic Food Regional Analysis and Outlook
8.6. Middle East and Africa Organic Food Revenue (USD Million) by Country (2021-2032)
8.6.1. Middle East Organic Food Regional Analysis and Outlook
8.6.2. Africa Organic Food Regional Analysis and Outlook
Chapter 9. North America Organic Food Analysis and Outlook
9.1. North America Organic Food Revenue (USD Million) by Segments (2021-2032)
9.1.1. North America Organic Food Revenue (USD Million) by Type (2021-2032)
9.1.2. North America Organic Food Revenue (USD Million) by Application (2021-2032)
9.1.3. North America Organic Food Revenue (USD Million) by Product (2021-2032)
By Type
Fresh Produce
Dairy Products
Coffee
Tea
Meat
Poultry
Processed Organic Foods
Others
By Application
Supermarkets/Hypermarkets
Grocery Stores
E-Commerce
Convenience Stores
Others
Chapter 10. Europe Organic Food Analysis and Outlook
10.1. Europe Organic Food Revenue (USD Million), by Segments (USD Million) (2021-2032)
10.1.1. Europe Organic Food Revenue (USD Million) by Type (2021-2032)
10.1.2. Europe Organic Food Revenue (USD Million) by Application (2021-2032)
10.1.3. Europe Organic Food Revenue (USD Million) by Product (2021-2032)
By Type
Fresh Produce
Dairy Products
Coffee
Tea
Meat
Poultry
Processed Organic Foods
Others
By Application
Supermarkets/Hypermarkets
Grocery Stores
E-Commerce
Convenience Stores
Others
Chapter 11. Asia Pacific Organic Food Analysis and Outlook
11.1. Asia Pacific Organic Food Revenue (USD Million), and Revenue (USD Million) by Segments (2021-2032)
11.1.1. Asia Pacific Organic Food Revenue (USD Million) by Type (2021-2032)
11.1.2. Asia Pacific Organic Food Revenue (USD Million) by Application (2021-2032)
11.1.3. Asia Pacific Organic Food Revenue (USD Million) by Product (2021-2032)
By Type
Fresh Produce
Dairy Products
Coffee
Tea
Meat
Poultry
Processed Organic Foods
Others
By Application
Supermarkets/Hypermarkets
Grocery Stores
E-Commerce
Convenience Stores
Others
Chapter 12. South America Organic Food Analysis and Outlook
12.1. South America Organic Food Revenue (USD Million), by Segments (2021-2032)
12.1.1. South America Organic Food Revenue (USD Million) by Type (2021-2032)
12.1.2. South America Organic Food Revenue (USD Million) by Application (2021-2032)
12.1.3. South America Organic Food Revenue (USD Million) by Product (2021-2032)
By Type
Fresh Produce
Dairy Products
Coffee
Tea
Meat
Poultry
Processed Organic Foods
Others
By Application
Supermarkets/Hypermarkets
Grocery Stores
E-Commerce
Convenience Stores
Others
Chapter 13. Middle East and Africa Organic Food Analysis and Outlook
13.1. Middle East and Africa Organic Food Revenue (USD Million), by Segments (2021-2032)
13.1.1. Middle East and Africa Organic Food Revenue (USD Million) by Type (2021-2032)
13.1.2. Middle East and Africa Organic Food Revenue (USD Million) by Application (2021-2032)
13.1.3. Middle East and Africa Organic Food Revenue (USD Million) by Product (2021-2032)
By Type
Fresh Produce
Dairy Products
Coffee
Tea
Meat
Poultry
Processed Organic Foods
Others
By Application
Supermarkets/Hypermarkets
Grocery Stores
E-Commerce
Convenience Stores
Others
Chapter 14. Organic Food Company Profiles
14.1 Business Overview
14.2 Product Profiles
14.3 SWOT Profiles
14.5 Recent Developments
14.6 Financial Profile
List of Companies
Amys Kitchen
Danone SA
Earths Best
Ebro Foods
General Mills Inc
Green and Blacks
Hain Celestial
Nestl
Organic Valley
Wessanen
WhiteWave Foods
15. Methodology and Data Sources
15.1 Customization Offerings
15.2 Subscription Services
15.3 Related Reports
15.4 Publisher Expertise
LIST OF TABLES
Table 1 Market Segmentation Analysis
Table 2 Global Organic Food Market Share of Leading Companies, 2023
Table 3 Product Offerings of Leading Companies
Table 4 Low Growth Scenario Forecasts
Table 5 Reference Case Growth Scenario
Table 6 High Growth Case Scenario
Table 7 Global Organic Food Revenue (USD Million) And CAGR (%) By Type (2021-2032)
Table 8 Global Organic Food Revenue (USD Million) And CAGR (%) By Application (2021-2032)
Table 9 Global Organic Food Revenue (USD Million) And CAGR (%) By Product (2021-2032)
Table 10 Global Organic Food Market Revenue (USD Million) By Regions (2021-2032)
Table 11 Global Organic Food Market Share (%) By Regions (2021-2032)
Table 12 North America Organic Food Revenue (USD Million) By Country (2021-2032)
Table 13 Europe Organic Food Revenue (USD Million) By Country (2021-2032)
Table 14 Asia Pacific Organic Food Revenue (USD Million) By Country (2021-2032)
Table 15 South America Organic Food Revenue (USD Million) By Country (2021-2032)
Table 16 Middle East and Africa Organic Food Revenue (USD Million) By Region (2021-2032)
Table 17 North America Organic Food Revenue (USD Million) By Type (2021-2032)
Table 18 North America Organic Food Revenue (USD Million) By Application (2021-2032)
Table 19 North America Organic Food Revenue (USD Million) By Product (2021-2032)
Table 20 Europe Organic Food Revenue (USD Million) By Type (2021-2032)
Table 21 Europe Organic Food Revenue (USD Million) By Application (2021-2032)
Table 22 Europe Organic Food Revenue (USD Million) By Product (2021-2032)
Table 23 Asia Pacific Organic Food Revenue (USD Million) By Type (2021-2032)
Table 24 Asia Pacific Organic Food Revenue (USD Million) By Application (2021-2032)
Table 25 Asia Pacific Organic Food Revenue (USD Million) By Product (2021-2032)
Table 26 South America Organic Food Revenue (USD Million) By Type (2021-2032)
Table 27 South America Organic Food Revenue (USD Million) By Application (2021-2032)
Table 28 South America Organic Food Revenue (USD Million) By Product (2021-2032)
Table 29 Middle East and Africa Organic Food Revenue (USD Million) By Type (2021-2032)
Table 30 Middle East and Africa Organic Food Revenue (USD Million) By Application (2021-2032)
Table 31 Middle East and Africa Organic Food Revenue (USD Million) By Product (2021-2032)
LIST OF FIGURES
Figure 1. Market Scope
Figure 2. Pricing Forecasts Per Unit, 2023- 2032
Figure 3. Porter’s Five Forces
Figure 4. Global Organic Food Market Revenue (USD Million) By Regions (2021-2032)
Figure 5. Global Organic Food Market Share (%) By Regions (2023)
Figure 6. North America Organic Food Revenue (USD Million) By Country (2021-2032)
Figure 7. United States Organic Food Revenue (USD Million) By Country (2021-2032)
Figure 8. Canada Organic Food Revenue (USD Million) By Country (2021-2032)
Figure 9. Mexico Organic Food Revenue (USD Million) By Country (2021-2032)
Figure 10. Europe Organic Food Revenue (USD Million) By Country (2021-2032)
Figure 11. Germany Organic Food Revenue (USD Million) By Country (2021-2032)
Figure 12. France Organic Food Revenue (USD Million) By Country (2021-2032)
Figure 13. United Kingdom Organic Food Revenue (USD Million) By Country (2021-2032)
Figure 14. Spain Organic Food Revenue (USD Million) By Country (2021-2032)
Figure 15. Italy Organic Food Revenue (USD Million) By Country (2021-2032)
Figure 16. Russia Organic Food Revenue (USD Million) By Country (2021-2032)
Figure 17. Rest of Europe Organic Food Revenue (USD Million) By Country (2021-2032)
Figure 11. Asia Pacific Organic Food Revenue (USD Million) By Country (2021-2032)
Figure 12. China Organic Food Revenue (USD Million) By Country (2021-2032)
Figure 13. Japan Organic Food Revenue (USD Million) By Country (2021-2032)
Figure 14. India Organic Food Revenue (USD Million) By Country (2021-2032)
Figure 15. South Korea Organic Food Revenue (USD Million) By Country (2021-2032)
Figure 16. Australia Organic Food Revenue (USD Million) By Country (2021-2032)
Figure 17. South East Asia Organic Food Revenue (USD Million) By Country (2021-2032)
Figure 18. South America Organic Food Revenue (USD Million) By Country (2021-2032)
Figure 19. Brazil Organic Food Revenue (USD Million) By Country (2021-2032)
Figure 20. Argentina Organic Food Revenue (USD Million) By Country (2021-2032)
Figure 21. Rest of Asia Pacific Organic Food Revenue (USD Million) By Country (2021-2032)
Figure 22. Middle East and Africa Organic Food Revenue (USD Million) By Region (2021-2032)
Figure 23. Saudi Arabia Organic Food Revenue (USD Million) By Region (2021-2032)
Figure 24. The UAE Organic Food Revenue (USD Million) By Region (2021-2032)
Figure 25. Rest of Middle East Organic Food Revenue (USD Million) By Region (2021-2032)
Figure 26. South Africa Organic Food Revenue (USD Million) By Region (2021-2032)
Figure 27. Africa Organic Food Revenue (USD Million) By Region (2021-2032)
Figure 28. North America Organic Food Revenue (USD Million) By Type (2021-2032)
Figure 29. North America Organic Food Revenue (USD Million) By Application (2021-2032)
Figure 30. North America Organic Food Revenue (USD Million) By Product (2021-2032)
Figure 31. Europe Organic Food Revenue (USD Million) By Type (2021-2032)
Figure 32. Europe Organic Food Revenue (USD Million) By Application (2021-2032)
Figure 33. Europe Organic Food Revenue (USD Million) By Product (2021-2032)
Figure 34. Asia Pacific Organic Food Revenue (USD Million) By Type (2021-2032)
Figure 35. Asia Pacific Organic Food Revenue (USD Million) By Application (2021-2032)
Figure 36. Asia Pacific Organic Food Revenue (USD Million) By Product (2021-2032)
Figure 37. South America Organic Food Revenue (USD Million) By Type (2021-2032)
Figure 38. South America Organic Food Revenue (USD Million) By Application (2021-2032)
Figure 39. South America Organic Food Revenue (USD Million) By Product (2021-2032)
Figure 40. Middle East and Africa Organic Food Revenue (USD Million) By Type (2021-2032)
Figure 41. Middle East and Africa Organic Food Revenue (USD Million) By Application (2021-2032)
Figure 42. Middle East and Africa Organic Food Revenue (USD Million) By Product (2021-2032)
By Type
Fresh Produce
Dairy Products
Coffee
Tea
Meat
Poultry
Processed Organic Foods
Others
By Application
Supermarkets/Hypermarkets
Grocery Stores
E-Commerce
Convenience Stores
Others
Countries Analyzed
North America (US, Canada, Mexico)
Europe (Germany, UK, France, Spain, Italy, Russia, Rest of Europe)
Asia Pacific (China, India, Japan, South Korea, Australia, South East Asia, Rest of Asia)
South America (Brazil, Argentina, Rest of South America)
Middle East and Africa (Saudi Arabia, UAE, Rest of Middle East, South Africa, Egypt, Rest of Africa)
