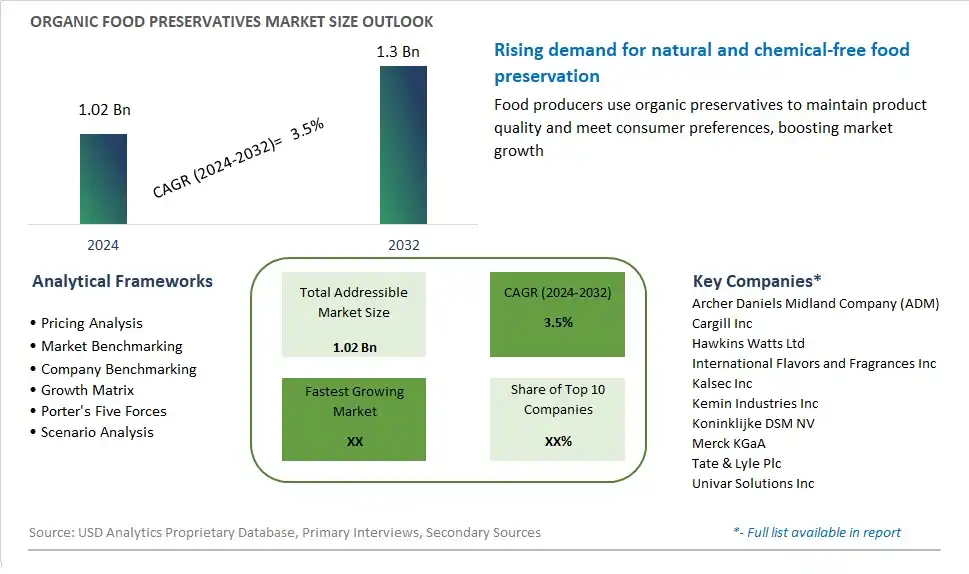
Global Organic Food Preservatives Market Size is valued at $1.02 Billion in 2024 and is forecast to register a growth rate (CAGR) of 3.5% to reach $1.3 Billion by 2032.
The global Organic Food Preservatives Market Comprehensive Study analyzes and forecasts the market size across 6 regions and 24 countries for diverse segments -By Application (Bakery And Confectionary, Beverages, Dairy, Sweet and Savory Snacks, Others), By Type (Dry, Liquid)
An Introduction to Organic Food Preservatives Market
The market for organic food preservatives has witnessed significant growth as consumers seek clean-label products with minimal additives and preservatives. Food preservation plays a crucial role in maintaining the quality, safety, and shelf life of perishable goods. However, traditional preservatives often contain synthetic chemicals that may raise concerns about health and environmental impacts. Organic food preservatives offer a natural alternative, derived from plant-based sources such as herbs, spices, and botanical extracts. These organic preservatives help extend the shelf life of food products while meeting consumer demand for clean, transparent ingredients. From antioxidants like vitamin E to antimicrobial agents like rosemary extract, organic food preservatives come in various forms and serve multiple functions in food manufacturing. As consumer preferences shift towards healthier and more sustainable food choices, the demand for organic food preservatives is expected to rise, driving innovation and reformulation within the food industry.
Organic Food Preservatives Competitive Landscape
The market report analyses the leading companies in the industry including Archer Daniels Midland Company (ADM), Cargill Inc, Hawkins Watts Ltd, International Flavors and Fragrances Inc, Kalsec Inc, Kemin Industries Inc, Koninklijke DSM NV, Merck KGaA, Tate & Lyle Plc, Univar Solutions Inc, and Others.
Organic Food Preservatives Market Dynamics
Organic Food Preservatives Market Trend: Growing Demand for Clean Label Products
A significant trend in the organic food preservatives market is the increasing demand for clean label products among consumers. With growing health consciousness and awareness of food ingredients, there's a shift towards natural and organic alternatives that are perceived as safer and healthier. This trend is driven by consumers' desire for transparency in food labeling and their preference for products free from synthetic additives, preservatives, and artificial ingredients. As a result, there's a surge in interest in organic food preservatives derived from natural sources such as plant extracts, herbs, and spices, offering manufacturers clean label solutions for extending shelf life and maintaining product quality without compromising on food safety or nutritional value. Moreover, the clean label movement is reshaping consumer perceptions of food preservation, driving demand for organic preservatives that align with clean eating principles and sustainable lifestyles.
Market Driver: Consumer Preference for Healthier and Safer Food Options
A key driver for the organic food preservatives market is the consumer preference for healthier and safer food options. As consumers become more informed about the potential health risks associated with synthetic preservatives and chemical additives commonly used in processed foods, there's a growing demand for natural and organic alternatives. This driver is reinforced by concerns about food safety, foodborne illnesses, and the long-term health effects of consuming artificial ingredients. Additionally, the clean eating trend and the rise of organic and clean label diets further fuel consumer interest in organic food preservatives that are perceived as more wholesome, sustainable, and environmentally friendly. By offering products with organic preservatives, food manufacturers can meet consumer demand for safer, cleaner, and more natural food choices while addressing concerns about chemical exposure and promoting healthier eating habits.
Market Opportunity: Development of Innovative Organic Preservation Technologies
An opportunity for the organic food preservatives market lies in the development of innovative preservation technologies and solutions that meet the growing demand for clean label and organic food products. Brands and manufacturers can capitalize on this opportunity by investing in research and development to explore novel methods of organic preservation, such as natural antimicrobials, antioxidant compounds, and fermentation techniques. Moreover, there's potential to leverage advances in food science and biotechnology to create organic preservatives with improved efficacy, stability, and sensory properties. Additionally, brands can collaborate with organic farmers, food producers, and research institutions to source high-quality organic ingredients and develop customized preservation solutions tailored to specific food applications and consumer preferences. By embracing innovation and offering organic food preservatives that meet the needs of clean label consumers, brands can differentiate themselves in the market and capture market share in the rapidly growing organic food industry.
Organic Food Preservatives Market Share Analysis: Bakery and Confectionary held the dominant market share in 2024
In the Organic Food Preservatives Market segmented by application, the bakery and confectionary sector is the largest segment, driven by several pivotal factors. Bakery and confectionary products often have shorter shelf lives due to their high moisture content and susceptibility to microbial spoilage. Organic food preservatives play a crucial role in extending the shelf life of these perishable goods while maintaining their organic integrity. Consumers increasingly seek organic alternatives to conventional preservatives, driven by concerns about health and environmental sustainability. Organic food preservatives, such as plant-based extracts and natural antioxidants, are widely used in bakery and confectionary products to prevent microbial growth, oxidation, and spoilage without compromising on taste or quality. Further, the growing demand for organic baked goods and confectionary items, fueled by shifting consumer preferences towards healthier and clean-label options, further drives the dominance of the bakery and confectionary segment in the organic food preservatives market. Additionally, the versatility of organic food preservatives allows for their application in a wide range of bakery and confectionary products, including bread, cakes, cookies, chocolates, and pastries, further solidifying their position as the largest segment in the market.
Organic Food Preservatives Market Share Analysis: Liquid Organic Food Preservatives market is poised to register the fastest growth rae over the forecast period to 2032
In the Organic Food Preservatives Market segmented by type, liquid organic food preservatives emerge as the fastest-growing segment, propelled by several compelling factors. Liquid preservatives offer unique advantages over their dry counterparts, including ease of application, uniform distribution, and versatility in food formulations. With consumers increasingly seeking organic alternatives to conventional preservatives, liquid organic options have gained traction due to their ability to meet stringent clean-label requirements and maintain the organic integrity of food products. Further, liquid preservatives are particularly suitable for liquid and semi-liquid food products such as beverages, sauces, dressings, and marinades, where they can be easily incorporated without altering texture or taste. Additionally, liquid organic food preservatives often consist of natural extracts and plant-based ingredients, aligning with consumer preferences for clean, sustainable, and environmentally friendly solutions. Furthermore, the growing demand for organic beverages and prepared foods, coupled with advancements in liquid preservative formulations and processing technologies, further drives the rapid growth of the liquid segment in the organic food preservatives market. As consumer awareness of the health and environmental benefits of organic products continues to rise, liquid organic food preservatives are poised to maintain their momentum and reshape the landscape of food preservation.
Organic Food Preservatives Market Segmentation
By Application
Bakery And Confectionary
Beverages
Dairy, Sweet and Savory Snacks
Others
By Type
Dry
Liquid
Countries Analyzed
North America (US, Canada, Mexico)
Europe (Germany, UK, France, Spain, Italy, Russia, Rest of Europe)
Asia Pacific (China, India, Japan, South Korea, Australia, South East Asia, Rest of Asia)
South America (Brazil, Argentina, Rest of South America)
Middle East and Africa (Saudi Arabia, UAE, Rest of Middle East, South Africa, Egypt, Rest of Africa)
Organic Food Preservatives Companies Profiled in the Study
Archer Daniels Midland Company (ADM)
Cargill Inc
Hawkins Watts Ltd
International Flavors and Fragrances Inc
Kalsec Inc
Kemin Industries Inc
Koninklijke DSM NV
Merck KGaA
Tate & Lyle Plc
Univar Solutions Inc
*- List Not Exhaustive
Chapter 1. TABLE OF CONTENTS
Chapter 2. Introduction to Organic Food Preservatives Market
2.1. Market Overview
2.2. Key Statistics and Report Highlights
2.3. Scope of the Comprehensive Study
2.3.1. Market Definition
2.3.2 Countries and Regions Covered
2.3.3 Research Objective
2.3.4 Units, Currency, and Conversions
2.3.5 Industry Value Chain
2.4. Key Market Segments
2.5. Key Companies
2.6. Study Period
Chapter 3. Strategic Analysis Review
3.1. Organic Food Preservatives Pricing Analysis and Forecast
3.2. Porter’s Five Forces
3.3. Market Ecosystem
3.4. SWOT Analysis
3.5. Regulatory Scenario
3.3. Effects of Inflation, Russia-Ukraine War, moderating economic growth, and other macroeconomic factors
Chapter 4. Competitive Landscape
4.1. Market Share Analysis
4.1.1. Global Organic Food Preservatives Market Share by Company, 2023
4.1.2. Product Offerings of Leading Organic Food Preservatives Companies
4.2. Market Entropy
4.2.1. New Product Launches in the Industry
4.2.2. Mergers, Acquisitions, Joint ventures, and Partnerships
4.3. Key Strategies and Best Practices
Chapter 5. Global Market Projections: Best, Reference, and Low Case Scenarios
5.1. Growth Analysis- Case Scenario Definitions
5.2. Low Growth Case Scenario Forecasts
5.3. Reference Growth Case Scenario Forecasts
5.4. High Growth Case Scenario Forecasts
Chapter 6. Market Dynamics
6.1. Organic Food Preservatives Market Drivers
6.2. Organic Food Preservatives Market Challenges
6.6. Organic Food Preservatives Market Opportunities
6.4. Organic Food Preservatives Market Trends
Chapter 7. Global Organic Food Preservatives Market Outlook Trends
7.1. Global Organic Food Preservatives Revenue (USD Million) and CAGR (%) by Type (2021-2032)
7.2. Global Organic Food Preservatives Revenue (USD Million) and CAGR (%) by Application (2021-2032)
7.3. Global Organic Food Preservatives Revenue (USD Million) and CAGR (%) by Product (2021-2032)
By Application
Bakery And Confectionary
Beverages
Dairy, Sweet and Savory Snacks
Others
By Type
Dry
Liquid
Chapter 8. Global Organic Food Preservatives Regional Analysis and Outlook
8.1. Global Organic Food Preservatives Revenue (USD Million) By Regions (2021- 2032)
8.2. North America Organic Food Preservatives Revenue (USD Million) by Country (2021-2032)
8.2.1. United States Organic Food Preservatives Regional Analysis and Outlook
8.2.2. Canada Organic Food Preservatives Regional Analysis and Outlook
8.2.3. Mexico Organic Food Preservatives Regional Analysis and Outlook
8.3. Europe Organic Food Preservatives Revenue (USD Million), by Country (2021-2032)
8.3.1. Germany Organic Food Preservatives Regional Analysis and Outlook
8.3.2. France Organic Food Preservatives Regional Analysis and Outlook
8.3.3. United Kingdom Organic Food Preservatives Regional Analysis and Outlook
8.3.4. Spain Organic Food Preservatives Regional Analysis and Outlook
8.3.5. Italy Organic Food Preservatives Regional Analysis and Outlook
8.3.6. Russia Organic Food Preservatives Regional Analysis and Outlook
8.3.7. Rest of Europe Organic Food Preservatives Regional Analysis and Outlook
8.4. Asia Pacific Organic Food Preservatives Revenue (USD Million) by Country (2021-2032)
8.4.1. China Organic Food Preservatives Regional Analysis and Outlook
8.4.2. Japan Organic Food Preservatives Regional Analysis and Outlook
8.4.3. India Organic Food Preservatives Regional Analysis and Outlook
8.4.4. South Korea Organic Food Preservatives Regional Analysis and Outlook
8.4.5. Australia Organic Food Preservatives Regional Analysis and Outlook
8.4.6. South East Asia Organic Food Preservatives Regional Analysis and Outlook
8.4.7. Rest of Asia Pacific Organic Food Preservatives Regional Analysis and Outlook
8.5. South America Organic Food Preservatives Revenue (USD Million), by Country (2021-2032)
8.5.1. Brazil Organic Food Preservatives Regional Analysis and Outlook
8.5.2. Argentina Organic Food Preservatives Regional Analysis and Outlook
8.5.3. Rest of South America Organic Food Preservatives Regional Analysis and Outlook
8.6. Middle East and Africa Organic Food Preservatives Revenue (USD Million) by Country (2021-2032)
8.6.1. Middle East Organic Food Preservatives Regional Analysis and Outlook
8.6.2. Africa Organic Food Preservatives Regional Analysis and Outlook
Chapter 9. North America Organic Food Preservatives Analysis and Outlook
9.1. North America Organic Food Preservatives Revenue (USD Million) by Segments (2021-2032)
9.1.1. North America Organic Food Preservatives Revenue (USD Million) by Type (2021-2032)
9.1.2. North America Organic Food Preservatives Revenue (USD Million) by Application (2021-2032)
9.1.3. North America Organic Food Preservatives Revenue (USD Million) by Product (2021-2032)
By Application
Bakery And Confectionary
Beverages
Dairy, Sweet and Savory Snacks
Others
By Type
Dry
Liquid
Chapter 10. Europe Organic Food Preservatives Analysis and Outlook
10.1. Europe Organic Food Preservatives Revenue (USD Million), by Segments (USD Million) (2021-2032)
10.1.1. Europe Organic Food Preservatives Revenue (USD Million) by Type (2021-2032)
10.1.2. Europe Organic Food Preservatives Revenue (USD Million) by Application (2021-2032)
10.1.3. Europe Organic Food Preservatives Revenue (USD Million) by Product (2021-2032)
By Application
Bakery And Confectionary
Beverages
Dairy, Sweet and Savory Snacks
Others
By Type
Dry
Liquid
Chapter 11. Asia Pacific Organic Food Preservatives Analysis and Outlook
11.1. Asia Pacific Organic Food Preservatives Revenue (USD Million), and Revenue (USD Million) by Segments (2021-2032)
11.1.1. Asia Pacific Organic Food Preservatives Revenue (USD Million) by Type (2021-2032)
11.1.2. Asia Pacific Organic Food Preservatives Revenue (USD Million) by Application (2021-2032)
11.1.3. Asia Pacific Organic Food Preservatives Revenue (USD Million) by Product (2021-2032)
By Application
Bakery And Confectionary
Beverages
Dairy, Sweet and Savory Snacks
Others
By Type
Dry
Liquid
Chapter 12. South America Organic Food Preservatives Analysis and Outlook
12.1. South America Organic Food Preservatives Revenue (USD Million), by Segments (2021-2032)
12.1.1. South America Organic Food Preservatives Revenue (USD Million) by Type (2021-2032)
12.1.2. South America Organic Food Preservatives Revenue (USD Million) by Application (2021-2032)
12.1.3. South America Organic Food Preservatives Revenue (USD Million) by Product (2021-2032)
By Application
Bakery And Confectionary
Beverages
Dairy, Sweet and Savory Snacks
Others
By Type
Dry
Liquid
Chapter 13. Middle East and Africa Organic Food Preservatives Analysis and Outlook
13.1. Middle East and Africa Organic Food Preservatives Revenue (USD Million), by Segments (2021-2032)
13.1.1. Middle East and Africa Organic Food Preservatives Revenue (USD Million) by Type (2021-2032)
13.1.2. Middle East and Africa Organic Food Preservatives Revenue (USD Million) by Application (2021-2032)
13.1.3. Middle East and Africa Organic Food Preservatives Revenue (USD Million) by Product (2021-2032)
By Application
Bakery And Confectionary
Beverages
Dairy, Sweet and Savory Snacks
Others
By Type
Dry
Liquid
Chapter 14. Organic Food Preservatives Company Profiles
14.1 Business Overview
14.2 Product Profiles
14.3 SWOT Profiles
14.5 Recent Developments
14.6 Financial Profile
List of Companies
Archer Daniels Midland Company (ADM)
Cargill Inc
Hawkins Watts Ltd
International Flavors and Fragrances Inc
Kalsec Inc
Kemin Industries Inc
Koninklijke DSM NV
Merck KGaA
Tate & Lyle Plc
Univar Solutions Inc
15. Methodology and Data Sources
15.1 Customization Offerings
15.2 Subscription Services
15.3 Related Reports
15.4 Publisher Expertise
LIST OF TABLES
Table 1 Market Segmentation Analysis
Table 2 Global Organic Food Preservatives Market Share of Leading Companies, 2023
Table 3 Product Offerings of Leading Companies
Table 4 Low Growth Scenario Forecasts
Table 5 Reference Case Growth Scenario
Table 6 High Growth Case Scenario
Table 7 Global Organic Food Preservatives Revenue (USD Million) And CAGR (%) By Type (2021-2032)
Table 8 Global Organic Food Preservatives Revenue (USD Million) And CAGR (%) By Application (2021-2032)
Table 9 Global Organic Food Preservatives Revenue (USD Million) And CAGR (%) By Product (2021-2032)
Table 10 Global Organic Food Preservatives Market Revenue (USD Million) By Regions (2021-2032)
Table 11 Global Organic Food Preservatives Market Share (%) By Regions (2021-2032)
Table 12 North America Organic Food Preservatives Revenue (USD Million) By Country (2021-2032)
Table 13 Europe Organic Food Preservatives Revenue (USD Million) By Country (2021-2032)
Table 14 Asia Pacific Organic Food Preservatives Revenue (USD Million) By Country (2021-2032)
Table 15 South America Organic Food Preservatives Revenue (USD Million) By Country (2021-2032)
Table 16 Middle East and Africa Organic Food Preservatives Revenue (USD Million) By Region (2021-2032)
Table 17 North America Organic Food Preservatives Revenue (USD Million) By Type (2021-2032)
Table 18 North America Organic Food Preservatives Revenue (USD Million) By Application (2021-2032)
Table 19 North America Organic Food Preservatives Revenue (USD Million) By Product (2021-2032)
Table 20 Europe Organic Food Preservatives Revenue (USD Million) By Type (2021-2032)
Table 21 Europe Organic Food Preservatives Revenue (USD Million) By Application (2021-2032)
Table 22 Europe Organic Food Preservatives Revenue (USD Million) By Product (2021-2032)
Table 23 Asia Pacific Organic Food Preservatives Revenue (USD Million) By Type (2021-2032)
Table 24 Asia Pacific Organic Food Preservatives Revenue (USD Million) By Application (2021-2032)
Table 25 Asia Pacific Organic Food Preservatives Revenue (USD Million) By Product (2021-2032)
Table 26 South America Organic Food Preservatives Revenue (USD Million) By Type (2021-2032)
Table 27 South America Organic Food Preservatives Revenue (USD Million) By Application (2021-2032)
Table 28 South America Organic Food Preservatives Revenue (USD Million) By Product (2021-2032)
Table 29 Middle East and Africa Organic Food Preservatives Revenue (USD Million) By Type (2021-2032)
Table 30 Middle East and Africa Organic Food Preservatives Revenue (USD Million) By Application (2021-2032)
Table 31 Middle East and Africa Organic Food Preservatives Revenue (USD Million) By Product (2021-2032)
LIST OF FIGURES
Figure 1. Market Scope
Figure 2. Pricing Forecasts Per Unit, 2023- 2032
Figure 3. Porter’s Five Forces
Figure 4. Global Organic Food Preservatives Market Revenue (USD Million) By Regions (2021-2032)
Figure 5. Global Organic Food Preservatives Market Share (%) By Regions (2023)
Figure 6. North America Organic Food Preservatives Revenue (USD Million) By Country (2021-2032)
Figure 7. United States Organic Food Preservatives Revenue (USD Million) By Country (2021-2032)
Figure 8. Canada Organic Food Preservatives Revenue (USD Million) By Country (2021-2032)
Figure 9. Mexico Organic Food Preservatives Revenue (USD Million) By Country (2021-2032)
Figure 10. Europe Organic Food Preservatives Revenue (USD Million) By Country (2021-2032)
Figure 11. Germany Organic Food Preservatives Revenue (USD Million) By Country (2021-2032)
Figure 12. France Organic Food Preservatives Revenue (USD Million) By Country (2021-2032)
Figure 13. United Kingdom Organic Food Preservatives Revenue (USD Million) By Country (2021-2032)
Figure 14. Spain Organic Food Preservatives Revenue (USD Million) By Country (2021-2032)
Figure 15. Italy Organic Food Preservatives Revenue (USD Million) By Country (2021-2032)
Figure 16. Russia Organic Food Preservatives Revenue (USD Million) By Country (2021-2032)
Figure 17. Rest of Europe Organic Food Preservatives Revenue (USD Million) By Country (2021-2032)
Figure 11. Asia Pacific Organic Food Preservatives Revenue (USD Million) By Country (2021-2032)
Figure 12. China Organic Food Preservatives Revenue (USD Million) By Country (2021-2032)
Figure 13. Japan Organic Food Preservatives Revenue (USD Million) By Country (2021-2032)
Figure 14. India Organic Food Preservatives Revenue (USD Million) By Country (2021-2032)
Figure 15. South Korea Organic Food Preservatives Revenue (USD Million) By Country (2021-2032)
Figure 16. Australia Organic Food Preservatives Revenue (USD Million) By Country (2021-2032)
Figure 17. South East Asia Organic Food Preservatives Revenue (USD Million) By Country (2021-2032)
Figure 18. South America Organic Food Preservatives Revenue (USD Million) By Country (2021-2032)
Figure 19. Brazil Organic Food Preservatives Revenue (USD Million) By Country (2021-2032)
Figure 20. Argentina Organic Food Preservatives Revenue (USD Million) By Country (2021-2032)
Figure 21. Rest of Asia Pacific Organic Food Preservatives Revenue (USD Million) By Country (2021-2032)
Figure 22. Middle East and Africa Organic Food Preservatives Revenue (USD Million) By Region (2021-2032)
Figure 23. Saudi Arabia Organic Food Preservatives Revenue (USD Million) By Region (2021-2032)
Figure 24. The UAE Organic Food Preservatives Revenue (USD Million) By Region (2021-2032)
Figure 25. Rest of Middle East Organic Food Preservatives Revenue (USD Million) By Region (2021-2032)
Figure 26. South Africa Organic Food Preservatives Revenue (USD Million) By Region (2021-2032)
Figure 27. Africa Organic Food Preservatives Revenue (USD Million) By Region (2021-2032)
Figure 28. North America Organic Food Preservatives Revenue (USD Million) By Type (2021-2032)
Figure 29. North America Organic Food Preservatives Revenue (USD Million) By Application (2021-2032)
Figure 30. North America Organic Food Preservatives Revenue (USD Million) By Product (2021-2032)
Figure 31. Europe Organic Food Preservatives Revenue (USD Million) By Type (2021-2032)
Figure 32. Europe Organic Food Preservatives Revenue (USD Million) By Application (2021-2032)
Figure 33. Europe Organic Food Preservatives Revenue (USD Million) By Product (2021-2032)
Figure 34. Asia Pacific Organic Food Preservatives Revenue (USD Million) By Type (2021-2032)
Figure 35. Asia Pacific Organic Food Preservatives Revenue (USD Million) By Application (2021-2032)
Figure 36. Asia Pacific Organic Food Preservatives Revenue (USD Million) By Product (2021-2032)
Figure 37. South America Organic Food Preservatives Revenue (USD Million) By Type (2021-2032)
Figure 38. South America Organic Food Preservatives Revenue (USD Million) By Application (2021-2032)
Figure 39. South America Organic Food Preservatives Revenue (USD Million) By Product (2021-2032)
Figure 40. Middle East and Africa Organic Food Preservatives Revenue (USD Million) By Type (2021-2032)
Figure 41. Middle East and Africa Organic Food Preservatives Revenue (USD Million) By Application (2021-2032)
Figure 42. Middle East and Africa Organic Food Preservatives Revenue (USD Million) By Product (2021-2032)
By Application
Bakery And Confectionary
Beverages
Dairy, Sweet and Savory Snacks
Others
By Type
Dry
Liquid
Countries Analyzed
North America (US, Canada, Mexico)
Europe (Germany, UK, France, Spain, Italy, Russia, Rest of Europe)
Asia Pacific (China, India, Japan, South Korea, Australia, South East Asia, Rest of Asia)
South America (Brazil, Argentina, Rest of South America)
Middle East and Africa (Saudi Arabia, UAE, Rest of Middle East, South Africa, Egypt, Rest of Africa)
