<h3><Strong><i>Global Organic Snacks Market Size is valued at $13.6 Billion in 2024 and is forecast to register a growth rate (CAGR) of 8.8% to reach $26.7 Billion by 2032.</h3></Strong></i>The global Organic Snacks Market Comprehensive Study analyzes and forecasts the market size across 6 regions and 24 countries for diverse segments -By Product (Grain Snacks, Nut-Based Snacks, Meat Snacks, Snack Bars, Frozen Snacks, Vegetable & Fruit Snacks, Bakery Snacks, Others), By Distribution Channel (Supermarkets/Hypermarkets, Convenience Stores, Specialty Food Stores, Online Retailers, Others)
<h2>An Introduction to Organic Snacks Market</h2>The organic snacks market in 2024 is thriving, driven by a surge in consumer demand for healthier, natural, and sustainably sourced snack options. This market encompasses a wide variety of products, including organic chips, fruit bars, nuts, seeds, and granola, all made from ingredients that are free from synthetic pesticides, herbicides, and GMOs. Health-conscious consumers are increasingly seeking snacks that offer nutritional benefits, such as high fiber, protein, and essential vitamins and minerals, while also being free from artificial additives and preservatives. The trend towards clean eating and transparency in ingredient sourcing has significantly boosted the popularity of organic snacks. Innovations in flavor combinations, packaging, and product formulations are further enhancing the appeal and accessibility of these snacks. As consumers continue to prioritize health, wellness, and sustainability, the organic snacks market is set for robust growth, driven by ongoing product innovation and expanding distribution channels.
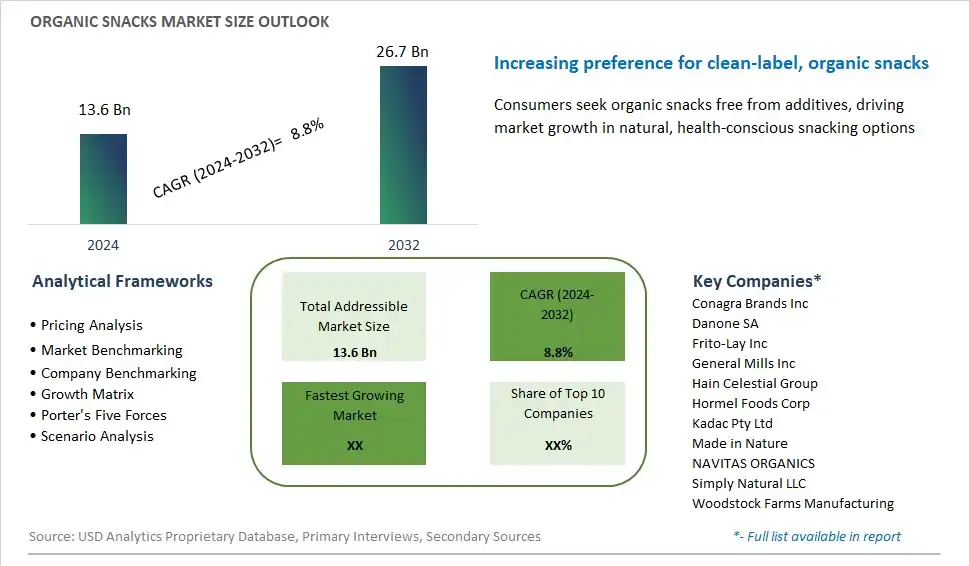
<h2>Organic Snacks Competitive Landscape</h2>The market report analyses the leading companies in the industry including Conagra Brands Inc, Danone SA, Frito-Lay Inc, General Mills Inc, Hain Celestial Group, Hormel Foods Corp, Kadac Pty Ltd, Made in Nature, NAVITAS ORGANICS, Simply Natural LLC, Woodstock Farms Manufacturing, and Others.<h2>Organic Snacks Market Dynamics</h2><h3>Organic Snacks Market Trend: Increasing Demand for Healthy and Convenient Snacking Options</h3>Organic snacks are experiencing a notable trend towards increased consumer demand, driven by a growing preference for healthier, natural alternatives to traditional snacks and a rising awareness of the importance of sustainable food choices. This trend reflects a broader societal shift towards health-conscious lifestyles, with consumers seeking out snacks that offer nutritional benefits, clean ingredients, and environmental responsibility. Organic snacks encompass a diverse range of products, including chips, bars, nuts, dried fruits, and popcorn, made from organic ingredients free from synthetic pesticides, herbicides, and genetically modified organisms (GMOs). As more individuals prioritize health, wellness, and ethical consumption in their dietary choices, the market for organic snacks is witnessing steady growth and innovation.<h3>Market Driver: Health-Conscious Consumers and Sustainability Awareness</h3>The rapid expansion of the organic snacks market is primarily driven by health-conscious consumers and their increasing awareness of sustainability issues in food production. With growing concerns about the health effects of processed foods, artificial ingredients, and excessive sugar consumption, there is a heightened interest in organic snacks as healthier alternatives. Organic snacks are perceived as safer and more nutritious options, offering reassurance that they are produced with respect for the environment and human health. Moreover, the environmental impact of conventional farming practices, such as soil degradation, water pollution, and biodiversity loss, has prompted consumers to seek out organic options as a more sustainable choice. As consumers become more educated about the connection between diet, health, and the environment, the demand for organic snacks is expected to continue growing, driving market expansion and product innovation.<h3>Market Opportunity: Innovation in Flavor Profiles and Packaging Formats</h3>One significant opportunity within the market for organic snacks lies in innovation in flavor profiles and packaging formats to meet the evolving needs and preferences of consumers. Brands can differentiate themselves by offering a wider range of flavor options, including classic favorites as well as unique and exotic combinations that appeal to adventurous eaters. Additionally, incorporating innovative packaging formats such as single-serve packs, resealable pouches, and on-the-go formats can enhance convenience and portability, catering to busy lifestyles and creating new consumption occasions. Furthermore, developing value-added products such as protein-packed snacks, grain-free options, and allergen-friendly choices can expand market reach and appeal to consumers with specific dietary needs or lifestyle preferences. Collaborations with chefs, nutritionists, and wellness experts can drive product innovation and marketing strategies, ensuring that organic snacks meet the evolving tastes and desires of health-conscious consumers. As the market for organic snacks continues to evolve, brands that prioritize innovation, differentiation, and consumer engagement are well-positioned to capitalize on the growing demand for convenient, nutritious, and sustainably sourced snack options.<h3>Organic Snacks Market Share Analysis: Nut-Based Snacks held the dominant market share in 2024</h3>In the Organic Snacks Market by product, the Nut-Based Snacks segment is the largest. This dominance is primarily attributed to several factors. Firstly, nut-based snacks, such as almonds, cashews, and peanuts, are widely consumed and appreciated for their nutritional value, including being rich in protein, healthy fats, vitamins, and minerals. Consumers increasingly seek out healthier snack options, making nut-based snacks an attractive choice due to their perceived health benefits. Additionally, nut-based snacks are versatile and can be enjoyed on their own or incorporated into various recipes, catering to diverse tastes and preferences. Further, the growing trend towards plant-based diets and the increasing demand for natural and minimally processed foods have contributed to the popularity of nut-based snacks. Furthermore, the availability of a wide variety of organic nut-based snack options in supermarkets, specialty stores, and online platforms has further fueled their growth. With their nutritional value, versatility, and alignment with consumer preferences for healthier snack options, the Nut-Based Snacks segment solidifies its position as the largest in the organic snacks market.<h3>Organic Snacks Market Share Analysis: Online Retailers market is poised to register the fastest growth rae over the forecast period to 2032</h3>In the Organic Snacks Market by distribution channel, the Online Retailers segment is the fastest-growing. This rapid growth can be attributed to several factors. Firstly, the convenience and accessibility of online shopping have become increasingly appealing to consumers, particularly in light of the COVID-19 pandemic, which has accelerated the shift towards e-commerce. Consumers can conveniently browse a wide variety of organic snacks from the comfort of their homes, compare prices, and read reviews before making a purchase. Additionally, online retailers often offer a broader selection of organic snack options, including niche and specialty items, catering to the diverse preferences of health-conscious consumers. Furthermore, the proliferation of online grocery platforms and subscription services has made it easier for consumers to incorporate organic snacks into their daily routines. With the continuous advancements in technology and the evolving landscape of online shopping, the online distribution channel in the organic snacks market is poised for sustained growth in the foreseeable future.<h2>Organic Snacks Market Segmentation</h2><Strong>By Product</Strong>
Grain Snacks
Nut-Based Snacks
Meat Snacks
Snack Bars
Frozen Snacks
Vegetable & Fruit Snacks
Bakery Snacks
Others
<Strong>By Distribution Channel</Strong>
Supermarkets/Hypermarkets
Convenience Stores
Specialty Food Stores
Online Retailers
Others
<Strong>Countries Analyzed</Strong>
North America (US, Canada, Mexico)
Europe (Germany, UK, France, Spain, Italy, Russia, Rest of Europe)
Asia Pacific (China, India, Japan, South Korea, Australia, South East Asia, Rest of Asia)
South America (Brazil, Argentina, Rest of South America)
Middle East and Africa (Saudi Arabia, UAE, Rest of Middle East, South Africa, Egypt, Rest of Africa)<h2>Organic Snacks Companies Profiled in the Study</h2>Conagra Brands Inc
Danone SA
Frito-Lay Inc
General Mills Inc
Hain Celestial Group
Hormel Foods Corp
Kadac Pty Ltd
Made in Nature
NAVITAS ORGANICS
Simply Natural LLC
Woodstock Farms Manufacturing
*- List Not Exhaustive
<Strong>Chapter 1. TABLE OF CONTENTS</Strong>
<Strong>Chapter 2. Introduction to Organic Snacks Market </Strong>
2.1. Market Overview
2.2. Key Statistics and Report Highlights
2.3. Scope of the Comprehensive Study
2.3.1. Market Definition
2.3.2 Countries and Regions Covered
2.3.3 Research Objective
2.3.4 Units, Currency, and Conversions
2.3.5 Industry Value Chain
2.4. Key Market Segments
2.5. Key Companies
2.6. Study Period
<Strong>Chapter 3. Strategic Analysis Review</Strong>
3.1. Organic Snacks Pricing Analysis and Forecast
3.2. Porter’s Five Forces
3.3. Market Ecosystem
3.4. SWOT Analysis
3.5. Regulatory Scenario
3.3. Effects of Inflation, Russia-Ukraine War, moderating economic growth, and other macroeconomic factors
<Strong>Chapter 4. Competitive Landscape</Strong>
4.1. Market Share Analysis
4.1.1. Global Organic Snacks Market Share by Company, 2023
4.1.2. Product Offerings of Leading Organic Snacks Companies
4.2. Market Entropy
4.2.1. New Product Launches in the Industry
4.2.2. Mergers, Acquisitions, Joint ventures, and Partnerships
4.3. Key Strategies and Best Practices
<Strong>Chapter 5. Global Market Projections: Best, Reference, and Low Case Scenarios</Strong>
5.1. Growth Analysis- Case Scenario Definitions
5.2. Low Growth Case Scenario Forecasts
5.3. Reference Growth Case Scenario Forecasts
5.4. High Growth Case Scenario Forecasts
<Strong>Chapter 6. Market Dynamics</Strong>
6.1. Organic Snacks Market Drivers
6.2. Organic Snacks Market Challenges
6.6. Organic Snacks Market Opportunities
6.4. Organic Snacks Market Trends
<Strong>Chapter 7. Global Organic Snacks Market Outlook Trends</Strong>
7.1. Global Organic Snacks Revenue (USD Million) and CAGR (%) by Type (2021-2032)
7.2. Global Organic Snacks Revenue (USD Million) and CAGR (%) by Application (2021-2032)
7.3. Global Organic Snacks Revenue (USD Million) and CAGR (%) by Product (2021-2032)
<Strong>By Product</Strong>
Grain Snacks
Nut-Based Snacks
Meat Snacks
Snack Bars
Frozen Snacks
Vegetable & Fruit Snacks
Bakery Snacks
Others
<Strong>By Distribution Channel</Strong>
Supermarkets/Hypermarkets
Convenience Stores
Specialty Food Stores
Online Retailers
Others
<Strong>Chapter 8. Global Organic Snacks Regional Analysis and Outlook</Strong>
8.1. Global Organic Snacks Revenue (USD Million) By Regions (2021- 2032)
8.2. North America Organic Snacks Revenue (USD Million) by Country (2021-2032)
8.2.1. United States Organic Snacks Regional Analysis and Outlook
8.2.2. Canada Organic Snacks Regional Analysis and Outlook
8.2.3. Mexico Organic Snacks Regional Analysis and Outlook
8.3. Europe Organic Snacks Revenue (USD Million), by Country (2021-2032)
8.3.1. Germany Organic Snacks Regional Analysis and Outlook
8.3.2. France Organic Snacks Regional Analysis and Outlook
8.3.3. United Kingdom Organic Snacks Regional Analysis and Outlook
8.3.4. Spain Organic Snacks Regional Analysis and Outlook
8.3.5. Italy Organic Snacks Regional Analysis and Outlook
8.3.6. Russia Organic Snacks Regional Analysis and Outlook
8.3.7. Rest of Europe Organic Snacks Regional Analysis and Outlook
8.4. Asia Pacific Organic Snacks Revenue (USD Million) by Country (2021-2032)
8.4.1. China Organic Snacks Regional Analysis and Outlook
8.4.2. Japan Organic Snacks Regional Analysis and Outlook
8.4.3. India Organic Snacks Regional Analysis and Outlook
8.4.4. South Korea Organic Snacks Regional Analysis and Outlook
8.4.5. Australia Organic Snacks Regional Analysis and Outlook
8.4.6. South East Asia Organic Snacks Regional Analysis and Outlook
8.4.7. Rest of Asia Pacific Organic Snacks Regional Analysis and Outlook
8.5. South America Organic Snacks Revenue (USD Million), by Country (2021-2032)
8.5.1. Brazil Organic Snacks Regional Analysis and Outlook
8.5.2. Argentina Organic Snacks Regional Analysis and Outlook
8.5.3. Rest of South America Organic Snacks Regional Analysis and Outlook
8.6. Middle East and Africa Organic Snacks Revenue (USD Million) by Country (2021-2032)
8.6.1. Middle East Organic Snacks Regional Analysis and Outlook
8.6.2. Africa Organic Snacks Regional Analysis and Outlook
<Strong>Chapter 9. North America Organic Snacks Analysis and Outlook</Strong>
9.1. North America Organic Snacks Revenue (USD Million) by Segments (2021-2032)
9.1.1. North America Organic Snacks Revenue (USD Million) by Type (2021-2032)
9.1.2. North America Organic Snacks Revenue (USD Million) by Application (2021-2032)
9.1.3. North America Organic Snacks Revenue (USD Million) by Product (2021-2032)
<Strong>By Product</Strong>
Grain Snacks
Nut-Based Snacks
Meat Snacks
Snack Bars
Frozen Snacks
Vegetable & Fruit Snacks
Bakery Snacks
Others
<Strong>By Distribution Channel</Strong>
Supermarkets/Hypermarkets
Convenience Stores
Specialty Food Stores
Online Retailers
Others
<Strong>Chapter 10. Europe Organic Snacks Analysis and Outlook</Strong>
10.1. Europe Organic Snacks Revenue (USD Million), by Segments (USD Million) (2021-2032)
10.1.1. Europe Organic Snacks Revenue (USD Million) by Type (2021-2032)
10.1.2. Europe Organic Snacks Revenue (USD Million) by Application (2021-2032)
10.1.3. Europe Organic Snacks Revenue (USD Million) by Product (2021-2032)
<Strong>By Product</Strong>
Grain Snacks
Nut-Based Snacks
Meat Snacks
Snack Bars
Frozen Snacks
Vegetable & Fruit Snacks
Bakery Snacks
Others
<Strong>By Distribution Channel</Strong>
Supermarkets/Hypermarkets
Convenience Stores
Specialty Food Stores
Online Retailers
Others
<Strong>Chapter 11. Asia Pacific Organic Snacks Analysis and Outlook</Strong>
11.1. Asia Pacific Organic Snacks Revenue (USD Million), and Revenue (USD Million) by Segments (2021-2032)
11.1.1. Asia Pacific Organic Snacks Revenue (USD Million) by Type (2021-2032)
11.1.2. Asia Pacific Organic Snacks Revenue (USD Million) by Application (2021-2032)
11.1.3. Asia Pacific Organic Snacks Revenue (USD Million) by Product (2021-2032)
<Strong>By Product</Strong>
Grain Snacks
Nut-Based Snacks
Meat Snacks
Snack Bars
Frozen Snacks
Vegetable & Fruit Snacks
Bakery Snacks
Others
<Strong>By Distribution Channel</Strong>
Supermarkets/Hypermarkets
Convenience Stores
Specialty Food Stores
Online Retailers
Others
<Strong>Chapter 12. South America Organic Snacks Analysis and Outlook</Strong>
12.1. South America Organic Snacks Revenue (USD Million), by Segments (2021-2032)
12.1.1. South America Organic Snacks Revenue (USD Million) by Type (2021-2032)
12.1.2. South America Organic Snacks Revenue (USD Million) by Application (2021-2032)
12.1.3. South America Organic Snacks Revenue (USD Million) by Product (2021-2032)
<Strong>By Product</Strong>
Grain Snacks
Nut-Based Snacks
Meat Snacks
Snack Bars
Frozen Snacks
Vegetable & Fruit Snacks
Bakery Snacks
Others
<Strong>By Distribution Channel</Strong>
Supermarkets/Hypermarkets
Convenience Stores
Specialty Food Stores
Online Retailers
Others
<Strong>Chapter 13. Middle East and Africa Organic Snacks Analysis and Outlook</Strong>
13.1. Middle East and Africa Organic Snacks Revenue (USD Million), by Segments (2021-2032)
13.1.1. Middle East and Africa Organic Snacks Revenue (USD Million) by Type (2021-2032)
13.1.2. Middle East and Africa Organic Snacks Revenue (USD Million) by Application (2021-2032)
13.1.3. Middle East and Africa Organic Snacks Revenue (USD Million) by Product (2021-2032)
<Strong>By Product</Strong>
Grain Snacks
Nut-Based Snacks
Meat Snacks
Snack Bars
Frozen Snacks
Vegetable & Fruit Snacks
Bakery Snacks
Others
<Strong>By Distribution Channel</Strong>
Supermarkets/Hypermarkets
Convenience Stores
Specialty Food Stores
Online Retailers
Others
<Strong>Chapter 14. Organic Snacks Company Profiles</Strong>
14.1 Business Overview
14.2 Product Profiles
14.3 SWOT Profiles
14.5 Recent Developments
14.6 Financial Profile
List of Companies
Conagra Brands Inc
Danone SA
Frito-Lay Inc
General Mills Inc
Hain Celestial Group
Hormel Foods Corp
Kadac Pty Ltd
Made in Nature
NAVITAS ORGANICS
Simply Natural LLC
Woodstock Farms Manufacturing
<Strong>15. Methodology and Data Sources</Strong>
15.1 Customization Offerings
15.2 Subscription Services
15.3 Related Reports
15.4 Publisher Expertise
<Strong>LIST OF TABLES</Strong>
Table 1 Market Segmentation Analysis
Table 2 Global Organic Snacks Market Share of Leading Companies, 2023
Table 3 Product Offerings of Leading Companies
Table 4 Low Growth Scenario Forecasts
Table 5 Reference Case Growth Scenario
Table 6 High Growth Case Scenario
Table 7 Global Organic Snacks Revenue (USD Million) And CAGR (%) By Type (2021-2032)
Table 8 Global Organic Snacks Revenue (USD Million) And CAGR (%) By Application (2021-2032)
Table 9 Global Organic Snacks Revenue (USD Million) And CAGR (%) By Product (2021-2032)
Table 10 Global Organic Snacks Market Revenue (USD Million) By Regions (2021-2032)
Table 11 Global Organic Snacks Market Share (%) By Regions (2021-2032)
Table 12 North America Organic Snacks Revenue (USD Million) By Country (2021-2032)
Table 13 Europe Organic Snacks Revenue (USD Million) By Country (2021-2032)
Table 14 Asia Pacific Organic Snacks Revenue (USD Million) By Country (2021-2032)
Table 15 South America Organic Snacks Revenue (USD Million) By Country (2021-2032)
Table 16 Middle East and Africa Organic Snacks Revenue (USD Million) By Region (2021-2032)
Table 17 North America Organic Snacks Revenue (USD Million) By Type (2021-2032)
Table 18 North America Organic Snacks Revenue (USD Million) By Application (2021-2032)
Table 19 North America Organic Snacks Revenue (USD Million) By Product (2021-2032)
Table 20 Europe Organic Snacks Revenue (USD Million) By Type (2021-2032)
Table 21 Europe Organic Snacks Revenue (USD Million) By Application (2021-2032)
Table 22 Europe Organic Snacks Revenue (USD Million) By Product (2021-2032)
Table 23 Asia Pacific Organic Snacks Revenue (USD Million) By Type (2021-2032)
Table 24 Asia Pacific Organic Snacks Revenue (USD Million) By Application (2021-2032)
Table 25 Asia Pacific Organic Snacks Revenue (USD Million) By Product (2021-2032)
Table 26 South America Organic Snacks Revenue (USD Million) By Type (2021-2032)
Table 27 South America Organic Snacks Revenue (USD Million) By Application (2021-2032)
Table 28 South America Organic Snacks Revenue (USD Million) By Product (2021-2032)
Table 29 Middle East and Africa Organic Snacks Revenue (USD Million) By Type (2021-2032)
Table 30 Middle East and Africa Organic Snacks Revenue (USD Million) By Application (2021-2032)
Table 31 Middle East and Africa Organic Snacks Revenue (USD Million) By Product (2021-2032)
<Strong>LIST OF FIGURES</Strong>
Figure 1. Market Scope
Figure 2. Pricing Forecasts Per Unit, 2023- 2032
Figure 3. Porter’s Five Forces
Figure 4. Global Organic Snacks Market Revenue (USD Million) By Regions (2021-2032)
Figure 5. Global Organic Snacks Market Share (%) By Regions (2023)
Figure 6. North America Organic Snacks Revenue (USD Million) By Country (2021-2032)
Figure 7. United States Organic Snacks Revenue (USD Million) By Country (2021-2032)
Figure 8. Canada Organic Snacks Revenue (USD Million) By Country (2021-2032)
Figure 9. Mexico Organic Snacks Revenue (USD Million) By Country (2021-2032)
Figure 10. Europe Organic Snacks Revenue (USD Million) By Country (2021-2032)
Figure 11. Germany Organic Snacks Revenue (USD Million) By Country (2021-2032)
Figure 12. France Organic Snacks Revenue (USD Million) By Country (2021-2032)
Figure 13. United Kingdom Organic Snacks Revenue (USD Million) By Country (2021-2032)
Figure 14. Spain Organic Snacks Revenue (USD Million) By Country (2021-2032)
Figure 15. Italy Organic Snacks Revenue (USD Million) By Country (2021-2032)
Figure 16. Russia Organic Snacks Revenue (USD Million) By Country (2021-2032)
Figure 17. Rest of Europe Organic Snacks Revenue (USD Million) By Country (2021-2032)
Figure 11. Asia Pacific Organic Snacks Revenue (USD Million) By Country (2021-2032)
Figure 12. China Organic Snacks Revenue (USD Million) By Country (2021-2032)
Figure 13. Japan Organic Snacks Revenue (USD Million) By Country (2021-2032)
Figure 14. India Organic Snacks Revenue (USD Million) By Country (2021-2032)
Figure 15. South Korea Organic Snacks Revenue (USD Million) By Country (2021-2032)
Figure 16. Australia Organic Snacks Revenue (USD Million) By Country (2021-2032)
Figure 17. South East Asia Organic Snacks Revenue (USD Million) By Country (2021-2032)
Figure 18. South America Organic Snacks Revenue (USD Million) By Country (2021-2032)
Figure 19. Brazil Organic Snacks Revenue (USD Million) By Country (2021-2032)
Figure 20. Argentina Organic Snacks Revenue (USD Million) By Country (2021-2032)
Figure 21. Rest of Asia Pacific Organic Snacks Revenue (USD Million) By Country (2021-2032)
Figure 22. Middle East and Africa Organic Snacks Revenue (USD Million) By Region (2021-2032)
Figure 23. Saudi Arabia Organic Snacks Revenue (USD Million) By Region (2021-2032)
Figure 24. The UAE Organic Snacks Revenue (USD Million) By Region (2021-2032)
Figure 25. Rest of Middle East Organic Snacks Revenue (USD Million) By Region (2021-2032)
Figure 26. South Africa Organic Snacks Revenue (USD Million) By Region (2021-2032)
Figure 27. Africa Organic Snacks Revenue (USD Million) By Region (2021-2032)
Figure 28. North America Organic Snacks Revenue (USD Million) By Type (2021-2032)
Figure 29. North America Organic Snacks Revenue (USD Million) By Application (2021-2032)
Figure 30. North America Organic Snacks Revenue (USD Million) By Product (2021-2032)
Figure 31. Europe Organic Snacks Revenue (USD Million) By Type (2021-2032)
Figure 32. Europe Organic Snacks Revenue (USD Million) By Application (2021-2032)
Figure 33. Europe Organic Snacks Revenue (USD Million) By Product (2021-2032)
Figure 34. Asia Pacific Organic Snacks Revenue (USD Million) By Type (2021-2032)
Figure 35. Asia Pacific Organic Snacks Revenue (USD Million) By Application (2021-2032)
Figure 36. Asia Pacific Organic Snacks Revenue (USD Million) By Product (2021-2032)
Figure 37. South America Organic Snacks Revenue (USD Million) By Type (2021-2032)
Figure 38. South America Organic Snacks Revenue (USD Million) By Application (2021-2032)
Figure 39. South America Organic Snacks Revenue (USD Million) By Product (2021-2032)
Figure 40. Middle East and Africa Organic Snacks Revenue (USD Million) By Type (2021-2032)
Figure 41. Middle East and Africa Organic Snacks Revenue (USD Million) By Application (2021-2032)
Figure 42. Middle East and Africa Organic Snacks Revenue (USD Million) By Product (2021-2032)
