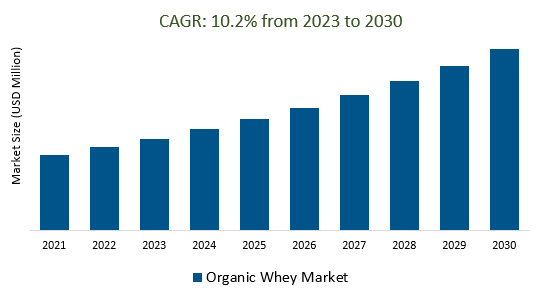
The Global Organic Whey Market Size is estimated to register 10.2% growth over the forecast period from 2023 to 2030.
The growth of the market is fueled by the rising consumer awareness of the health benefits associated with organic and natural products. This awareness is expected to boost the demand for organic whey products as health-conscious consumers actively seek cleaner and more natural protein sources. Leading Companies focusing on Innovative Product Development and Diversification, Sustainability, and Eco-Friendly Initiatives, Digital Marketing and E-commerce Expansion, Functional and Nutraceutical Organic Whey Products, Regulatory Compliance and Certification Updates, Collaborative Partnerships and Supply Chain Enhancements, and others to boost market shares in the industry.
Market Overview
Fueled by a rising desire for clean-label, natural protein sources, the organic whey market had seen consistent growth, finding use in various sectors like sports nutrition and dairy. Prominent industry leaders such as Organic Valley, Hilmar Ingredients, and Aurora Organic Dairy prioritized transparency and upheld rigorous organic certification standards. Although supply chain hurdles and relatively higher costs compared to conventional whey protein persisted, the market displayed substantial potential, particularly in North America and Europe, thanks to established organic dairy sectors.
Market Dynamics
Market Trends- Emerging markets are fueling the growth of the organic whey market.
Emerging markets are pivotal in propelling the growth of the organic whey market as rising middle-class populations, increased health consciousness, and improving disposable incomes drive demand for clean and natural protein sources. This global expansion extends to regions in Asia, Latin America, and Africa, presenting both opportunities and challenges for businesses. Companies must adapt their strategies to navigate local preferences, regulations, and sustainability concerns while capitalizing on government support and the competitive landscape in these dynamic markets.
Market Driver- Consumers are demanding organic whey products with clean labels and ingredient transparency.
The organic whey market is experiencing a rising consumer demand for products featuring transparent labeling and clear ingredient information. As a result, brands are shifting their focus towards streamlining their formulations, excluding artificial additives, and strictly adhering to rigorous organic certification standards. Meeting these expectations has become a critical factor in gaining consumer trust and maintaining competitiveness in this industry.
Market Opportunity- Direct-to-consumer sales and e-commerce are surging for organic whey products, as consumers seek out convenient and personalized shopping experiences.
E-commerce and direct-to-consumer (DTC) sales are on the rise within the organic whey market due to consumers' growing preference for convenient, personalized shopping experiences. Brands are capitalizing on these channels to establish direct connections with consumers, introduce customization and subscription choices, and expand their global reach, making organic whey products more accessible. While online reviews and recommendations are influential, brands face increased competition and regulatory compliance challenges in this digital environment as they strive for success.
Market Share Analysis- D90 Organic Whey Market will register the fastest growth
The Global Organic Whey Market is analyzed across D90, D70, and others. D90 is poised to register the fastest growth. Conaprole's partially demineralized cheese whey powder (D90) is produced using skimmed cheese whey subjected to a series of processes, including nanofiltration, electrodialysis, and ion exchange. Subsequently, it is concentrated via a vacuum evaporation system, dried through a spray drying process, and packaged based on the desired presentation.
Market Share Analysis- Sports Nutrition held a significant market share in 2023
The Global Organic Whey Market is analyzed across various applications including Sports Nutrition, Dietary Supplements, Infant Formula, Food Additives, Beverages, Feed, and others. Of these, Sports Nutrition held a significant market share in 2023. The sports nutrition organic whey market has been growing due to increased consumer interest in fitness and organic, clean-label products. Organic whey protein is sought after by athletes and fitness enthusiasts for its natural, high-quality protein content. The market spans regions globally, with brands emphasizing certification, quality, and diverse product offerings.
Organic Whey Market News-
Herbalife Launches Herbalife V Growing Consumer Demand for Plant-Based Choices. Herbalife, a leading nutrition and wellness company, has unveiled 'Herbalife V,' a new product line designed to cater to the rising consumer preference for plant-based options.
Sweegen Introduces Sweetensify Flavors with Revolutionary Natural Sweet Protein Technology Brazzein. Leveraging Sweegen's groundbreaking sweet protein technology featuring brazzein, thaumatin II, and other distinct proteins, Sweetensify Flavors enhances and adjusts sweet taste profiles, replicating a sugar-like sensation and advancing the frontiers of healthier product development.
Organic Whey Market Segmentation
By Type
By Application
- Sports Nutrition
- Dietary Supplements
- Infant Formula
- Food Additives
- Beverages
- Feed
By Distribution Channel
By Region
- North America (United States, Canada, Mexico)
- Europe (Germany, France, United Kingdom, Spain, Italy, Others)
- Asia Pacific (China, India, Japan, South Korea, Australia, Others)
- Latin America (Brazil, Argentina, Others)
- Middle East and Africa (Saudi Arabia, UAE, Kuwait, Other Middle East, South Africa, Nigeria, Other Africa)
Organic Whey Market Companies
- Euroserum
- FrieslandCampina Domo B.V.
- Valio
- Lactalis
- Dairy Crest
- Hochwald
- Organic Protein Company
- James Farrell & Co
- Raw Organic Whey
- Organic Valley
- Milk Specialties
*List not exhaustive
Organic Whey Market Outlook 2023
1 Market Overview
1.1 Introduction to the Organic Whey Market
1.2 Scope of the Study
1.3 Research Objective
1.3.1 Key Market Scope and Segments
1.3.2 Players Covered
1.3.3 Years Considered
2 Executive Summary
2.1 2023 Organic Whey Industry- Market Statistics
3 Market Dynamics
3.1 Market Drivers
3.2 Market Challenges
3.3 Market Opportunities
3.4 Market Trends
4 Market Factor Analysis
4.1 Porter’s Five Forces
4.2 Market Entropy
4.2.1 Global Organic Whey Market Companies with Area Served
4.2.2 Products Offerings Global Organic Whey Market
5 COVID-19 Impact Analysis and Outlook Scenarios
5.1.1 Covid-19 Impact Analysis
5.1.2 post-COVID-19 Scenario- Low Growth Case
5.1.3 post-COVID-19 Scenario- Reference Growth Case
5.1.4 post-COVID-19 Scenario- Low Growth Case
6 Global Organic Whey Market Trends
6.1 Global Organic Whey Revenue (USD Million) and CAGR (%) by Type (2018-2030)
6.2 Global Organic Whey Revenue (USD Million) and CAGR (%) by Applications (2018-2030)
6.3 Global Organic Whey Revenue (USD Million) and CAGR (%) by regions (2018-2030)
7 Global Organic Whey Market Revenue (USD Million) by Type, and Applications (2018-2022)
7.1 Global Organic Whey Revenue (USD Million) by Type (2018-2022)
7.1.1 Global Organic Whey Revenue (USD Million), Market Share (%) by Type (2018-2022)
7.2 Global Organic Whey Revenue (USD Million) by Applications (2018-2022)
7.2.1 Global Organic Whey Revenue (USD Million), Market Share (%) by Applications (2018-2022)
8 Global Organic Whey Development Regional Status and Outlook
8.1 Global Organic Whey Revenue (USD Million) By Regions (2018-2022)
8.2 North America Organic Whey Revenue (USD Million) by Type, and Application (2018-2022)
8.2.1 North America Organic Whey Revenue (USD Million) by Country (2018-2022)
8.2.2 North America Organic Whey Revenue (USD Million) by Type (2018-2022)
8.2.3 North America Organic Whey Revenue (USD Million) by Applications (2018-2022)
8.3 Europe Organic Whey Revenue (USD Million), by Type, and Applications (USD Million) (2018-2022)
8.3.1 Europe Organic Whey Revenue (USD Million), by Country (2018-2022)
8.3.2 Europe Organic Whey Revenue (USD Million) by Type (2018-2022)
8.3.3 Europe Organic Whey Revenue (USD Million) by Applications (2018-2022)
8.4 Asia Pacific Organic Whey Revenue (USD Million), and Revenue (USD Million) by Type, and Applications (2018-2022)
8.4.1 Asia Pacific Organic Whey Revenue (USD Million) by Country (2018-2022)
8.4.2 Asia Pacific Organic Whey Revenue (USD Million) by Type (2018-2022)
8.4.3 Asia Pacific Organic Whey Revenue (USD Million) by Applications (2018-2022)
8.5 South America Organic Whey Revenue (USD Million), by Type, and Applications (2018-2022)
8.5.1 South America Organic Whey Revenue (USD Million), by Country (2018-2022)
8.5.2 South America Organic Whey Revenue (USD Million) by Type (2018-2022)
8.5.3 South America Organic Whey Revenue (USD Million) by Applications (2018-2022)
8.6 Middle East and Africa Organic Whey Revenue (USD Million), by Type, Technology, Application, Thickness (2018-2022)
8.6.1 Middle East and Africa Organic Whey Revenue (USD Million) by Country (2018-2022)
8.6.2 Middle East and Africa Organic Whey Revenue (USD Million) by Type (2018-2022)
8.6.3 Middle East and Africa Organic Whey Revenue (USD Million) by Applications (2018-2022)
9 Company Profiles
10 Global Organic Whey Market Revenue (USD Million), by Type, and Applications (2023-2030)
10.1 Global Organic Whey Revenue (USD Million) and Market Share (%) by Type (2023-2030)
10.1.1 Global Organic Whey Revenue (USD Million), and Market Share (%) by Type (2023-2030)
10.2 Global Organic Whey Revenue (USD Million) and Market Share (%) by Applications (2023-2030)
10.2.1 Global Organic Whey Revenue (USD Million), and Market Share (%) by Applications (2023-2030)
11 Global Organic Whey Development Regional Status and Outlook Forecast
11.1 Global Organic Whey Revenue (USD Million) By Regions (2023-2030)
11.2 North America Organic Whey Revenue (USD Million) by Type, and Applications (2023-2030)
11.2.1 North America Organic Whey Revenue (USD) Million by Country (2023-2030)
11.2.2 North America Organic Whey Revenue (USD Million), by Type (2023-2030)
11.2.3 North America Organic Whey Revenue (USD Million), Market Share (%) by Applications (2023-2030)
11.3 Europe Organic Whey Revenue (USD Million), by Type, and Applications (2023-2030)
11.3.1 Europe Organic Whey Revenue (USD Million), by Country (2023-2030)
11.3.2 Europe Organic Whey Revenue (USD Million), by Type (2023-2030)
11.3.3 Europe Organic Whey Revenue (USD Million), by Applications (2023-2030)
11.4 Asia Pacific Organic Whey Revenue (USD Million) by Type, and Applications (2023-2030)
11.4.1 Asia Pacific Organic Whey Revenue (USD Million), by Country (2023-2030)
11.4.2 Asia Pacific Organic Whey Revenue (USD Million), by Type (2023-2030)
11.4.3 Asia Pacific Organic Whey Revenue (USD Million), by Applications (2023-2030)
11.5 South America Organic Whey Revenue (USD Million), by Type, and Applications (2023-2030)
11.5.1 South America Organic Whey Revenue (USD Million), by Country (2023-2030)
11.5.2 South America Organic Whey Revenue (USD Million), by Type (2023-2030)
11.5.3 South America Organic Whey Revenue (USD Million), by Applications (2023-2030)
11.6 Middle East and Africa Organic Whey Revenue (USD Million), by Type, and Applications (2023-2030)
11.6.1 Middle East and Africa Organic Whey Revenue (USD Million), by region (2023-2030)
11.6.2 Middle East and Africa Organic Whey Revenue (USD Million), by Type (2023-2030)
11.6.3 Middle East and Africa Organic Whey Revenue (USD Million), by Applications (2023-2030)
12 Methodology and Data Sources
12.1 Methodology/Research Approach
12.1.1 Research Programs/Design
12.1.2 Market Size Estimation
12.1.3 Market Breakdown and Data Triangulation
12.2 Data Sources
12.2.1 Secondary Sources
12.2.2 Primary Sources
12.3 Disclaimer
List of Tables
Table 1 Market Segmentation Analysis
Table 2 Global Organic Whey Market Companies with Areas Served
Table 3 Products Offerings Global Organic Whey Market
Table 4 Low Growth Scenario Forecasts
Table 5 Reference Case Growth Scenario
Table 6 High Growth Case Scenario
Table 7 Global Organic Whey Revenue (USD Million) And CAGR (%) By Type (2018-2030)
Table 8 Global Organic Whey Revenue (USD Million) And CAGR (%) By Applications (2018-2030)
Table 9 Global Organic Whey Revenue (USD Million) And CAGR (%) By Regions (2018-2030)
Table 10 Global Organic Whey Revenue (USD Million) By Type (2018-2022)
Table 11 Global Organic Whey Revenue Market Share (%) By Type (2018-2022)
Table 12 Global Organic Whey Revenue (USD Million) By Applications (2018-2022)
Table 13 Global Organic Whey Revenue Market Share (%) By Applications (2018-2022)
Table 14 Global Organic Whey Market Revenue (USD Million) By Regions (2018-2022)
Table 15 Global Organic Whey Market Share (%) By Regions (2018-2022)
Table 16 North America Organic Whey Revenue (USD Million) By Country (2018-2022)
Table 17 North America Organic Whey Revenue (USD Million) By Type (2018-2022)
Table 18 North America Organic Whey Revenue (USD Million) By Applications (2018-2022)
Table 19 Europe Organic Whey Revenue (USD Million) By Country (2018-2022)
Table 20 Europe Organic Whey Revenue (USD Million) By Type (2018-2022)
Table 21 Europe Organic Whey Revenue (USD Million) By Applications (2018-2022)
Table 22 Asia Pacific Organic Whey Revenue (USD Million) By Country (2018-2022)
Table 23 Asia Pacific Organic Whey Revenue (USD Million) By Type (2018-2022)
Table 24 Asia Pacific Organic Whey Revenue (USD Million) By Applications (2018-2022)
Table 25 South America Organic Whey Revenue (USD Million) By Country (2018-2022)
Table 26 South America Organic Whey Revenue (USD Million) By Type (2018-2022)
Table 27 South America Organic Whey Revenue (USD Million) By Applications (2018-2022)
Table 28 Middle East and Africa Organic Whey Revenue (USD Million) By Region (2018-2022)
Table 29 Middle East and Africa Organic Whey Revenue (USD Million) By Type (2018-2022)
Table 30 Middle East and Africa Organic Whey Revenue (USD Million) By Applications (2018-2022)
Table 31 Financial Analysis
Table 32 Global Organic Whey Revenue (USD Million) By Type (2023-2030)
Table 33 Global Organic Whey Revenue Market Share (%) By Type (2023-2030)
Table 34 Global Organic Whey Revenue (USD Million) By Applications (2023-2030)
Table 35 Global Organic Whey Revenue Market Share (%) By Applications (2023-2030)
Table 36 Global Organic Whey Market Revenue (USD Million), And Revenue (USD Million) By Regions (2023-2030)
Table 37 North America Organic Whey Revenue (USD)By Country (2023-2030)
Table 38 North America Organic Whey Revenue (USD Million) By Type (2023-2030)
Table 39 North America Organic Whey Revenue (USD Million) By Applications (2023-2030)
Table 40 Europe Organic Whey Revenue (USD Million) By Country (2023-2030)
Table 41 Europe Organic Whey Revenue (USD Million) By Type (2023-2030)
Table 42 Europe Organic Whey Revenue (USD Million) By Applications (2023-2030)
Table 43 Asia Pacific Organic Whey Revenue (USD Million) By Country (2023-2030)
Table 44 Asia Pacific Organic Whey Revenue (USD Million) By Type (2023-2030)
Table 45 Asia Pacific Organic Whey Revenue (USD Million) By Applications (2023-2030)
Table 46 South America Organic Whey Revenue (USD Million) By Country (2023-2030)
Table 47 South America Organic Whey Revenue (USD Million) By Type (2023-2030)
Table 48 South America Organic Whey Revenue (USD Million) By Applications (2023-2030)
Table 49 Middle East and Africa Organic Whey Revenue (USD Million) By Region (2023-2030)
Table 50 Middle East and Africa Organic Whey Revenue (USD Million) By Region (2023-2030)
Table 51 Middle East and Africa Organic Whey Revenue (USD Million) By Type (2023-2030)
Table 52 Middle East and Africa Organic Whey Revenue (USD Million) By Applications (2023-2030)
Table 53 Research Programs/Design for This Report
Table 54 Key Data Information from Secondary Sources
Table 55 Key Data Information from Primary Sources
List of Figures
Figure 1 Market Scope
Figure 2 Porter’s Five Forces
Figure 3 Global Organic Whey Revenue (USD Million) By Type (2018-2022)
Figure 4 Global Organic Whey Revenue Market Share (%) By Type (2022)
Figure 5 Global Organic Whey Revenue (USD Million) By Applications (2018-2022)
Figure 6 Global Organic Whey Revenue Market Share (%) By Applications (2022)
Figure 7 Global Organic Whey Market Revenue (USD Million) By Regions (2018-2022)
Figure 8 Global Organic Whey Market Share (%) By Regions (2022)
Figure 9 North America Organic Whey Revenue (USD Million) By Country (2018-2022)
Figure 10 North America Organic Whey Revenue (USD Million) By Type (2018-2022)
Figure 11 North America Organic Whey Revenue (USD Million) By Applications (2018-2022)
Figure 12 Europe Organic Whey Revenue (USD Million) By Country (2018-2022)
Figure 13 Europe Organic Whey Revenue (USD Million) By Type (2018-2022)
Figure 14 Europe Organic Whey Revenue (USD Million) By Applications (2018-2022)
Figure 15 Asia Pacific Organic Whey Revenue (USD Million) By Country (2018-2022)
Figure 16 Asia Pacific Organic Whey Revenue (USD Million) By Type (2018-2022)
Figure 17 Asia Pacific Organic Whey Revenue (USD Million) By Applications (2018-2022)
Figure 18 South America Organic Whey Revenue (USD Million) By Country (2018-2022)
Figure 19 South America Organic Whey Revenue (USD Million) By Type (2018-2022)
Figure 20 South America Organic Whey Revenue (USD Million) By Applications (2018-2022)
Figure 21 Middle East and Africa Organic Whey Revenue (USD Million) By Region (2018-2022)
Figure 22 Middle East and Africa Organic Whey Revenue (USD Million) By Type (2018-2022)
Figure 23 Middle East and Africa Organic Whey Revenue (USD Million) By Applications (2018-2022)
Figure 24 Global Organic Whey Revenue (USD Million) By Type (2023-2030)
Figure 25 Global Organic Whey Revenue Market Share (%) By Type (2030)
Figure 26 Global Organic Whey Revenue (USD Million) By Applications (2023-2030)
Figure 27 Global Organic Whey Revenue Market Share (%) By Applications (2030)
Figure 28 Global Organic Whey Market Revenue (USD Million) By Regions (2023-2030)
Figure 29 North America Organic Whey Revenue (USD Million) By Country (2023-2030)
Figure 30 North America Organic Whey Revenue (USD Million) By Type (2023-2030)
Figure 31 North America Organic Whey Revenue (USD Million) By Applications (2023-2030)
Figure 32 Europe Organic Whey Revenue (USD Million) By Country (2023-2030)
Figure 33 Europe Organic Whey Revenue (USD Million) By Type (2023-2030)
Figure 34 Europe Organic Whey Revenue (USD Million) By Applications (2023-2030)
Figure 35 Asia Pacific Organic Whey Revenue (USD Million) By Country (2023-2030)
Figure 36 Asia Pacific Organic Whey Revenue (USD Million) By Type (2023-2030)
Figure 37 Asia Pacific Organic Whey Revenue (USD Million) By Applications (2023-2030)
Figure 38 South America Organic Whey Revenue (USD Million) By Country (2023-2030)
Figure 39 South America Organic Whey Revenue (USD Million) By Type (2023-2030)
Figure 40 South America Organic Whey Revenue (USD Million) By Applications (2023-2030)
Figure 41 Middle East and Africa Organic Whey Revenue (USD Million) By Region (2023-2030)
Figure 42 Middle East and Africa Organic Whey Revenue (USD Million) By Region (2023-2030)
Figure 43 Middle East and Africa Organic Whey Revenue (USD Million) By Type (2023-2030)
Figure 44 Middle East and Africa Organic Whey Revenue (USD Million) By Applications (2023-2030)
Figure 45 Bottom-Up and Top-Down Approaches for This Report
Figure 46 Data Triangulation
