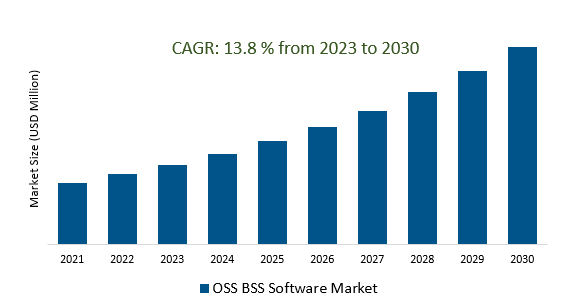
The OSS BSS Software Market Size is estimated to register 13.8% growth over the forecast period from 2023 to 2030.
OSS BSS Software Market Overview
The integration of OSS BSS systems with digital platforms to enable service providers to offer advanced and personalized services to customers is driving the market growth. The rollout of 5G networks demands robust OSS BSS solutions to manage network operations, ensure quality of service, and efficiently handle the increased complexity and volume of data. Organizations are seeking cloud-native systems to reduce infrastructure costs and enhance operational flexibility. Support virtualized and software-defined networks, allowing more agile and efficient network management are fueling the demand. Organizations are seeking OSS BSS solutions to enhance operational efficiency, streamline processes, and improve resource utilization, thereby optimizing overall business operations.
OSS BSS Software Market Dynamics
Market Trends- The adoption of cloud-native OSS/BSS solutions is driving transformative changes.
The adoption of cloud-based solutions is driven by the need for enhanced operational efficiency, rapid innovation, and the capability to swiftly introduce and manage new services.
Companies are offering unparalleled flexibility, enabling rapid adjustments to changing market conditions, and providing a competitive edge in meeting evolving customer expectations.
Cloud-native architectures are facilitating quicker innovation cycles, enabling faster development, testing, and deployment of new features or services, reducing time-to-market for new offerings.
Market Driver- Growing Demand for Digital Customer Experience (CX) in OSS BSS Software Market.
The rise of digital transformation in the telecommunications industry necessitates OSS/BSS platforms capable of supporting a diverse range of services and devices driving the market growth.
Providers are seeking software that leverages AI-driven analytics, automation, and machine learning to anticipate customer needs, resolve issues proactively, and optimize service quality, thereby fostering customer loyalty and reducing churn rates.
Furthermore, the shift towards subscription-based and usage-based billing models are driving the demand for OSS/BSS systems that offer flexible and transparent billing processes.
Market Opportunity- The 5G rollout is a pivotal driver influencing the evolution and development of OSS/BSS software.
The innovative service offerings and flexible pricing models, empowering telecom companies to capitalize on the diverse revenue streams that 5G enables are the key factors.
The complex architecture of 5G networks demands advanced capabilities to efficiently manage the increased data volumes, diverse services, and network slicing functionalities. Furthermore, the convergence of technologies like AI, automation, and edge computing is a significant business driver for 5G rollout.
Compliance with industry standards and regulatory requirements is imperative, driving the need for OSS/BSS systems that ensure data security, privacy, and adherence to evolving regulations.
Market Share Analysis - Business Support Systems (BSS) software will register the fastest growth.
The OSS BSS Software Market is analyzed across OSS Software & BSS Software. Business Support Systems (BSS) software is poised to register the fastest growth. Business Support Systems (BSS) software plays a pivotal role in managing and enhancing the customer-facing aspects of telecommunication services. They primarily focus on streamlining and optimizing business operations related to customer management, service delivery, billing, and revenue management. One of the key components of BSS software is customer management, encompassing functionalities for handling customer information, service subscriptions, and interactions. These systems are designed to provide a comprehensive view of customer profiles and preferences, allowing telecom operators to personalize services and interactions, thereby improving customer satisfaction and retention. Further, these systems enable flexible billing options, support various pricing models, and manage complex billing scenarios, including prepaid and postpaid services.
Market Share Analysis- SMEs held a significant market share in 2023.
The OSS BSS Software Market is analyzed across various Organizations including SMEs, Large Enterprises, and others. Of these, SMEs held a significant market share in 2023. SMEs operating within the OSS/BSS software domain often carve out their market presence by focusing on functionalities or addressing the unique needs of telecom operators. These companies, despite their smaller scale compared to industry giants, bring agility, flexibility, and niche expertise to the market. For instance, firms like Matrix Software specialize in digital commerce solutions, providing platforms that enable telecom operators to swiftly launch and monetize digital services, catering to the evolving demands of customers seeking personalized and innovative offerings. Amdocs and Net cracker, both considered SMEs in terms of company size, are notable for their comprehensive BSS (Business Support Systems) solutions. They specialize in customer management, billing systems, and service provisioning, delivering tailored solutions to telecom operators globally.
OSS BSS Software Market Segmentation
By Type
- OSS Software
- BSS Software
By Application
- BFSI
- IT & Telecom
- Media & Entertainment
- Others
By Enterprises
By Deployment Mode
By Region
- North America (United States, Canada, Mexico)
- Europe (Germany, France, United Kingdom, Spain, Italy, Others)
- Asia Pacific (China, India, Japan, South Korea, Australia, Others)
- Latin America (Brazil, Argentina, Others)
- Middle East and Africa (Saudi Arabia, UAE, Kuwait, Other Middle East, South Africa, Nigeria, Other Africa)
OSS BSS Software Market Companies
- Huawei Technologies (China)
- Accenture (Ireland)
- Ericsson (Sweden)
- Netcracker Technology Corporation (United States)
- AMDOCS (United States)
- Redknee (Canada)
- Aria Systems (United States)
- Cerillion (United Kingdom)
- Comarch (Poland)
- Comptel (Finland)
- Sterlite Technologies Ltd (India)
- Hewlett Packard Enterprise Development (United States)
- Hitachi Data Systems (United States)
- Oracle (United States)
- Global Convergence Solutions (United States)
- CSG International (United States)
*List not exhaustive
OSS BSS Software Market Outlook 2023
1 Market Overview
1.1 Introduction to the OSS BSS Software Market
1.2 Scope of the Study
1.3 Research Objective
1.3.1 Key Market Scope and Segments
1.3.2 Players Covered
1.3.3 Years Considered
2 Executive Summary
2.1 2023 OSS BSS Software Industry- Market Statistics
3 Market Dynamics
3.1 Market Drivers
3.2 Market Challenges
3.3 Market Opportunities
3.4 Market Trends
4 Market Factor Analysis
4.1 Porter’s Five Forces
4.2 Market Entropy
4.2.1 Global OSS BSS Software Market Companies with Area Served
4.2.2 Products Offerings Global OSS BSS Software Market
5 COVID-19 Impact Analysis and Outlook Scenarios
5.1.1 Covid-19 Impact Analysis
5.1.2 post-COVID-19 Scenario- Low Growth Case
5.1.3 post-COVID-19 Scenario- Reference Growth Case
5.1.4 post-COVID-19 Scenario- Low Growth Case
6 Global OSS BSS Software Market Trends
6.1 Global OSS BSS Software Revenue (USD Million) and CAGR (%) by Type (2018-2030)
6.2 Global OSS BSS Software Revenue (USD Million) and CAGR (%) by Applications (2018-2030)
6.3 Global OSS BSS Software Revenue (USD Million) and CAGR (%) by regions (2018-2030)
7 Global OSS BSS Software Market Revenue (USD Million) by Type, and Applications (2018-2022)
7.1 Global OSS BSS Software Revenue (USD Million) by Type (2018-2022)
7.1.1 Global OSS BSS Software Revenue (USD Million), Market Share (%) by Type (2018-2022)
7.2 Global OSS BSS Software Revenue (USD Million) by Applications (2018-2022)
7.2.1 Global OSS BSS Software Revenue (USD Million), Market Share (%) by Applications (2018-2022)
8 Global OSS BSS Software Development Regional Status and Outlook
8.1 Global OSS BSS Software Revenue (USD Million) By Regions (2018-2022)
8.2 North America OSS BSS Software Revenue (USD Million) by Type, and Application (2018-2022)
8.2.1 North America OSS BSS Software Revenue (USD Million) by Country (2018-2022)
8.2.2 North America OSS BSS Software Revenue (USD Million) by Type (2018-2022)
8.2.3 North America OSS BSS Software Revenue (USD Million) by Applications (2018-2022)
8.3 Europe OSS BSS Software Revenue (USD Million), by Type, and Applications (USD Million) (2018-2022)
8.3.1 Europe OSS BSS Software Revenue (USD Million), by Country (2018-2022)
8.3.2 Europe OSS BSS Software Revenue (USD Million) by Type (2018-2022)
8.3.3 Europe OSS BSS Software Revenue (USD Million) by Applications (2018-2022)
8.4 Asia Pacific OSS BSS Software Revenue (USD Million), and Revenue (USD Million) by Type, and Applications (2018-2022)
8.4.1 Asia Pacific OSS BSS Software Revenue (USD Million) by Country (2018-2022)
8.4.2 Asia Pacific OSS BSS Software Revenue (USD Million) by Type (2018-2022)
8.4.3 Asia Pacific OSS BSS Software Revenue (USD Million) by Applications (2018-2022)
8.5 South America OSS BSS Software Revenue (USD Million), by Type, and Applications (2018-2022)
8.5.1 South America OSS BSS Software Revenue (USD Million), by Country (2018-2022)
8.5.2 South America OSS BSS Software Revenue (USD Million) by Type (2018-2022)
8.5.3 South America OSS BSS Software Revenue (USD Million) by Applications (2018-2022)
8.6 Middle East and Africa OSS BSS Software Revenue (USD Million), by Type, Technology, Application, Thickness (2018-2022)
8.6.1 Middle East and Africa OSS BSS Software Revenue (USD Million) by Country (2018-2022)
8.6.2 Middle East and Africa OSS BSS Software Revenue (USD Million) by Type (2018-2022)
8.6.3 Middle East and Africa OSS BSS Software Revenue (USD Million) by Applications (2018-2022)
9 Company Profiles
10 Global OSS BSS Software Market Revenue (USD Million), by Type, and Applications (2023-2030)
10.1 Global OSS BSS Software Revenue (USD Million) and Market Share (%) by Type (2023-2030)
10.1.1 Global OSS BSS Software Revenue (USD Million), and Market Share (%) by Type (2023-2030)
10.2 Global OSS BSS Software Revenue (USD Million) and Market Share (%) by Applications (2023-2030)
10.2.1 Global OSS BSS Software Revenue (USD Million), and Market Share (%) by Applications (2023-2030)
11 Global OSS BSS Software Development Regional Status and Outlook Forecast
11.1 Global OSS BSS Software Revenue (USD Million) By Regions (2023-2030)
11.2 North America OSS BSS Software Revenue (USD Million) by Type, and Applications (2023-2030)
11.2.1 North America OSS BSS Software Revenue (USD) Million by Country (2023-2030)
11.2.2 North America OSS BSS Software Revenue (USD Million), by Type (2023-2030)
11.2.3 North America OSS BSS Software Revenue (USD Million), Market Share (%) by Applications (2023-2030)
11.3 Europe OSS BSS Software Revenue (USD Million), by Type, and Applications (2023-2030)
11.3.1 Europe OSS BSS Software Revenue (USD Million), by Country (2023-2030)
11.3.2 Europe OSS BSS Software Revenue (USD Million), by Type (2023-2030)
11.3.3 Europe OSS BSS Software Revenue (USD Million), by Applications (2023-2030)
11.4 Asia Pacific OSS BSS Software Revenue (USD Million) by Type, and Applications (2023-2030)
11.4.1 Asia Pacific OSS BSS Software Revenue (USD Million), by Country (2023-2030)
11.4.2 Asia Pacific OSS BSS Software Revenue (USD Million), by Type (2023-2030)
11.4.3 Asia Pacific OSS BSS Software Revenue (USD Million), by Applications (2023-2030)
11.5 South America OSS BSS Software Revenue (USD Million), by Type, and Applications (2023-2030)
11.5.1 South America OSS BSS Software Revenue (USD Million), by Country (2023-2030)
11.5.2 South America OSS BSS Software Revenue (USD Million), by Type (2023-2030)
11.5.3 South America OSS BSS Software Revenue (USD Million), by Applications (2023-2030)
11.6 Middle East and Africa OSS BSS Software Revenue (USD Million), by Type, and Applications (2023-2030)
11.6.1 Middle East and Africa OSS BSS Software Revenue (USD Million), by region (2023-2030)
11.6.2 Middle East and Africa OSS BSS Software Revenue (USD Million), by Type (2023-2030)
11.6.3 Middle East and Africa OSS BSS Software Revenue (USD Million), by Applications (2023-2030)
12 Methodology and Data Sources
12.1 Methodology/Research Approach
12.1.1 Research Programs/Design
12.1.2 Market Size Estimation
12.1.3 Market Breakdown and Data Triangulation
12.2 Data Sources
12.2.1 Secondary Sources
12.2.2 Primary Sources
12.3 Disclaimer
List of Tables
Table 1 Market Segmentation Analysis
Table 2 Global OSS BSS Software Market Companies with Areas Served
Table 3 Products Offerings Global OSS BSS Software Market
Table 4 Low Growth Scenario Forecasts
Table 5 Reference Case Growth Scenario
Table 6 High Growth Case Scenario
Table 7 Global OSS BSS Software Revenue (USD Million) And CAGR (%) By Type (2018-2030)
Table 8 Global OSS BSS Software Revenue (USD Million) And CAGR (%) By Applications (2018-2030)
Table 9 Global OSS BSS Software Revenue (USD Million) And CAGR (%) By Regions (2018-2030)
Table 10 Global OSS BSS Software Revenue (USD Million) By Type (2018-2022)
Table 11 Global OSS BSS Software Revenue Market Share (%) By Type (2018-2022)
Table 12 Global OSS BSS Software Revenue (USD Million) By Applications (2018-2022)
Table 13 Global OSS BSS Software Revenue Market Share (%) By Applications (2018-2022)
Table 14 Global OSS BSS Software Market Revenue (USD Million) By Regions (2018-2022)
Table 15 Global OSS BSS Software Market Share (%) By Regions (2018-2022)
Table 16 North America OSS BSS Software Revenue (USD Million) By Country (2018-2022)
Table 17 North America OSS BSS Software Revenue (USD Million) By Type (2018-2022)
Table 18 North America OSS BSS Software Revenue (USD Million) By Applications (2018-2022)
Table 19 Europe OSS BSS Software Revenue (USD Million) By Country (2018-2022)
Table 20 Europe OSS BSS Software Revenue (USD Million) By Type (2018-2022)
Table 21 Europe OSS BSS Software Revenue (USD Million) By Applications (2018-2022)
Table 22 Asia Pacific OSS BSS Software Revenue (USD Million) By Country (2018-2022)
Table 23 Asia Pacific OSS BSS Software Revenue (USD Million) By Type (2018-2022)
Table 24 Asia Pacific OSS BSS Software Revenue (USD Million) By Applications (2018-2022)
Table 25 South America OSS BSS Software Revenue (USD Million) By Country (2018-2022)
Table 26 South America OSS BSS Software Revenue (USD Million) By Type (2018-2022)
Table 27 South America OSS BSS Software Revenue (USD Million) By Applications (2018-2022)
Table 28 Middle East and Africa OSS BSS Software Revenue (USD Million) By Region (2018-2022)
Table 29 Middle East and Africa OSS BSS Software Revenue (USD Million) By Type (2018-2022)
Table 30 Middle East and Africa OSS BSS Software Revenue (USD Million) By Applications (2018-2022)
Table 31 Financial Analysis
Table 32 Global OSS BSS Software Revenue (USD Million) By Type (2023-2030)
Table 33 Global OSS BSS Software Revenue Market Share (%) By Type (2023-2030)
Table 34 Global OSS BSS Software Revenue (USD Million) By Applications (2023-2030)
Table 35 Global OSS BSS Software Revenue Market Share (%) By Applications (2023-2030)
Table 36 Global OSS BSS Software Market Revenue (USD Million), And Revenue (USD Million) By Regions (2023-2030)
Table 37 North America OSS BSS Software Revenue (USD)By Country (2023-2030)
Table 38 North America OSS BSS Software Revenue (USD Million) By Type (2023-2030)
Table 39 North America OSS BSS Software Revenue (USD Million) By Applications (2023-2030)
Table 40 Europe OSS BSS Software Revenue (USD Million) By Country (2023-2030)
Table 41 Europe OSS BSS Software Revenue (USD Million) By Type (2023-2030)
Table 42 Europe OSS BSS Software Revenue (USD Million) By Applications (2023-2030)
Table 43 Asia Pacific OSS BSS Software Revenue (USD Million) By Country (2023-2030)
Table 44 Asia Pacific OSS BSS Software Revenue (USD Million) By Type (2023-2030)
Table 45 Asia Pacific OSS BSS Software Revenue (USD Million) By Applications (2023-2030)
Table 46 South America OSS BSS Software Revenue (USD Million) By Country (2023-2030)
Table 47 South America OSS BSS Software Revenue (USD Million) By Type (2023-2030)
Table 48 South America OSS BSS Software Revenue (USD Million) By Applications (2023-2030)
Table 49 Middle East and Africa OSS BSS Software Revenue (USD Million) By Region (2023-2030)
Table 50 Middle East and Africa OSS BSS Software Revenue (USD Million) By Region (2023-2030)
Table 51 Middle East and Africa OSS BSS Software Revenue (USD Million) By Type (2023-2030)
Table 52 Middle East and Africa OSS BSS Software Revenue (USD Million) By Applications (2023-2030)
Table 53 Research Programs/Design for This Report
Table 54 Key Data Information from Secondary Sources
Table 55 Key Data Information from Primary Sources
List of Figures
Figure 1 Market Scope
Figure 2 Porter’s Five Forces
Figure 3 Global OSS BSS Software Revenue (USD Million) By Type (2018-2022)
Figure 4 Global OSS BSS Software Revenue Market Share (%) By Type (2022)
Figure 5 Global OSS BSS Software Revenue (USD Million) By Applications (2018-2022)
Figure 6 Global OSS BSS Software Revenue Market Share (%) By Applications (2022)
Figure 7 Global OSS BSS Software Market Revenue (USD Million) By Regions (2018-2022)
Figure 8 Global OSS BSS Software Market Share (%) By Regions (2022)
Figure 9 North America OSS BSS Software Revenue (USD Million) By Country (2018-2022)
Figure 10 North America OSS BSS Software Revenue (USD Million) By Type (2018-2022)
Figure 11 North America OSS BSS Software Revenue (USD Million) By Applications (2018-2022)
Figure 12 Europe OSS BSS Software Revenue (USD Million) By Country (2018-2022)
Figure 13 Europe OSS BSS Software Revenue (USD Million) By Type (2018-2022)
Figure 14 Europe OSS BSS Software Revenue (USD Million) By Applications (2018-2022)
Figure 15 Asia Pacific OSS BSS Software Revenue (USD Million) By Country (2018-2022)
Figure 16 Asia Pacific OSS BSS Software Revenue (USD Million) By Type (2018-2022)
Figure 17 Asia Pacific OSS BSS Software Revenue (USD Million) By Applications (2018-2022)
Figure 18 South America OSS BSS Software Revenue (USD Million) By Country (2018-2022)
Figure 19 South America OSS BSS Software Revenue (USD Million) By Type (2018-2022)
Figure 20 South America OSS BSS Software Revenue (USD Million) By Applications (2018-2022)
Figure 21 Middle East and Africa OSS BSS Software Revenue (USD Million) By Region (2018-2022)
Figure 22 Middle East and Africa OSS BSS Software Revenue (USD Million) By Type (2018-2022)
Figure 23 Middle East and Africa OSS BSS Software Revenue (USD Million) By Applications (2018-2022)
Figure 24 Global OSS BSS Software Revenue (USD Million) By Type (2023-2030)
Figure 25 Global OSS BSS Software Revenue Market Share (%) By Type (2030)
Figure 26 Global OSS BSS Software Revenue (USD Million) By Applications (2023-2030)
Figure 27 Global OSS BSS Software Revenue Market Share (%) By Applications (2030)
Figure 28 Global OSS BSS Software Market Revenue (USD Million) By Regions (2023-2030)
Figure 29 North America OSS BSS Software Revenue (USD Million) By Country (2023-2030)
Figure 30 North America OSS BSS Software Revenue (USD Million) By Type (2023-2030)
Figure 31 North America OSS BSS Software Revenue (USD Million) By Applications (2023-2030)
Figure 32 Europe OSS BSS Software Revenue (USD Million) By Country (2023-2030)
Figure 33 Europe OSS BSS Software Revenue (USD Million) By Type (2023-2030)
Figure 34 Europe OSS BSS Software Revenue (USD Million) By Applications (2023-2030)
Figure 35 Asia Pacific OSS BSS Software Revenue (USD Million) By Country (2023-2030)
Figure 36 Asia Pacific OSS BSS Software Revenue (USD Million) By Type (2023-2030)
Figure 37 Asia Pacific OSS BSS Software Revenue (USD Million) By Applications (2023-2030)
Figure 38 South America OSS BSS Software Revenue (USD Million) By Country (2023-2030)
Figure 39 South America OSS BSS Software Revenue (USD Million) By Type (2023-2030)
Figure 40 South America OSS BSS Software Revenue (USD Million) By Applications (2023-2030)
Figure 41 Middle East and Africa OSS BSS Software Revenue (USD Million) By Region (2023-2030)
Figure 42 Middle East and Africa OSS BSS Software Revenue (USD Million) By Region (2023-2030)
Figure 43 Middle East and Africa OSS BSS Software Revenue (USD Million) By Type (2023-2030)
Figure 44 Middle East and Africa OSS BSS Software Revenue (USD Million) By Applications (2023-2030)
Figure 45 Bottom-Up and Top-Down Approaches for This Report
Figure 46 Data Triangulation
