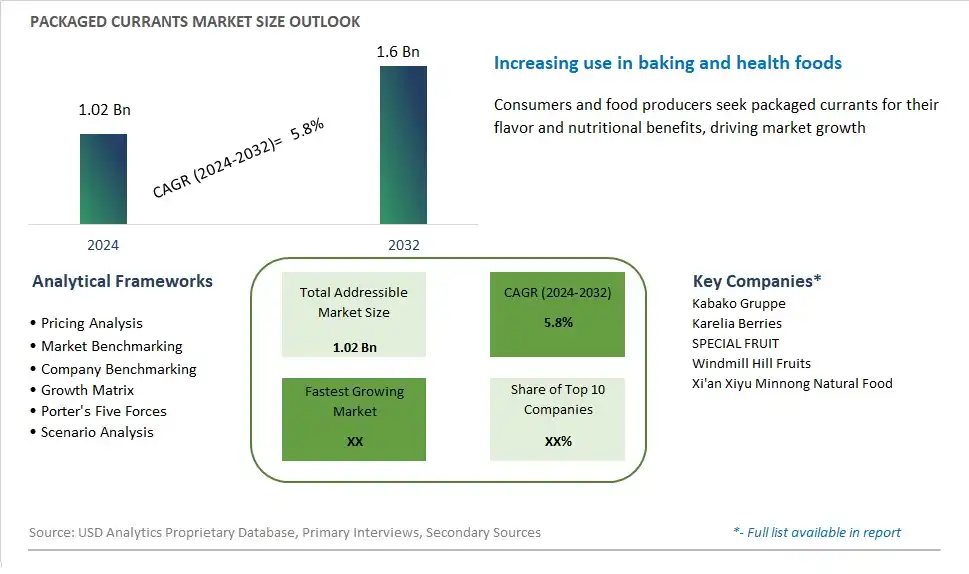
Global Packaged Currants Market Size is valued at $1.02 Billion in 2024 and is forecast to register a growth rate (CAGR) of 5.8% to reach $1.6 Billion by 2032.
The global Packaged Currants Market Comprehensive Study analyzes and forecasts the market size across 6 regions and 24 countries for diverse segments -By Type (Blackcurrant, Redcurrant, Others), By Application (Online Sales, Offline Sales)
An Introduction to Packaged Currants Market
Packaged Currants Market
Packaged Currants Competitive Landscape
The market report analyses the leading companies in the industry including Kabako Gruppe, Karelia Berries, SPECIAL FRUIT, Windmill Hill Fruits, Xi'an Xiyu Minnong Natural Food, and Others.
Packaged Currants Market Dynamics
Packaged Currants Market Trend: Rising Demand for Healthy Snacking Options
One notable trend in the packaged currants market is the increasing demand for healthy snacking options. As consumers become more health-conscious and seek nutritious alternatives to traditional snacks, there is a growing interest in dried fruits like currants, which are packed with vitamins, minerals, and antioxidants. Packaged currants offer a convenient and portable snack choice that can be enjoyed on its own or added to a variety of dishes, including cereals, salads, and baked goods. This trend is driven by the desire for snacks that provide sustained energy, support overall well-being, and align with dietary preferences such as vegan, gluten-free, and paleo diets. As a result, the demand for packaged currants as a healthy snacking option is expected to continue growing, especially among health-conscious consumers seeking flavorful and nutritious alternatives to processed snacks.
Market Driver: Increasing Awareness of Health Benefits
A key driver fueling the packaged currants market is the increasing awareness of the health benefits associated with consuming currants. Currants are rich in essential nutrients such as vitamin C, potassium, fiber, and antioxidants, which contribute to various health benefits, including immune support, heart health, and digestive wellness. As consumers become more informed about the nutritional value of foods and their impact on overall health, there is a growing interest in incorporating nutrient-dense ingredients like currants into their diets. Additionally, the rise of social media influencers, health bloggers, and wellness advocates has further amplified awareness of the health benefits of currants, driving consumer interest and adoption. This heightened awareness of the nutritional value and health benefits of currants serves as a significant driver for the growth of the packaged currants market.
Market Opportunity: Diversification of Product Offerings and Applications
An opportunity for market expansion in the packaged currants segment lies in diversifying product offerings and exploring new applications. While currants are commonly consumed as a standalone snack or added to baked goods, there is potential to introduce innovative product formats and applications to cater to evolving consumer preferences and usage occasions. Manufacturers can explore options such as flavored or coated currants, trail mixes incorporating currants, or inclusion in savory snack blends to appeal to a wider audience. Moreover, there is scope for collaboration with other food manufacturers to incorporate currants into new product formulations, such as granola bars, energy bites, or yogurt toppings, to offer consumers more convenient and versatile ways to enjoy currants. By capitalizing on opportunities for product innovation and diversification, companies can expand their market reach, attract new consumer segments, and drive growth in the packaged currants market.
Packaged Currants Market Share Analysis: Blackcurrant held the dominant market share in 2024
In the Packaged Currants Market segmented by type, Blackcurrant is the largest segment. This dominance can be attributed to several factors. Firstly, blackcurrants are widely recognized for their rich flavor profile and high nutritional value, containing antioxidants, vitamins, and minerals. Their versatility in culinary applications, including jams, juices, desserts, and baked goods, makes them a popular choice among consumers seeking both taste and health benefits. Additionally, blackcurrants have gained traction in the food and beverage industry due to their vibrant color and distinctive tartness, enhancing the visual appeal and flavor profile of various products. Further, the growing consumer preference for natural and functional ingredients has fueled the demand for blackcurrants, further solidifying their position as the largest segment in the Packaged Currants Market. As consumers continue to prioritize health-conscious choices and seek out innovative flavors, blackcurrants are poised to maintain their dominance in the market.
Packaged Currants Market Share Analysis: Online Sales market is poised to register the fastest growth rae over the forecast period to 2032
Among the segmented applications in the Packaged Currants Market, Online Sales emerge as the fastest-growing segment. This growth can be attributed to several factors. Firstly, the increasing popularity of e-commerce platforms provides consumers with convenient access to a wide variety of packaged currant products from the comfort of their homes. Online retailers offer a seamless shopping experience, with features such as user-friendly interfaces, personalized recommendations, and doorstep delivery services, catering to the evolving needs and preferences of consumers. Additionally, the COVID-19 pandemic has accelerated the shift towards online shopping as consumers prioritize safety and social distancing measures. Furthermore, online sales channels often provide promotional offers, discounts, and bundling options, attracting consumers seeking value for their purchases. As a result, the Online Sales segment is experiencing rapid growth in the Packaged Currants Market, capturing a larger share of consumer spending on currant products. With the continued digitalization of retail and the convenience-driven shopping behavior of consumers, the Online Sales segment is expected to maintain its momentum and emerge as a dominant distribution channel for packaged currants.
Packaged Currants Market Segmentation
By Type
Blackcurrant
Redcurrant
Others
By Application
Online Sales
Offline Sales
Countries Analyzed
North America (US, Canada, Mexico)
Europe (Germany, UK, France, Spain, Italy, Russia, Rest of Europe)
Asia Pacific (China, India, Japan, South Korea, Australia, South East Asia, Rest of Asia)
South America (Brazil, Argentina, Rest of South America)
Middle East and Africa (Saudi Arabia, UAE, Rest of Middle East, South Africa, Egypt, Rest of Africa)
Packaged Currants Companies Profiled in the Study
Kabako Gruppe
Karelia Berries
SPECIAL FRUIT
Windmill Hill Fruits
Xi'an Xiyu Minnong Natural Food
*- List Not Exhaustive
Chapter 1. TABLE OF CONTENTS
Chapter 2. Introduction to Packaged Currants Market
2.1. Market Overview
2.2. Key Statistics and Report Highlights
2.3. Scope of the Comprehensive Study
2.3.1. Market Definition
2.3.2 Countries and Regions Covered
2.3.3 Research Objective
2.3.4 Units, Currency, and Conversions
2.3.5 Industry Value Chain
2.4. Key Market Segments
2.5. Key Companies
2.6. Study Period
Chapter 3. Strategic Analysis Review
3.1. Packaged Currants Pricing Analysis and Forecast
3.2. Porter’s Five Forces
3.3. Market Ecosystem
3.4. SWOT Analysis
3.5. Regulatory Scenario
3.3. Effects of Inflation, Russia-Ukraine War, moderating economic growth, and other macroeconomic factors
Chapter 4. Competitive Landscape
4.1. Market Share Analysis
4.1.1. Global Packaged Currants Market Share by Company, 2023
4.1.2. Product Offerings of Leading Packaged Currants Companies
4.2. Market Entropy
4.2.1. New Product Launches in the Industry
4.2.2. Mergers, Acquisitions, Joint ventures, and Partnerships
4.3. Key Strategies and Best Practices
Chapter 5. Global Market Projections: Best, Reference, and Low Case Scenarios
5.1. Growth Analysis- Case Scenario Definitions
5.2. Low Growth Case Scenario Forecasts
5.3. Reference Growth Case Scenario Forecasts
5.4. High Growth Case Scenario Forecasts
Chapter 6. Market Dynamics
6.1. Packaged Currants Market Drivers
6.2. Packaged Currants Market Challenges
6.6. Packaged Currants Market Opportunities
6.4. Packaged Currants Market Trends
Chapter 7. Global Packaged Currants Market Outlook Trends
7.1. Global Packaged Currants Revenue (USD Million) and CAGR (%) by Type (2021-2032)
7.2. Global Packaged Currants Revenue (USD Million) and CAGR (%) by Application (2021-2032)
7.3. Global Packaged Currants Revenue (USD Million) and CAGR (%) by Product (2021-2032)
By Type
Blackcurrant
Redcurrant
Others
By Application
Online Sales
Offline Sales
Chapter 8. Global Packaged Currants Regional Analysis and Outlook
8.1. Global Packaged Currants Revenue (USD Million) By Regions (2021- 2032)
8.2. North America Packaged Currants Revenue (USD Million) by Country (2021-2032)
8.2.1. United States Packaged Currants Regional Analysis and Outlook
8.2.2. Canada Packaged Currants Regional Analysis and Outlook
8.2.3. Mexico Packaged Currants Regional Analysis and Outlook
8.3. Europe Packaged Currants Revenue (USD Million), by Country (2021-2032)
8.3.1. Germany Packaged Currants Regional Analysis and Outlook
8.3.2. France Packaged Currants Regional Analysis and Outlook
8.3.3. United Kingdom Packaged Currants Regional Analysis and Outlook
8.3.4. Spain Packaged Currants Regional Analysis and Outlook
8.3.5. Italy Packaged Currants Regional Analysis and Outlook
8.3.6. Russia Packaged Currants Regional Analysis and Outlook
8.3.7. Rest of Europe Packaged Currants Regional Analysis and Outlook
8.4. Asia Pacific Packaged Currants Revenue (USD Million) by Country (2021-2032)
8.4.1. China Packaged Currants Regional Analysis and Outlook
8.4.2. Japan Packaged Currants Regional Analysis and Outlook
8.4.3. India Packaged Currants Regional Analysis and Outlook
8.4.4. South Korea Packaged Currants Regional Analysis and Outlook
8.4.5. Australia Packaged Currants Regional Analysis and Outlook
8.4.6. South East Asia Packaged Currants Regional Analysis and Outlook
8.4.7. Rest of Asia Pacific Packaged Currants Regional Analysis and Outlook
8.5. South America Packaged Currants Revenue (USD Million), by Country (2021-2032)
8.5.1. Brazil Packaged Currants Regional Analysis and Outlook
8.5.2. Argentina Packaged Currants Regional Analysis and Outlook
8.5.3. Rest of South America Packaged Currants Regional Analysis and Outlook
8.6. Middle East and Africa Packaged Currants Revenue (USD Million) by Country (2021-2032)
8.6.1. Middle East Packaged Currants Regional Analysis and Outlook
8.6.2. Africa Packaged Currants Regional Analysis and Outlook
Chapter 9. North America Packaged Currants Analysis and Outlook
9.1. North America Packaged Currants Revenue (USD Million) by Segments (2021-2032)
9.1.1. North America Packaged Currants Revenue (USD Million) by Type (2021-2032)
9.1.2. North America Packaged Currants Revenue (USD Million) by Application (2021-2032)
9.1.3. North America Packaged Currants Revenue (USD Million) by Product (2021-2032)
By Type
Blackcurrant
Redcurrant
Others
By Application
Online Sales
Offline Sales
Chapter 10. Europe Packaged Currants Analysis and Outlook
10.1. Europe Packaged Currants Revenue (USD Million), by Segments (USD Million) (2021-2032)
10.1.1. Europe Packaged Currants Revenue (USD Million) by Type (2021-2032)
10.1.2. Europe Packaged Currants Revenue (USD Million) by Application (2021-2032)
10.1.3. Europe Packaged Currants Revenue (USD Million) by Product (2021-2032)
By Type
Blackcurrant
Redcurrant
Others
By Application
Online Sales
Offline Sales
Chapter 11. Asia Pacific Packaged Currants Analysis and Outlook
11.1. Asia Pacific Packaged Currants Revenue (USD Million), and Revenue (USD Million) by Segments (2021-2032)
11.1.1. Asia Pacific Packaged Currants Revenue (USD Million) by Type (2021-2032)
11.1.2. Asia Pacific Packaged Currants Revenue (USD Million) by Application (2021-2032)
11.1.3. Asia Pacific Packaged Currants Revenue (USD Million) by Product (2021-2032)
By Type
Blackcurrant
Redcurrant
Others
By Application
Online Sales
Offline Sales
Chapter 12. South America Packaged Currants Analysis and Outlook
12.1. South America Packaged Currants Revenue (USD Million), by Segments (2021-2032)
12.1.1. South America Packaged Currants Revenue (USD Million) by Type (2021-2032)
12.1.2. South America Packaged Currants Revenue (USD Million) by Application (2021-2032)
12.1.3. South America Packaged Currants Revenue (USD Million) by Product (2021-2032)
By Type
Blackcurrant
Redcurrant
Others
By Application
Online Sales
Offline Sales
Chapter 13. Middle East and Africa Packaged Currants Analysis and Outlook
13.1. Middle East and Africa Packaged Currants Revenue (USD Million), by Segments (2021-2032)
13.1.1. Middle East and Africa Packaged Currants Revenue (USD Million) by Type (2021-2032)
13.1.2. Middle East and Africa Packaged Currants Revenue (USD Million) by Application (2021-2032)
13.1.3. Middle East and Africa Packaged Currants Revenue (USD Million) by Product (2021-2032)
By Type
Blackcurrant
Redcurrant
Others
By Application
Online Sales
Offline Sales
Chapter 14. Packaged Currants Company Profiles
14.1 Business Overview
14.2 Product Profiles
14.3 SWOT Profiles
14.5 Recent Developments
14.6 Financial Profile
List of Companies
Kabako Gruppe
Karelia Berries
SPECIAL FRUIT
Windmill Hill Fruits
Xi'an Xiyu Minnong Natural Food
15. Methodology and Data Sources
15.1 Customization Offerings
15.2 Subscription Services
15.3 Related Reports
15.4 Publisher Expertise
LIST OF TABLES
Table 1 Market Segmentation Analysis
Table 2 Global Packaged Currants Market Share of Leading Companies, 2023
Table 3 Product Offerings of Leading Companies
Table 4 Low Growth Scenario Forecasts
Table 5 Reference Case Growth Scenario
Table 6 High Growth Case Scenario
Table 7 Global Packaged Currants Revenue (USD Million) And CAGR (%) By Type (2021-2032)
Table 8 Global Packaged Currants Revenue (USD Million) And CAGR (%) By Application (2021-2032)
Table 9 Global Packaged Currants Revenue (USD Million) And CAGR (%) By Product (2021-2032)
Table 10 Global Packaged Currants Market Revenue (USD Million) By Regions (2021-2032)
Table 11 Global Packaged Currants Market Share (%) By Regions (2021-2032)
Table 12 North America Packaged Currants Revenue (USD Million) By Country (2021-2032)
Table 13 Europe Packaged Currants Revenue (USD Million) By Country (2021-2032)
Table 14 Asia Pacific Packaged Currants Revenue (USD Million) By Country (2021-2032)
Table 15 South America Packaged Currants Revenue (USD Million) By Country (2021-2032)
Table 16 Middle East and Africa Packaged Currants Revenue (USD Million) By Region (2021-2032)
Table 17 North America Packaged Currants Revenue (USD Million) By Type (2021-2032)
Table 18 North America Packaged Currants Revenue (USD Million) By Application (2021-2032)
Table 19 North America Packaged Currants Revenue (USD Million) By Product (2021-2032)
Table 20 Europe Packaged Currants Revenue (USD Million) By Type (2021-2032)
Table 21 Europe Packaged Currants Revenue (USD Million) By Application (2021-2032)
Table 22 Europe Packaged Currants Revenue (USD Million) By Product (2021-2032)
Table 23 Asia Pacific Packaged Currants Revenue (USD Million) By Type (2021-2032)
Table 24 Asia Pacific Packaged Currants Revenue (USD Million) By Application (2021-2032)
Table 25 Asia Pacific Packaged Currants Revenue (USD Million) By Product (2021-2032)
Table 26 South America Packaged Currants Revenue (USD Million) By Type (2021-2032)
Table 27 South America Packaged Currants Revenue (USD Million) By Application (2021-2032)
Table 28 South America Packaged Currants Revenue (USD Million) By Product (2021-2032)
Table 29 Middle East and Africa Packaged Currants Revenue (USD Million) By Type (2021-2032)
Table 30 Middle East and Africa Packaged Currants Revenue (USD Million) By Application (2021-2032)
Table 31 Middle East and Africa Packaged Currants Revenue (USD Million) By Product (2021-2032)
LIST OF FIGURES
Figure 1. Market Scope
Figure 2. Pricing Forecasts Per Unit, 2023- 2032
Figure 3. Porter’s Five Forces
Figure 4. Global Packaged Currants Market Revenue (USD Million) By Regions (2021-2032)
Figure 5. Global Packaged Currants Market Share (%) By Regions (2023)
Figure 6. North America Packaged Currants Revenue (USD Million) By Country (2021-2032)
Figure 7. United States Packaged Currants Revenue (USD Million) By Country (2021-2032)
Figure 8. Canada Packaged Currants Revenue (USD Million) By Country (2021-2032)
Figure 9. Mexico Packaged Currants Revenue (USD Million) By Country (2021-2032)
Figure 10. Europe Packaged Currants Revenue (USD Million) By Country (2021-2032)
Figure 11. Germany Packaged Currants Revenue (USD Million) By Country (2021-2032)
Figure 12. France Packaged Currants Revenue (USD Million) By Country (2021-2032)
Figure 13. United Kingdom Packaged Currants Revenue (USD Million) By Country (2021-2032)
Figure 14. Spain Packaged Currants Revenue (USD Million) By Country (2021-2032)
Figure 15. Italy Packaged Currants Revenue (USD Million) By Country (2021-2032)
Figure 16. Russia Packaged Currants Revenue (USD Million) By Country (2021-2032)
Figure 17. Rest of Europe Packaged Currants Revenue (USD Million) By Country (2021-2032)
Figure 11. Asia Pacific Packaged Currants Revenue (USD Million) By Country (2021-2032)
Figure 12. China Packaged Currants Revenue (USD Million) By Country (2021-2032)
Figure 13. Japan Packaged Currants Revenue (USD Million) By Country (2021-2032)
Figure 14. India Packaged Currants Revenue (USD Million) By Country (2021-2032)
Figure 15. South Korea Packaged Currants Revenue (USD Million) By Country (2021-2032)
Figure 16. Australia Packaged Currants Revenue (USD Million) By Country (2021-2032)
Figure 17. South East Asia Packaged Currants Revenue (USD Million) By Country (2021-2032)
Figure 18. South America Packaged Currants Revenue (USD Million) By Country (2021-2032)
Figure 19. Brazil Packaged Currants Revenue (USD Million) By Country (2021-2032)
Figure 20. Argentina Packaged Currants Revenue (USD Million) By Country (2021-2032)
Figure 21. Rest of Asia Pacific Packaged Currants Revenue (USD Million) By Country (2021-2032)
Figure 22. Middle East and Africa Packaged Currants Revenue (USD Million) By Region (2021-2032)
Figure 23. Saudi Arabia Packaged Currants Revenue (USD Million) By Region (2021-2032)
Figure 24. The UAE Packaged Currants Revenue (USD Million) By Region (2021-2032)
Figure 25. Rest of Middle East Packaged Currants Revenue (USD Million) By Region (2021-2032)
Figure 26. South Africa Packaged Currants Revenue (USD Million) By Region (2021-2032)
Figure 27. Africa Packaged Currants Revenue (USD Million) By Region (2021-2032)
Figure 28. North America Packaged Currants Revenue (USD Million) By Type (2021-2032)
Figure 29. North America Packaged Currants Revenue (USD Million) By Application (2021-2032)
Figure 30. North America Packaged Currants Revenue (USD Million) By Product (2021-2032)
Figure 31. Europe Packaged Currants Revenue (USD Million) By Type (2021-2032)
Figure 32. Europe Packaged Currants Revenue (USD Million) By Application (2021-2032)
Figure 33. Europe Packaged Currants Revenue (USD Million) By Product (2021-2032)
Figure 34. Asia Pacific Packaged Currants Revenue (USD Million) By Type (2021-2032)
Figure 35. Asia Pacific Packaged Currants Revenue (USD Million) By Application (2021-2032)
Figure 36. Asia Pacific Packaged Currants Revenue (USD Million) By Product (2021-2032)
Figure 37. South America Packaged Currants Revenue (USD Million) By Type (2021-2032)
Figure 38. South America Packaged Currants Revenue (USD Million) By Application (2021-2032)
Figure 39. South America Packaged Currants Revenue (USD Million) By Product (2021-2032)
Figure 40. Middle East and Africa Packaged Currants Revenue (USD Million) By Type (2021-2032)
Figure 41. Middle East and Africa Packaged Currants Revenue (USD Million) By Application (2021-2032)
Figure 42. Middle East and Africa Packaged Currants Revenue (USD Million) By Product (2021-2032)
By Type
Blackcurrant
Redcurrant
Others
By Application
Online Sales
Offline Sales
Countries Analyzed
North America (US, Canada, Mexico)
Europe (Germany, UK, France, Spain, Italy, Russia, Rest of Europe)
Asia Pacific (China, India, Japan, South Korea, Australia, South East Asia, Rest of Asia)
South America (Brazil, Argentina, Rest of South America)
Middle East and Africa (Saudi Arabia, UAE, Rest of Middle East, South Africa, Egypt, Rest of Africa)
